. 2023 Feb;4(2):148-159.
doi: 10.1038/s43016-023-00695-z. Epub 2023 Feb 16.

Plant-biomass-based hybrid seed wraps mitigate yield and post-harvest losses among smallholder farmers in sub-Saharan Africa

Affiliations

Plant-biomass-based hybrid seed wraps mitigate yield and post-harvest losses among smallholder farmers in sub-Saharan Africa

Tahira Pirzada et al. Nat Food. 2023 Feb.

Abstract

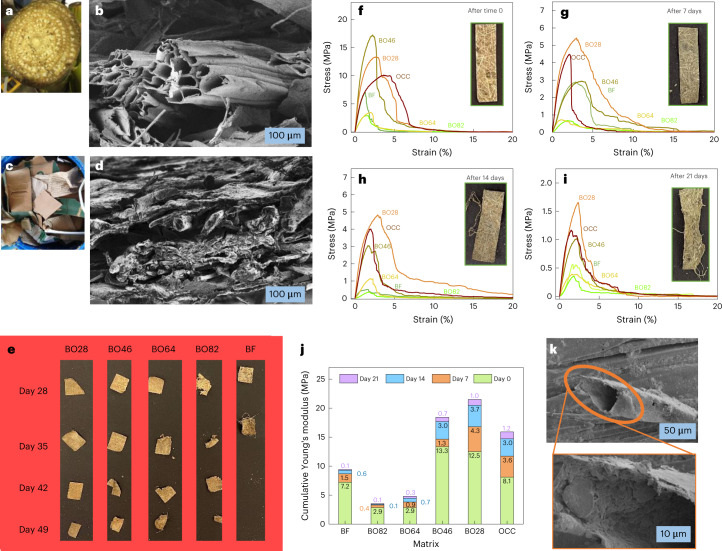
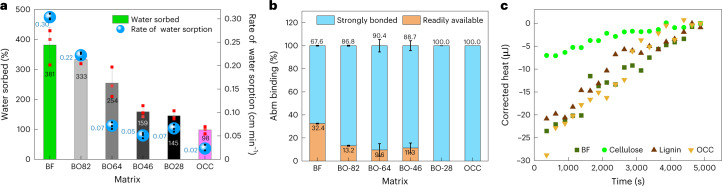
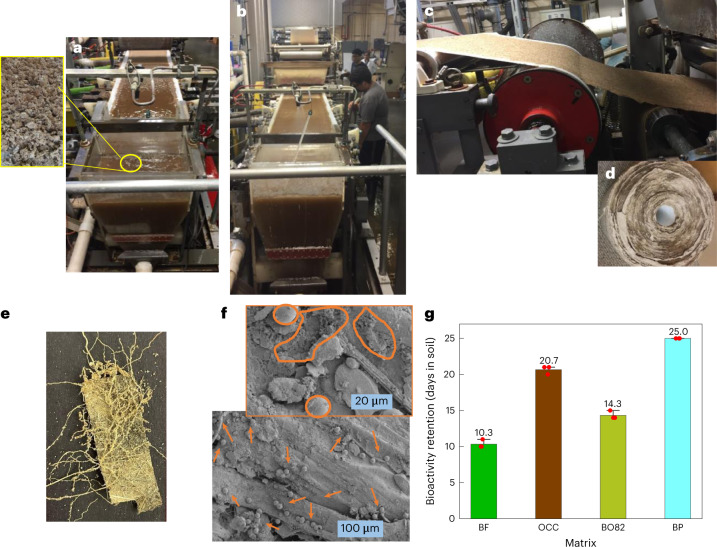
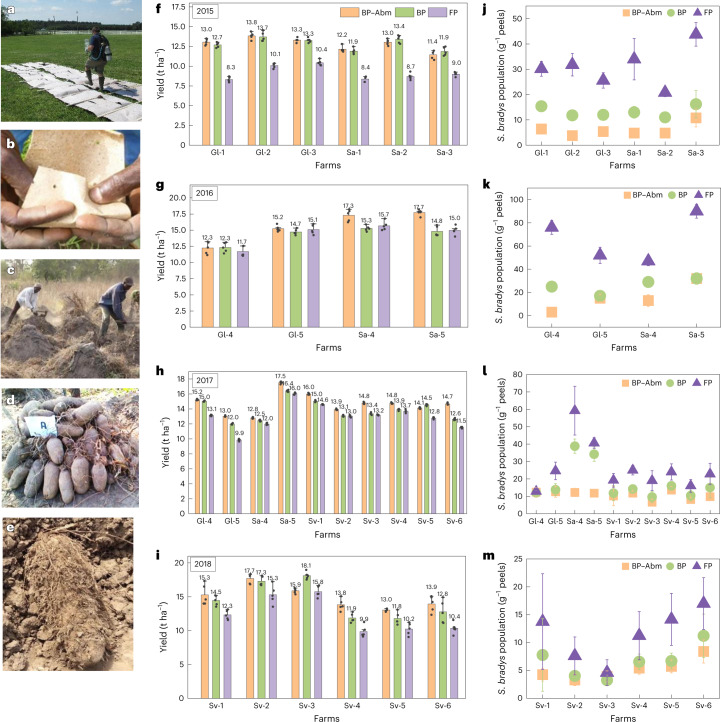
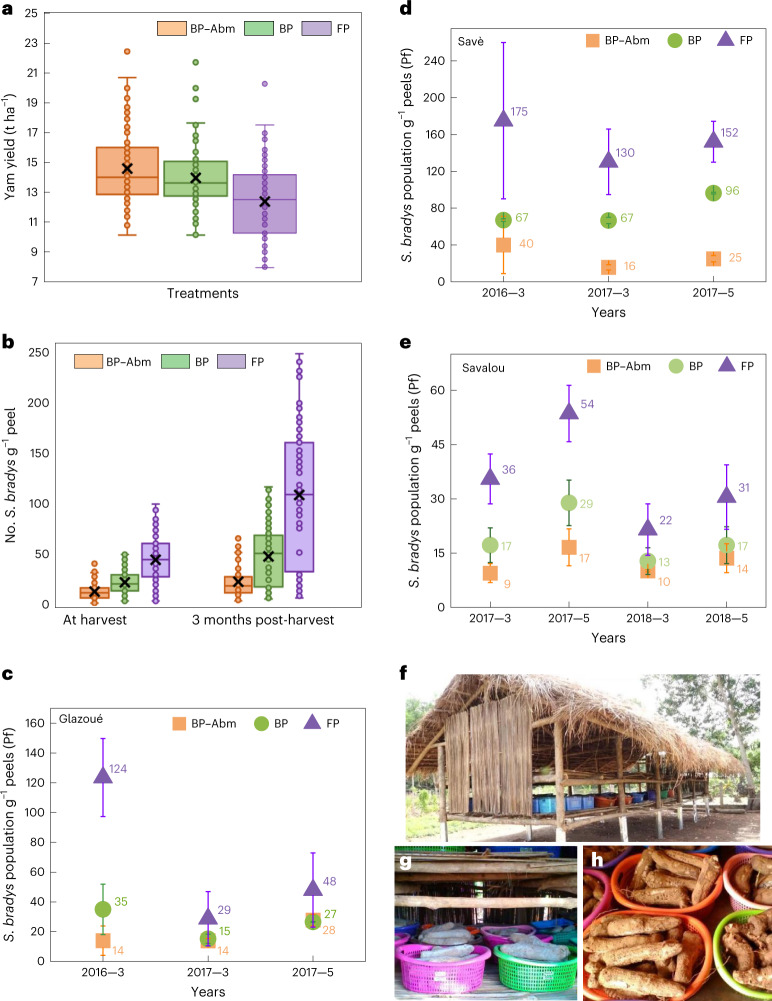
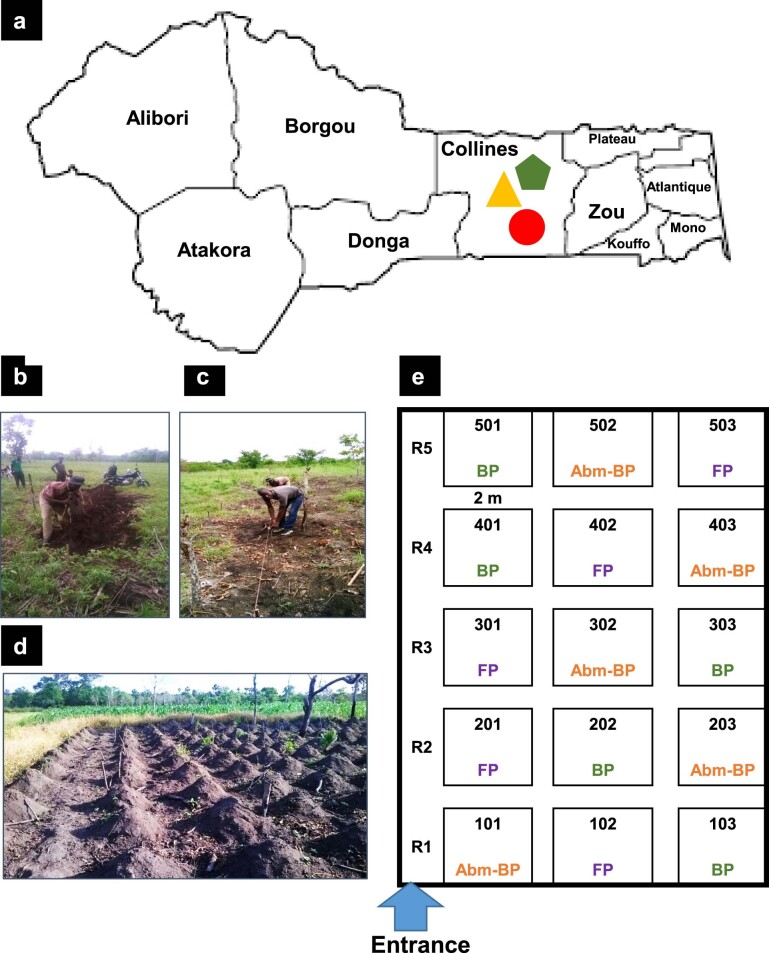
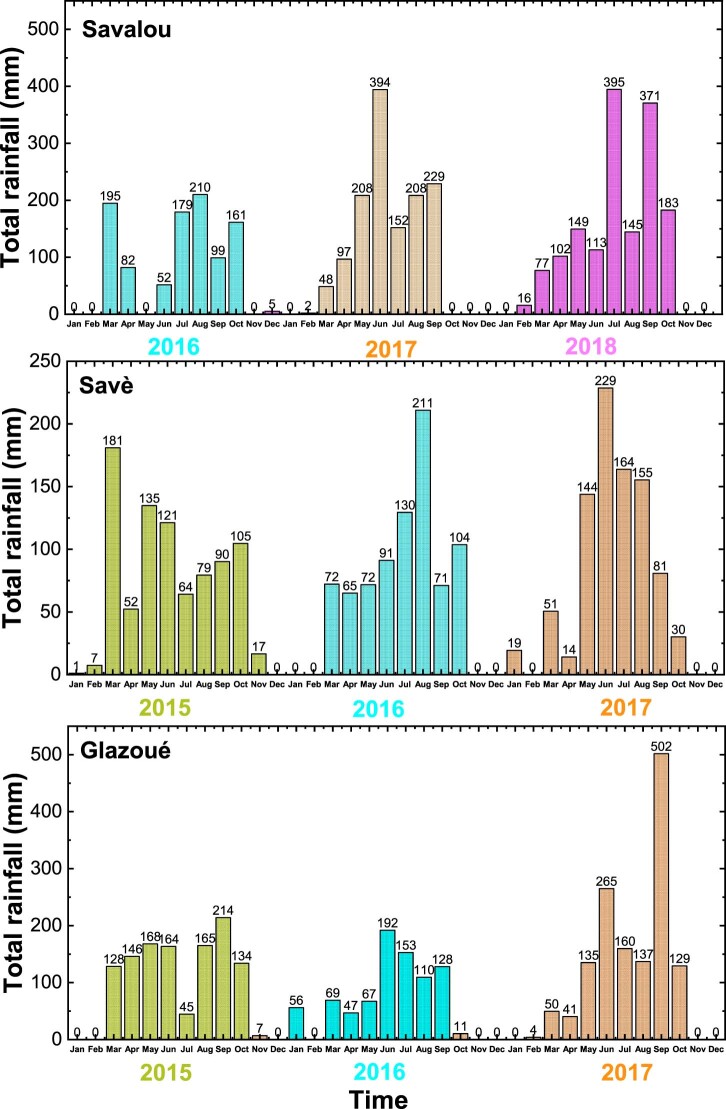
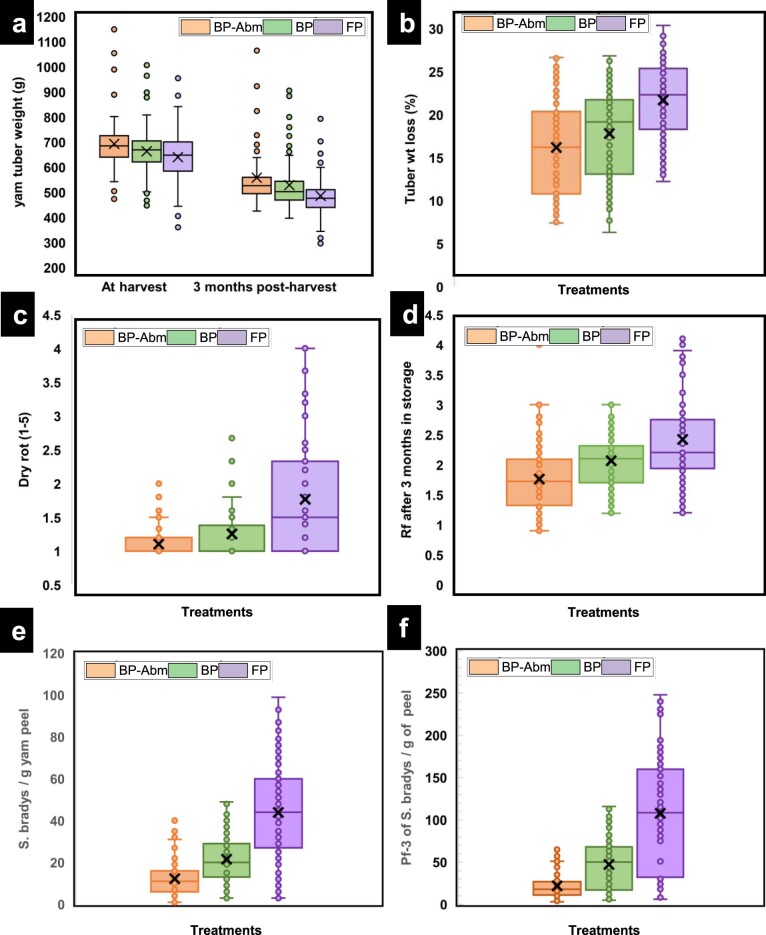
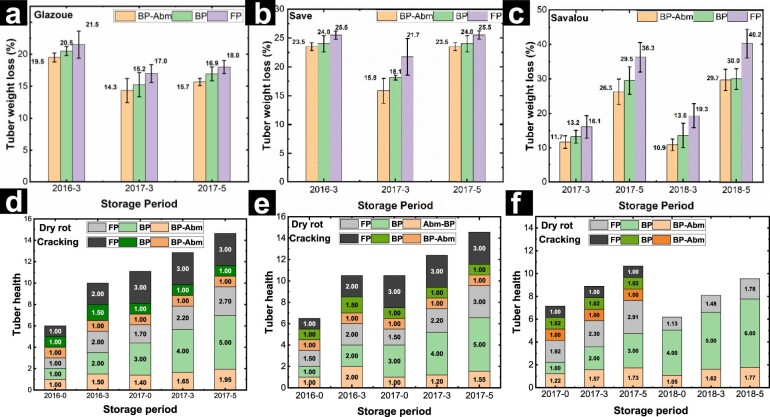
Sustainable practices that reduce food loss are essential for enhancing global food security. We report a 'wrap and plant' seed treatment platform to protect crops from soil-borne pathogens. Developed from the abundantly available wastes of banana harvest and recycled old, corrugated cardboard boxes via chemical-free pulping, these paper-like biodegradable seed wraps exhibit tunable integrity and bioavailability of loaded moieties. These wraps were used for nematode control on yam (Dioscorea cayenensis-rotundata) seed pieces in Benin, a major producer of this staple crop in the sub-Saharan African 'yam belt'. Our seed wraps loaded with ultra-low-volume abamectin (1/100 ≤ commercial formulation) consistently controlled yam nematode (Scutellonema bradys) populations while considerably increasing the yield at various locations over 2015-2018. Substantial reduction in post-harvest tuber weight loss and cracking was observed after 3 and 5 months of storage, contributing to increased value, nutrition and stakeholders' preference for the wrap and plant treatment.


Conflict of interest statement

The authors declare no competing interests.

Figures

Fig. 1
Fig. 1. Structure of raw BF and OCC, and mechanical strength of them and their hybrids in the soil.
a,b, Photograph of banana pseudostem (a) and representative SEM cross-sections of BF paper (b; three samples of different BF papers were scanned at five different magnifications to verify the reproducibility of data). c,d, Photograph of OCC boxes (c) and cross-section SEM of OCC paper (d; three samples of different OCC papers were scanned at five different magnifications to verify the reproducibility of data). e, Photographs showing pieces of BF and hybrid papers (BO82, BO64, BO46 and BO28) removed from the soil after 4, 5, 6 and 7 weeks. fi, Stress–strain plots of paper made from BF, BO82, BO64, BO46, BO28 and OCC before burying in the soil (f) and after 1 (g), 2 (h) and 3 (i) weeks of incubation with roots of live tomato plants in soil. Insets show photographs of the corresponding BF after removal from soil. j, Plot showing cumulative Young’s moduli of BF, BO82, BO64, BO46, BO28 and OCC papers before and after incubation in soil for 1, 2 and 3 weeks. k, High- and low-magnification SEM images showing soil particles coating the surface and the hollow interior of a banana fibre from BF paper buried in soil for 21 days. Source data
Fig. 2
Fig. 2. Nature and extent of interactions of BF, OCC and hybrids with water and Abm.
a, Water sorbed and rate of movement of water by various matrices (n = 5, error bars indicate standard deviation from the mean values of amount (%) and rate of water sorbed by BF, OCC and various hybrids). b, Strongly and weakly bound Abm content, in BF, OCC and hybrid paper (n = 3, error bars represent standard deviation from the mean values of strongly and weakly sorbed Abm on the respective matrices). c, ITC thermogram displaying heat released resulting from interactions between Abm with OCC, BF, lignin and cellulose. Source data
Fig. 3
Fig. 3. Pilot-scale production and quality evaluation of banana paper.
ad, Photographs showing paper production on a Fourdrinier machine from a slurry of fibres from the headbox (a), which is evenly spread and dewatered to produce wet fibrous sheet on the wire section (b) and, on further removal of water in the press and dryer sections (c), is converted to a paper roll (d). e, Photograph of banana paper with tomato roots penetrated after keeping in the soil with a tomato plant for 21 days. f, High- and low-magnification SEM images of the surface section of banana paper kept in soil for 28 days. Arrowheads in the bottom micrograph and encircled areas in the top indicate presence of spores of soil microorganisms. g, Plot showing data distribution and standard deviation in the mean value of bioavailability of Abm from BF, OCC, BO82 and BP after keeping in soil for 25 days (n = 3). Source data
Fig. 4
Fig. 4. Field trials photographs and data showing yield and S. bradys population in tuber peels.
ae, Photographs showing paper being sprayed with Abm at the North Carolina State University turfgrass site (a), a yam seed piece being wrapped in paper (b), harvest in yam fields (c), healthy tubers obtained after W&P treatment with BP–Abm (d) and tubers produced using FP. (e). fi, Plots showing data distribution and standard deviation in the mean value (shown as individual labels for each bar) in the yield of yam crops in t ha−1 in Glazoué (Gl-1, Gl-2, Gl-3, Gl-4, Gl-5), Savè (Sa-1, Sa-2, Sa-3, Sa-4, Sa-5) and Savalou (Sv-1, Sv-2, Sv-3, Sv-4, Sv-5, Sv-6) as a result of field trials conducted in 2015 (f), 2016 (g), 2017 (h) and 2018 (i; n = 5 for each treatment (FP, BP–Abm and BP) in each field). jm, Plots showing population of S. bradys per gram of tuber peels at harvest in Glazoué, Savè and Savalou from field trials conducted in 2015 (j), 2016 (k), 2017 (l) and 2018 (m; n = 3 for peels removed from each treatment (FP, BP–Abm and BP) in each plot). The letters in the acronyms refer to the names of the county, while the numbers indicate the farm number in the respective county, that is, Glazoué, Save and Savalou, which were part of this study. FP = farmers’ practice (no wrap, no Abm); BP = paper only; BP–Abm = Abm-loaded paper. Error bars in all the plots indicate standard deviation from the arithmetic means. Source data
Fig. 5
Fig. 5. Tuber quality evaluation during storage.
a, Yam yield in t ha−1 as influenced by W&P treatments for 2015–2018 field trials (lsd = 0.34, α = 0.01). b, Statistical data showing influence of BP–Abm, BP and FP treatments in field trials from 2015 to 2018 on population density of S. bradys per gram of yam peel at harvest and 3 months post-harvest (lsd =1.41 and 2.95, respectively, α = 0.01). ce, Plots showing S.bradys final population (Pf) after storing tubers (produced after FP, BP and BP–Abm treatments) for 3 and 5 months in Glazoué (c), Savè (d) and Savalou (e) regions (n = 3 for each treatment). Numbers 3 and 5 after each year on the x-axis labels indicate the storage time in months. Tubers collected from different sites were stored in the same yam barn, so the storability experiment was conducted in the same climatic conditions to avoid the influence on the results. fh, Photographs showing yam tubers stored to evaluate tuber weight, quality and S. bradys population (f), individually labelled porous containers filled with yam tubers produced after treatment and FP (g) and tubers with peels removed for sampling (h). Data analysis in panels a and b consists of one-way ANOVA for a randomized complete block design with three treatments and five replications. Combined analysis was done as for a factorial design with three treatments (BP–Abm, BP and FP), five replications, 26 farms and 4 years with no adjustments. All data analysis was accomplished using the general linear models procedure of PC/SAS software (SAS Institute). Mean separation was done by Waller–Duncan k-ratio t-test. Boxes are bounded by quartile 1 (bottom, 25th percentile) and quartile 3 (75th percentile), whiskers as minimum (quartile 1 − 1.5 × interquartile range) and maximum (quartile 3 + 1.5 × interquartile range), median defined by the line in the box (interquartile range), mean depicted by X and outliers depicted by dots. Error bars in panels ae indicate standard deviation from the arithmetic means (shown as respective labels). Source data
Extended Data Fig. 1
Extended Data Fig. 1. Physical attributes of handsheets made from BF, OCC and hybrid fibers.
SEM images showing surface sections of paper made from (a) banana fiber (BF) and (b) OCC. SEM images showing variation in the fiber morphology of the cross sections of the handsheets developed from BF:OCC fibers mixed in various proportions, (c) BO82 (80:20), (d) BO64 (60:40), (e) BO46 (40:60) and (f) BO28 (20:80). 3 independent replicates of each sample were scanned at 5 different magnifications to verify the reproducibility of data. Plots showing variation in (g) burst indices and (h) density and air resistance (inversely related to porosity) of the handsheets prepared from BF, OCC and hybrid fibers (BO). Error bars represent standard deviation in the respective mean values of 10 independent replicates. handsheets. Source data
Extended Data Fig. 2
Extended Data Fig. 2. Biodegradability and soil integrity.
(a-d) Photographs showing the design of soil integrity studies in the greenhouse using tomato plant as a bioindicator. (e) Schematic proposing the design of ‘W&P’ test based on soil integrity studies. (f) Photographs showing various samples before and after keeping in the soil for 7, 14 and 21 days. SEM images showing the surface section of (g) BF, (h) BO82, (i) BO64, (j) BO46, (k) BO28 and (l) OCC after removing from the soil after 21 days. Red arrowheads show spores of soil micro/macro-organisms. Typically, 3 independent replicates of each sample were scanned at 5 different magnifications to verify the reproducibility of data.
Extended Data Fig. 3
Extended Data Fig. 3. Structure, soil integrity & bioactivity retention of banana paper.
(a) X-ray tomograph showing 3D random orientation and loose packing of fibers in banana paper. Two independent replicates of banana paper were scanned at different magnifications and locations to verify the reproducibility of data. (b) High and low magnification SEM images showing morphology of a cross section of banana paper. Three independent replicates of the paper were scanned at 5 different magnifications to verify the reproducibility of data. (c) Stress-strain plot of as-prepared banana paper (BP-0), and after keeping in soil for 7 (BP-7), 14 (BP-14) and 21 days (BP-21). Typically three independent replicates of each sample are tested to verify the reproducibility of data. (d) Plot showing bioavailability of Abm from BF, OCC, BO82 and BP after 15 hydration cycles (n = 3). Error bars show standard deviation in the mean bioavailability data in each case. Source data
Extended Data Fig. 4
Extended Data Fig. 4. Field trials design & setup.
(a) Map showing Savé (green), Glazoué (orange) and Savalou (red) regions in Benin.The base map was applied without endorsement using data from the Database of Global Administrative Areas (GADM; https://gadm.org/). (b-d) Photographs showing preparation and set up of yam fields. (e) Schematic showing randomized complete block design of a field with plots treated with abamectin loaded banana paper (BP-Abm), banana paper only (BP) and untreated control referred as Farmers’ practice (FP).
Extended Data Fig. 5
Extended Data Fig. 5. Rainfall patterns in Glazoue, Save and Savalou.
Rainfall data for Savé (2015-2017), Galzoué (2015-2017) and Savalou (2017-2018). Source data
Extended Data Fig. 6
Extended Data Fig. 6. Effect of treatments on yield & tuber storage.
Data showing (a) Yam tuber wt (g / tuber) at harvest and 3 months post-harvest (least significant difference (lsd) 31.2 and 26.5 respectively α = 0.01), (b) percent weight loss of tubers after 3 months storage. (lsd = 0.81, α = 0.01), (c) Yam dry rot on a 1- 5 scale as influenced by W&P treatments (lsd = 0.10, alpha 0.01)., and (d) 3 months post-harvest reproductive factor (Rf 3 = population density at 3 months / initial {harvest} population density / g of yam peel) for Scutellonema bradys (lsd =0.12, α = 0.01), (e) Influence of W&P treatments on final population density of Scutellonema bradys per gram of yam peal from 2015-2018 (least significant difference =1.41,α = 0.01), and (f) Population density (Pf3/g of yam peel) 3 months post harvest for Scutellonema bradys as affected by W&P treatments from 2016 – 2018 (lsd = 2.95, α = 0.01). Data analysis consisted of one-way Analysis of Variance (ANOVA) for a randomized complete block design with three treatments and five replications. Combined analysis was done as for a factorial design with three treatments (BP-Abm, BP and FP), five replications, 26 farms, and four years with no adjustments. All data analysis was accomplished using the General linear models procedure (PROC GLM) of PC/SAS software (SAS Institute, Cary, NC). Mean separation was by Waller-Duncan K-ratio t-test. Boxes are bounded by Q1 (bottom, 25th percentile) and Q3 (75th percentile), whiskers as minimum (Q1-1.5*IQR) and maximum (Q3 + 1.5*IQR), median defined by line in the box (IQR), mean depicted by X, outliers depicted by dots. Source data
Extended Data Fig. 7
Extended Data Fig. 7. Post-harvest tuber quality evaluation.
Post-harvest data showing tuber weight loss and tuber health (dry rot and cracking) after 3- and 5- month storage in (a) & (d) Glazoué (2016-2017), (b) & (e) Savé (2016-2017) and (c) & (f) Savalou (2017-2018) regions. Error bars in part a-c indicate standard deviation from the arithmetic means. Source data

References

    1. Cui Z, et al. Pursuing sustainable productivity with millions of smallholder farmers. Nature. 2018;555:363–366. doi: 10.1038/nature25785. - DOI - PubMed
    1. Shepard, D. Growing at a Slower Pace, World Population is Expected to Reach 9.7 Billion in 2050 and Could Peak at Nearly 11 Billion Around 2100: UN Report (United Nations, 2019).
    1. Vollset SE, et al. Fertility, mortality, migration, and population scenarios for 195 countries and territories from 2017 to 2100: a forecasting analysis for the Global Burden of Disease study. Lancet. 2020;396:1285–1306. doi: 10.1016/S0140-6736(20)30677-2. - DOI - PMC - PubMed
    1. Giller KE. The food security conundrum of sub-Saharan Africa. Glob. Food Sec. 2020;26:100431. doi: 10.1016/j.gfs.2020.100431. - DOI
    1. Adenle AA, Wedig K, Azadi H. Sustainable agriculture and food security in Africa: the role of innovative technologies and international organizations. Technol. Soc. 2019;58:101143. doi: 10.1016/j.techsoc.2019.05.007. - DOI

Publication types