. 2022 May;2(5):412-424.
doi: 10.1038/s43587-022-00219-7. Epub 2022 May 9.

Deep learning-based brain age prediction in normal aging and dementia

Affiliations

Deep learning-based brain age prediction in normal aging and dementia

Jeyeon Lee et al. Nat Aging. 2022 May.

Abstract

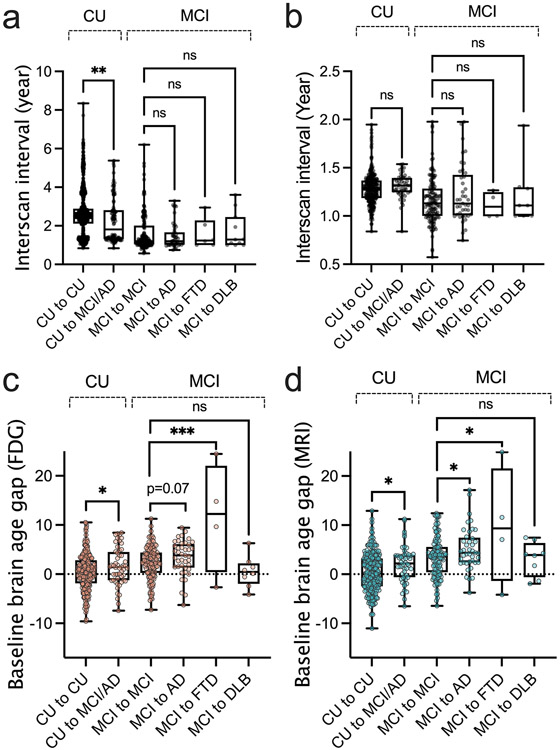
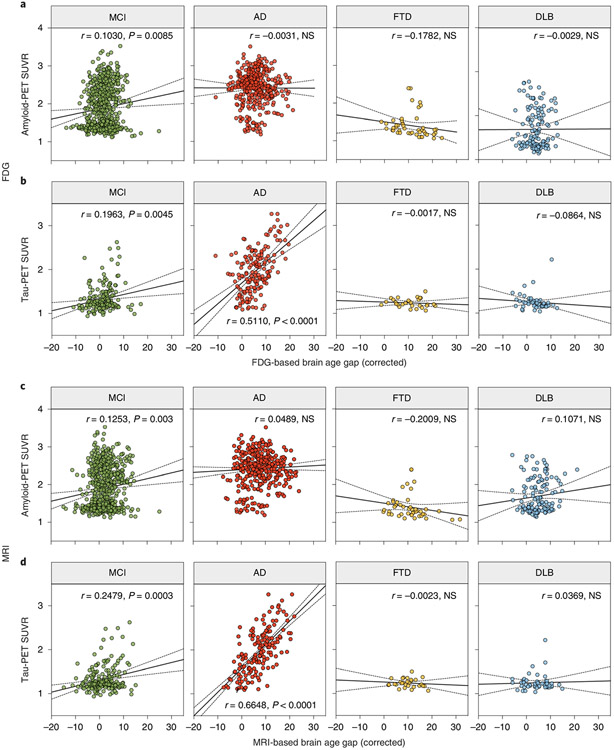
Brain aging is accompanied by patterns of functional and structural change. Alzheimer's disease (AD), a representative neurodegenerative disease, has been linked to accelerated brain aging. Here, we developed a deep learning-based brain age prediction model using a large collection of fluorodeoxyglucose positron emission tomography and structural magnetic resonance imaging and tested how the brain age gap relates to degenerative syndromes including mild cognitive impairment, AD, frontotemporal dementia and Lewy body dementia. Occlusion analysis, performed to facilitate the interpretation of the model, revealed that the model learns an age- and modality-specific pattern of brain aging. The elevated brain age gap was highly correlated with cognitive impairment and the AD biomarker. The higher gap also showed a longitudinal predictive nature across clinical categories, including cognitively unimpaired individuals who converted to a clinical stage. However, regions generating brain age gaps were different for each diagnostic group of which the AD continuum showed similar patterns to normal aging.


Figures

Extended Data Fig. 1 ∣
Extended Data Fig. 1 ∣. Brain age predictions on the ADNI dataset.
(a-f) 3D Densenet model trained on the Mayo dataset was applied to the ADNI data. (a-c) FDG based brain age prediction. (d-f) MRI based brain age prediction. (g-l) Prediction performance of 3D Densenet model trained on the Mayo and ADNI dataset together. (g-i) FDG based brain age prediction. (j-l) MRI based brain age prediction. The black solid line and dotted lines in each figure represent a regression line and its 95% confidence bands, respectively. m, The corrected MAE evaluated on the test data (n = 5) was compared between the datasets using a two–sided two-sample Student's t-test. The data is shown as mean ± SD. * p < 0.05, ** p < 0.005.
Extended Data Fig. 2 ∣
Extended Data Fig. 2 ∣. Regional mean saliency.
After calculating the saliency map from occlusion analysis, mean saliency value was calculated for each ROI. Box plots represent the minimum and maximum values (whiskers), the first and third quartile (box boundaries), and the median (internal line) for the 5-fold cross-validations (n = 5). Yellow-colored boxes indicate the left hemisphere and blue-colored boxes indicate the right hemisphere.
Extended Data Fig. 3 ∣
Extended Data Fig. 3 ∣. Comparison of correlation between FDG- and MRI-based brain age gap.
Error bars indicate 95% confidence intervals of Pearson’s correlation coefficient. A statistical comparison was performed with the CU group. Pearson’s r (95% confidence interval) = 0.5873 (0.5628 to 0.6108), 0.6396 (0.5945 to 0.6847), 0.6735 (0.6138 to 0.7255), 0.7824 (0.6697 to 0.8598), and 0.6548 (0.5489 to 0.7400), for CU, MCI, AD, FTD, and DLB, respectively. Exact p values: CU versus MCI, p = 1.5 × 10⁻⁹; CU versus AD, p < 1 × 10⁻¹⁵; CU versus FTD, p < 1 × 10⁻¹⁵; CU versus DLB, p < 1 × 10⁻¹⁵, *** p < 0.001. *** p < 0.001, two-sided z test after Fisher’s r to z transformation.
Extended Data Fig. 4 ∣
Extended Data Fig. 4 ∣. Regression plots of a corrected brain age gap as a function of chronological age for clinical diagnostic groups in ADNI cohort.
a, Violin plots of corrected brain age gap for each diagnostic group. The corrected brain age gap of disease groups was compared with CU using one-way ANOVA with Holm-Sidak’s multiple comparisons test. *** p < 0.001. b, FDG-based brain age gap estimation for MCI and AD, respectively. c, Violin plots of corrected brain age gap for each clinical diagnosis group. The corrected brain age gap of disease groups was compared with CU using one-way ANOVA with Holm-Sidak’s multiple comparisons test. *** p < 0.001. d, MRI-based brain age gap estimation for MCI and AD, respectively. e, Relationship between FDG- and MRI-based brain age gap. The black solid line and dotted lines in each figure represent a regression line and its 95% confidence bands, respectively. r indicates Pearson’s correlation coefficient.
Extended Data Fig. 5 ∣
Extended Data Fig. 5 ∣. Association of a brain age gap with cognitive scores.
(a-c) Scatter plots of FDG model-based brain age gap with Mini-Mental State Examinations (MMSE), Short Test of Mental Status (STMS) and Clinical Dementia Rating Sum of boxes (CDR-SB), respectively. (d-f) Scatter plots of MRI model-based brain age gap with MMSE, STMS and CDR-SB, respectively. r, Pearson correlation coefficient; p, correlation test p value.
Extended Data Fig. 6 ∣
Extended Data Fig. 6 ∣. Association of brain age gap with meta-ROI Amyloid- and Tau PET SUVr in ADNI cohort.
a, Scatter plots between FDG-based brain age gap with meta-ROI amyloid PET SUVr for MCI and AD, respectively. b, Scatter plots between FDG-based brain age gap with meta-ROI tau PET SUVr. c, Scatter plots between MRI-based brain age gap with meta-ROI PiB PET SUVr. d, Scatter plots between MRI-based brain age gap with meta-ROI Tau PET SUVr. The black solid line and dotted lines in each figure represent a regression line and its 95% confidence bands, respectively. r, Pearson correlation coefficient; p, correlation test p value.
Extended Data Fig. 7 ∣
Extended Data Fig. 7 ∣. Association of sex to the age gap estimation.
The blue-colored dot indicates female and red indicates male individuals. Comparisons were calculated by two-sided Student's t-test. Exact p values: for FDG, CU, t(2877) = 4.088, p = 4.5 × 10⁻⁵; MCI, t(664) = 0.3193, p = 0.7496; AD, t(370) = 2.625, p = 0.009; FTD, t(67) = 0.3496, p = 0.7277; DLB, t(139) = 0.7241, p = 0.4702; for MRI, CU, t(2877) = 3.290, p = 0.001; MCI, t(664) = 0.6509, p = 0.5154; AD, t(370) = 2.809, p = 0.0052; FTD, t(67) = 0.3811, p = 0.7043; DLB, t(139) = 2.886, p = 0.0045; * p < 0.05, **p < 0.005, *** p < 0.001.
Extended Data Fig. 8 ∣
Extended Data Fig. 8 ∣. InterScan interval bias test.
a, InterScan interval for total subjects. A statistical test was performed within the same baseline groups (one-way ANOVA with Holm-Sidak post hoc test). Exact p values: CU to CU versus CU to MCI/AD, p = 0.004; MCI to MCI versus MCI to AD, p = 0.79; MCI to MCI versus MCI to FTD, p = 0.95; MCI to MCI versus MCI to DLB, p = 0.95. n = 1054, 104, 169, 49, 6, and 11 for CU to CU, CU to MCI/AD, MCI to MCI, MCI to AD, MCI to FTD, and MCI to DLB group, respectively. b, InterScan interval after excluding participants with interscan interval of >2 years (one-way ANOVA with Holm-Sidak post hoc test). Exact p values: CU to CU versus CU to MCI/AD, p = 0.77; MCI to MCI versus MCI to AD, p = 0.29; MCI to MCI versus MCI to FTD, p = 0.77; MCI to MCI versus MCI to DLB, p = 0.77. n = 258, 52, 127, 41, 4, and 8 for CU to CU, CU to MCI/AD, MCI to MCI, MCI to AD, MCI to FTD, and MCI to DLB group, respectively. (c,d) Baseline brain age gap comparison between groups after excluding participants with interscan interval of >2 years for FDG and MRI, respectively. The comparison was performed within the same baseline groups (one-way ANOVA with Holm-Sidak post hoc test). For c panel, Exact p values: CU to CU versus CU to MCI/AD, p = 0.001; MCI to MCI versus MCI to AD, p = 0.07; MCI to MCI versus MCI to FTD, p = 3.2 × 10⁻⁵; MCI to MCI versus MCI to DLB, p = 0.38. For d panel, Exact p values: CU to CU versus CU to MCI/AD, p = 9.1 × 10⁻⁴; MCI to MCI versus MCI to AD, p = 0.02; MCI to MCI versus MCI to FTD, p = 0.12; MCI to MCI versus MCI to DLB, p = 0.94. * p < 0.05, **p < 0.005, *** p < 0.001. n = 258, 52, 127, 41, 4, and 8 for CU to CU, CU to MCI/AD, MCI to MCI, MCI to AD, MCI to FTD, and MCI to DLB group, respectively. Box plots represent the minimum and maximum values (whiskers), the first and third quartile (box boundaries), and the median (internal line).
Extended Data Fig. 9 ∣
Extended Data Fig. 9 ∣. Longitudinal nature of the brain age gap in ADNI cohort.
a, Baseline brain age gap comparison between groups for FDG model. A statistical test was performed within the same baseline groups using a two-sided two-sample Student's t-test. b, For FDG model, the annual Δ brain age gap of each group was compared with the CU to CU group using one-way ANOVA with Holm-Sidak post hoc. c, Baseline brain age gap comparison between groups for MRI model. A statistical test was performed within the same baseline groups using a two-sided two-sample Student's t-test. d, For MRI model, the annual Δ brain age gap of each group was compared with the CU to CU group using one-way ANOVA with Holm-Sidak post hoc test). * p < 0.05, **p < 0.005, *** p < 0.001. n = 124, 20, 237, 46, and 28 for CU to CU, CU to MCI/AD, MCI to MCI, MCI to AD, and AD to AD group, respectively. Box plots represent the minimum and maximum values (whiskers), the first and third quartile (box boundaries), and the median (internal line).
Extended Data Fig. 10 ∣
Extended Data Fig. 10 ∣. Voxel-wise linear regression analysis of brain age gap shown on coronal slices.
Clinical diagnosis group (MCI, AD, FTD and DLB)-specific results from voxel-wise whole-brain linear regression examining the brain age gap-related change (FDR corrected, q < 0.01). The chronological age was specified as nuisance covariance. For CU (bottom row), voxel-wise linear regression analysis was performed using the chronological age as a regressor to show the age-related change. A left panel shows the results for the FDG-based model and a right panel shows the results for the MRI-based model.
Fig. 1 ∣
Fig. 1 ∣. 3D-DenseNet architecture for age prediction and layout of occlusion analysis.
a, Detailed architecture of the 3D-DenseNet used for age prediction. b, Illustration of the framework for the occlusion analysis.
Fig. 2 ∣
Fig. 2 ∣. Brain age predictions on cognitively unimpaired participants.
ac, FDG-based brain age prediction result for the test set of the representative fold. a, Regression plot showing chronological age versus predicted brain age. b, Uncorrected brain age gap. c, Brain age gap after bias correction. df, MRI-based brain age prediction result for the test set of the representative fold. d, Regression plot showing chronological age versus predicted brain age. e, Uncorrected brain age gap. f, Brain age gap after bias correction. The black solid line and dotted lines in each figure represent a regression line and its 95% confidence bands, respectively.
Fig. 3 ∣
Fig. 3 ∣. Visualization of saliency maps shown on coronal slices.
Saliency maps were computed using occlusion sensitivity analysis for each age group. Higher saliency represents the importance of a region in brain age estimation. Left: Saliency maps for the FDG-based model. Right: saliency maps for the MRI-based model.
Fig. 4 ∣
Fig. 4 ∣. Regression plots of a corrected brain age gap as a function of chronological age for clinical diagnostic groups.
a, Violin plots of corrected brain age gap for each diagnostic group. The corrected brain age gap of disease groups was compared with cognitively unimpaired individuals using a one-way ANOVA with Holm-Šídák multiple comparisons test. Exact P values: cognitively unimpaired versus MCI, P = 1.5 × 10⁻⁹; cognitively unimpaired versus AD, P < 1 × 10⁻¹⁵; cognitively unimpaired versus FTD, P < 1 × 10⁻¹⁵; cognitively unimpaired versus DLB, P < 1 × 10⁻¹⁵; ***P < 0.001. b, FDG-based brain age gap estimation for MCI, AD, FTD and DLB, respectively. The black solid line and dotted lines in each figure represent a regression line and its 95% confidence bands, respectively. c, Violin plots of corrected brain age gap for each clinical diagnosis group. The corrected brain age gap of disease groups was compared with cognitively unimpaired individuals using a one-way ANOVA with Holm-Šídák multiple comparisons test. Exact P values: cognitively unimpaired versus MCI, P = 2.4 × 10⁻¹¹; cognitively unimpaired versus AD, P < 1 × 10⁻¹⁵; cognitively unimpaired versus FTD, P < 1 × 10⁻¹⁵; cognitively unimpaired versus DLB, P < 1 × 10⁻¹⁵; ***P < 0.001. d, MRI-based brain age gap estimation for MCI, AD, FTD and DLB, respectively. The black solid line and dotted lines in each figure represent a regression line and its 95% confidence bands, respectively. e, Relationship between FDG- and MRI-based brain age gap. The black solid line and dotted lines in each figure represent a regression line and its 95% confidence bands, respectively. r indicates Pearson’s correlation coefficient.
Fig. 5 ∣
Fig. 5 ∣. Association of brain age gap with meta-ROi PiB and Tau PET SUVR.
a, Scatter plots show the relationship between FDG-based brain age gap with meta-ROI PiB PET SUVR for MCI, AD, FTD and DLB, respectively. b, Scatter plots of FDG-based brain age gap versus meta-ROI tau PET SUVR. c, Scatter plots of MRI-based brain age gap versus meta-ROI PiB PET SUVR. d, Scatter plots of MRI-based brain age gap versus meta-ROI Tau PET SUVR. The black solid line and dotted lines in each figure represent a regression line and its 95% confidence bands, respectively. r, Pearson’s correlation coefficient; P, correlation test P value.
Fig. 6 ∣
Fig. 6 ∣. Longitudinal nature of the brain age gap.
The disease progression group seen in participants at the serial scans was defined with the second category representing the most recent diagnostic group assignment. a, Baseline brain age gap comparison for the FDG model. A statistical test was performed within the same baseline groups using a one-way ANOVA with Holm-Šídák post hoc test. Exact P values: cognitively unimpaired to cognitively unimpaired versus cognitively unimpaired to MCI/AD, P = 1.9 × 10⁻⁴; MCI to MCI versus MCI to AD, P = 0.07; MCI to MCI versus MCI to FTD, P = 2.6 × 10⁻⁵; MCI to MCI versus MCI to DLB, P = 0.78. b, For the FDG model, the annual Δ brain age gap of each group was compared with the cognitively unimpaired to cognitively unimpaired using a one-way ANOVA with Holm-Šídák post hoc test. Exact P values: cognitively unimpaired to MCI/AD, P = 0.54; MCI to MCI, P = 0.57; MCI to AD, P = 0.04; AD to AD, P < 1.0 × 10⁻¹⁵; MCI to FTD, P = 0.56; FTD to FTD, P = 3.5 × 10⁻⁴; MCI to DLB, P = 0.57; DLB to DLB, P = 0.57. c, Baseline brain age gap comparison for the MRI model. A statistical test was performed within the same baseline groups using a one-way ANOVA with Holm-Šídák post hoc test. Exact P values: cognitively unimpaired to cognitively unimpaired versus cognitively unimpaired to MCI/AD, P = 8.2 × 10⁻⁵; MCI to MCI versus MCI to AD, P = 0.005; MCI to MCI versus MCI to FTD, P = 0.11; MCI to MCI versus MCI to DLB, P = 0.87. d, For the MRI model, the annual Δ brain age gap of each group was compared with the cognitively unimpaired to cognitively unimpaired using a one-way ANOVA with Holm-Šídák post hoc test. Exact P values: cognitively unimpaired to MCI/AD, P = 0.99; MCI to MCI, P = 0.99; MCI to AD, P = 0.006; AD to AD, P < 3.5 × 10⁻⁷; MCI to FTD, P = 0.87; FTD to FTD, P = 0.87; MCI to DLB, P = 0.99; DLB to DLB, P = 0.87. n = 1,054, 104, 169, 49, 157, 6, 22, 11, 55 for cognitively unimpaired to cognitively unimpaired, cognitively unimpaired to MCI/AD, MCI to MCI, MCI to AD, AD to AD, MCI to FTD, FTD to FTD, MCI to DLB and DLB to DLB groups, respectively. The box plots represent the minimum and maximum values (whiskers), the first and third quartile (box boundaries) and the median (internal line). *P < 0.05, **P < 0.01, ***P < 0.001, ****P < 0.0001.
Fig. 7 ∣
Fig. 7 ∣. Voxel-wise linear regression analysis of the brain age gap.
a,b, Clinical diagnosis group-specific (MCI, AD, FTD and DLB) results from voxel-wise whole-brain linear regression examining brain age gap-related changes (FDR-corrected, q < 0.01) for FDG and MRI, respectively. Chronological age was specified as a nuisance covariance. c,d, For cognitively unimpaired individuals, voxel-wise linear regression analysis was performed using the chronological age as a regressor to show the age-related change for FDG (c) and MRI (d), respectively. e, Voxel-wise correlation of beta value between clinical diagnosis group (vertical axis) and cognitively unimpaired group (horizontal axis) for the FDG model. f, Comparisons of Pearson’s correlation coefficients from e. The error bars indicate 95% confidence intervals (CIs) of the Pearson’s correlation coefficient. Pearson’s r (95% CI) = 0.9391 (0.9386–0.9396), 0.827 (0.8257–0.8283), 0.654 (0.6517–0.6563) and 0.7095 (0.7114–0.7075) for MCI, AD, FTD and DLB, respectively. All exact P values are P < 1.0 × 10⁻¹⁵. ***P < 0.001, two-sided z-test after Fisher’s r-to-z transformation. g, Voxel-wise correlation of beta value between clinical diagnosis group (vertical axis) and cognitively unimpaired group (horizontal axis) for the MRI model. h, Comparisons of Pearson’s correlation coefficients from g. The error bars indicate the 95% CIs of the Pearson’s correlation coefficient. Pearson’s r (95% CI) = 0.8418 (0.8407–0.8430), 0.7064 (0.7043–0.7084), 0.5399 (0.5370–0.5427) and 0.5205 (0.5176–0.5235) for MCI, AD, FTD and DLB, respectively. All exact P values are P < 1.0 × 10⁻¹⁵. ***P < 0.001, two-sided z-test after Fisher’s r-to-z transformation.

References

    1. López-Otín C, Blasco MA, Partridge L, Serrano M & Kroemer G The hallmarks of aging. Cell 153, 1194–1217 (2013). - PMC - PubMed
    1. Harman D Aging: overview. Ann. N. Y. Acad. Sci 928, 1–21 (2001). - PubMed
    1. Courchesne E et al. Normal brain development and aging: quantitative analysis at in vivo MR imaging in healthy volunteers. Radiology 216, 672–682 (2000). - PubMed
    1. Good CD et al. A voxel-based morphometric study of ageing in 465 normal adult human brains. Neuroimage 14, 21–36 (2001). - PubMed
    1. Sowell ER et al. Mapping cortical change across the human life span. Nat. Neurosci 6, 309–315 (2003). - PubMed

Publication types