. 2022 Nov;2(11):1054-1069.
doi: 10.1038/s43587-022-00306-9. Epub 2022 Nov 17.

Toward an improved definition of a healthy microbiome for healthy aging

Affiliations

Toward an improved definition of a healthy microbiome for healthy aging

Tarini Shankar Ghosh et al. Nat Aging. 2022 Nov.

Abstract

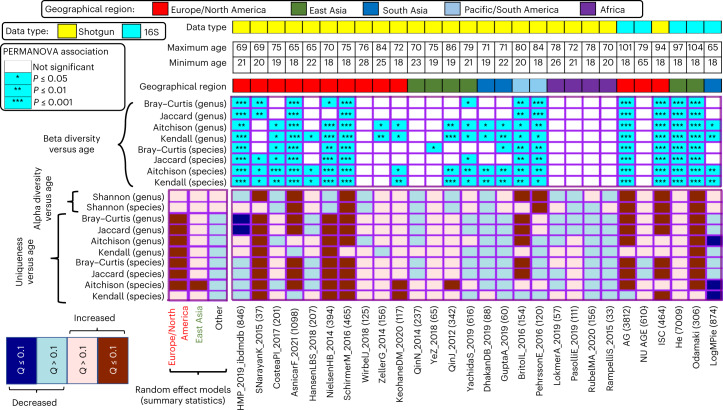
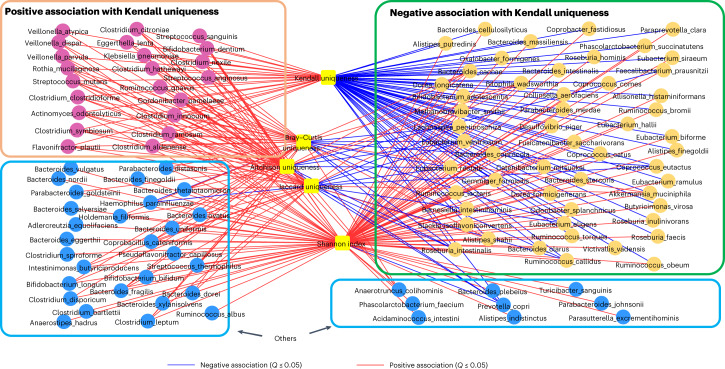
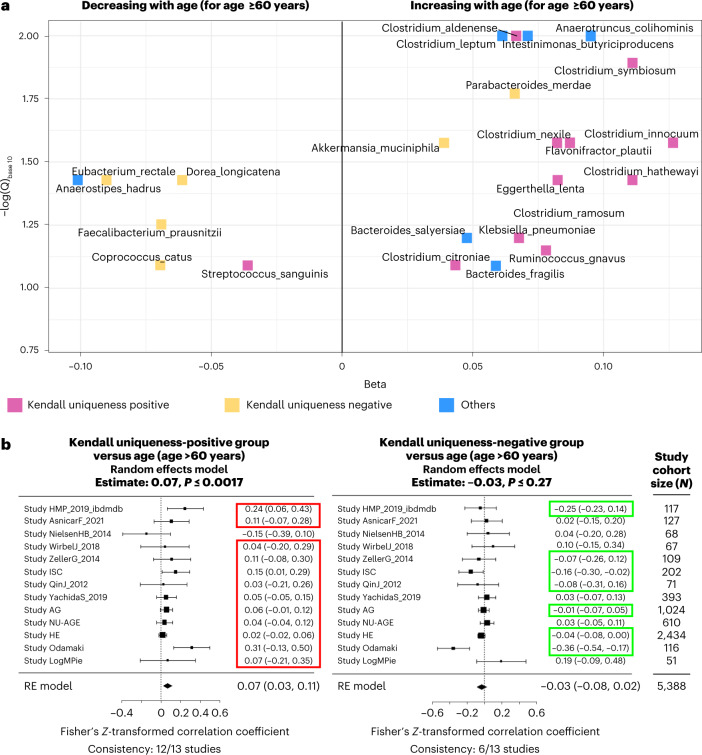
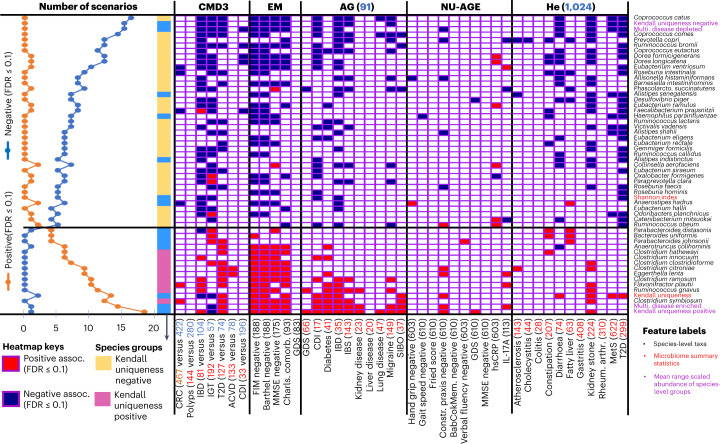
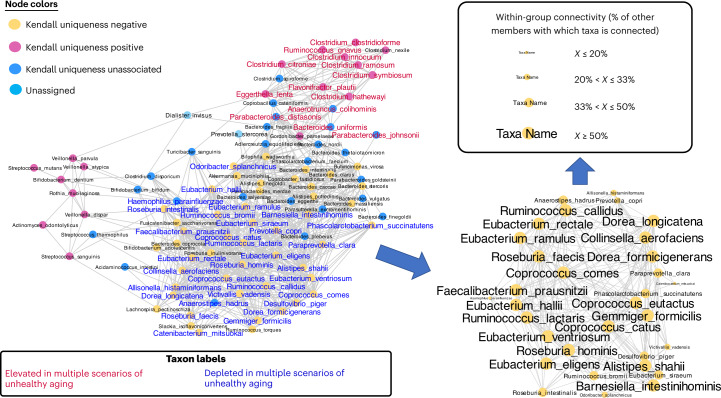
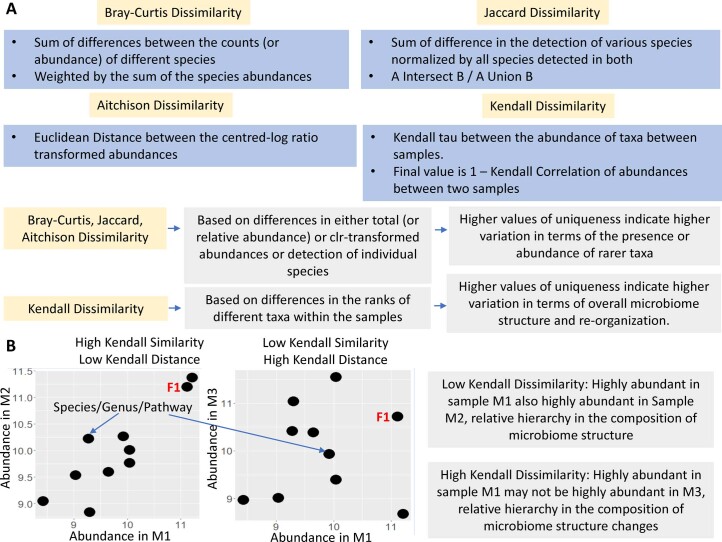
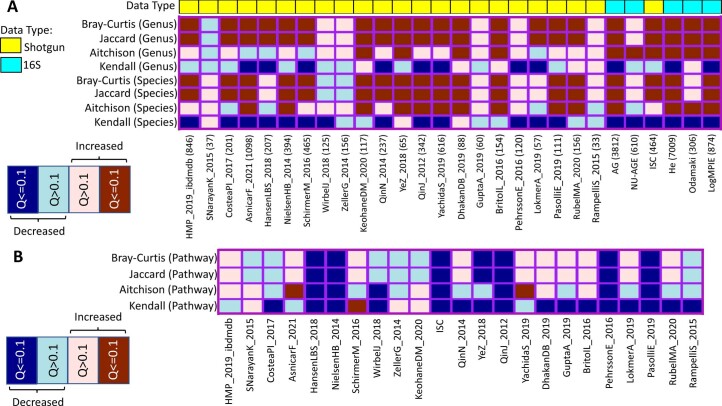
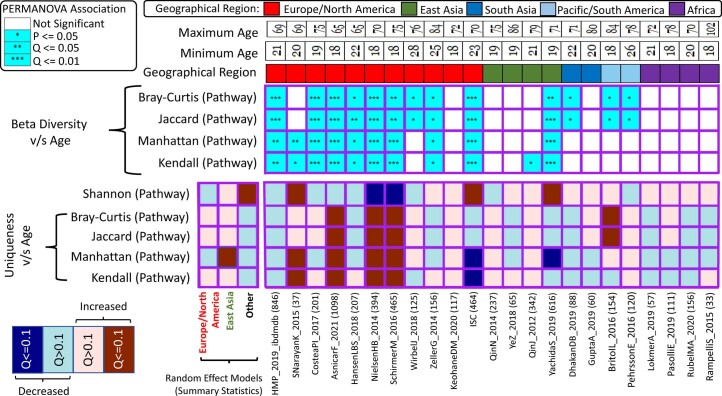
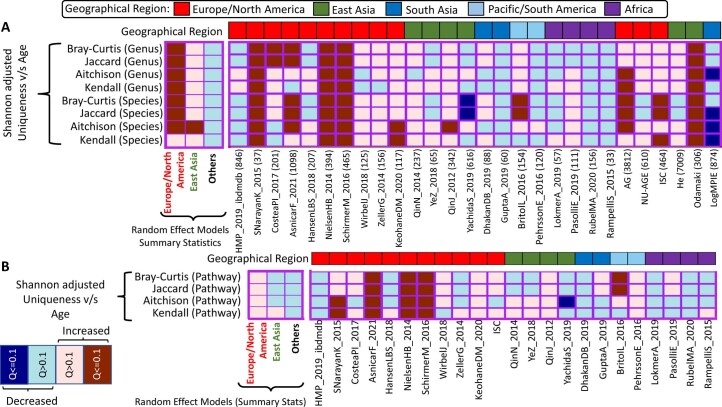
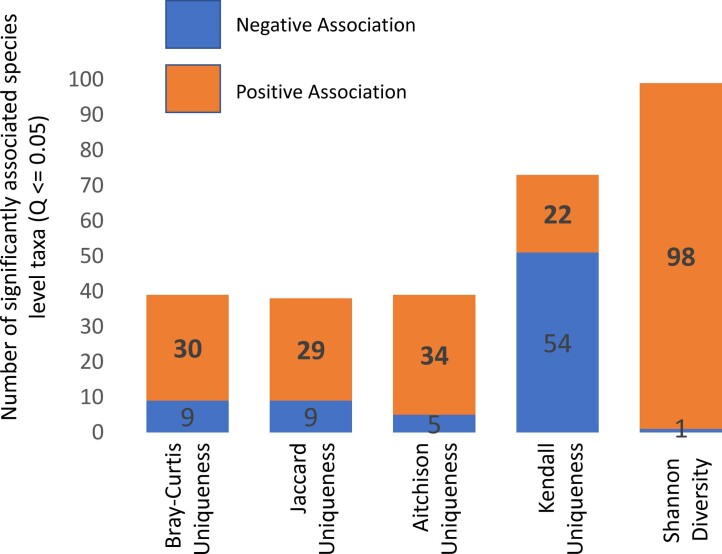
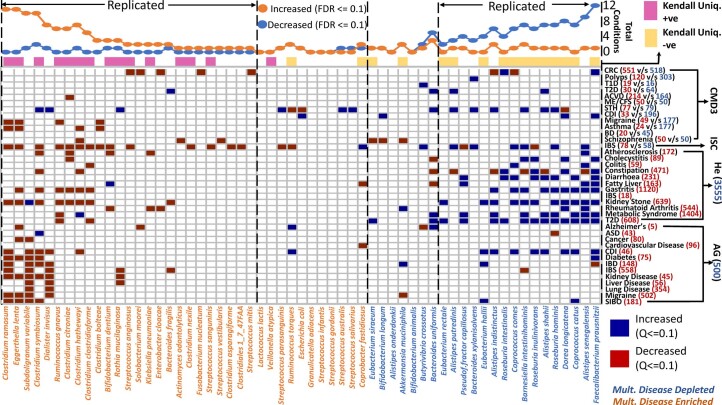
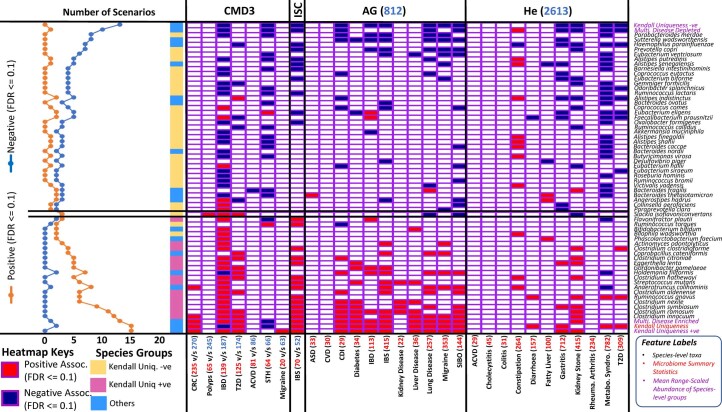
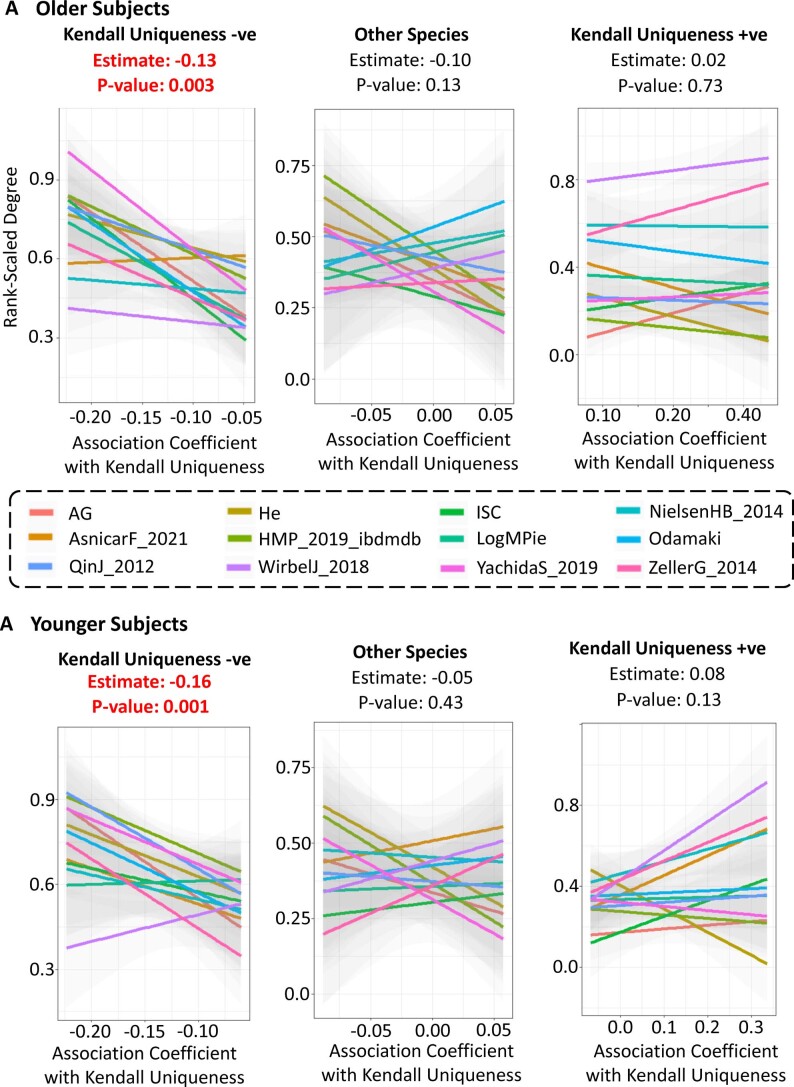
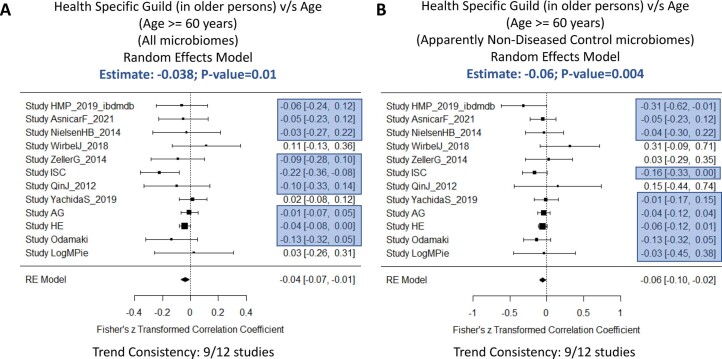
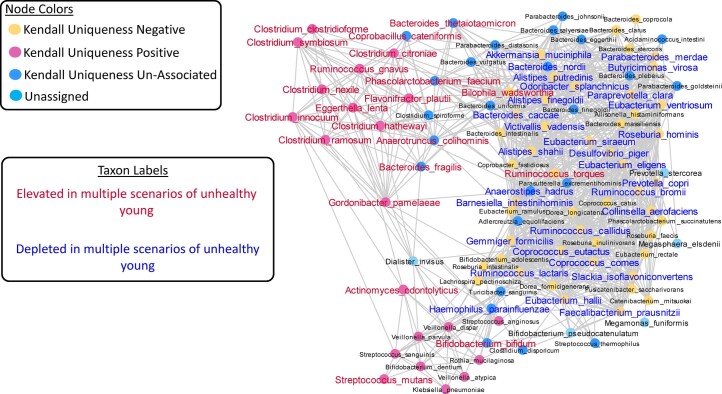
The gut microbiome is a modifier of disease risk because it interacts with nutrition, metabolism, immunity and infection. Aging-related health loss has been correlated with transition to different microbiome states. Microbiome summary indices including alpha diversity are apparently useful to describe these states but belie taxonomic differences that determine biological importance. We analyzed 21,000 fecal microbiomes from seven data repositories, across five continents spanning participant ages 18-107 years, revealing that microbiome diversity and uniqueness correlate with aging, but not healthy aging. Among summary statistics tested, only Kendall uniqueness accurately reflects loss of the core microbiome and the abundance and ranking of disease-associated and health-associated taxa. Increased abundance of these disease-associated taxa and depletion of a coabundant subset of health-associated taxa are a generic feature of aging. These alterations are stronger correlates of unhealthy aging than most microbiome summary statistics and thus help identify better targets for therapeutic modulation of the microbiome.


Conflict of interest statement

P.W.O.T. and T.S.G. are co-authors of a patent describing specific isolated bacterial strains and use of the composition for treating frailty and/or inflammation related to aging in older adults (applicant: University College Cork; inventors: O’Toole, Paul; Jeffery, Ian; Ghosh, Tarini S.; Tan, Huizi; Perez, Marta; Ntemiri, Alexandra; WO/2021/074431; pending). Seven of the taxa identified as being health-related in the current study are covered by the patent. F.S. has had a scientific advisory role to Kaleido Biosciences and Norgine. Those facts have had no bearing or constraint on the present paper.

Figures

Fig. 1
Fig. 1. Association of measures of microbiome uniqueness, Shannon diversity and beta diversity with age in different study cohorts shows region-specific variabilities.
The names of the study cohorts appear as listed in Table 1, and the number of investigated gut microbiomes are indicated in parentheses. The top four rows indicate the data type (Shotgun or 16S; as per legend), maximum and minimum participant age and the geographical region. The heatmap immediately below these panels shows the results of PERMANOVA for associating overall beta diversity with age computed using the four microbiome distance matrices analyzed at the levels of genus and species. The bottom heatmap shows the results of the robust linear regression models for associating species and genus-level microbiome summary statistics with age across the different individual studies. The statistical significance of the associations were computed using two-sided robust F-tests. The P values obtained for the association of the different microbiome summary indices were corrected on a per-study cohort basis using Benjamini–Hochberg correction to compute the Q-values. Also indicated on the right of this heatmap are the results of the association meta-analyses of these microbiome summary statistics with age for studies grouped based on their geographical regions. For a given geographical region, the summarized associations are computed using random effect models on the specific individual study-specific effect sizes (computed based on robust linear regression models (Methods)). As for the previous heatmap, the P values obtained for the association of each summary index were corrected on for each geography-specific study groups using Benjamini–Hochberg corrections. The results show that age-wise association of the gut microbiome with age (association of individual summary statistics as well as overall diversity) shows region-specific signatures, with the strongest effects being observed for the European and North American cohorts. Various measures of uniqueness and diversity strongly associate with age, but only for the European and North American cohorts. Source data
Fig. 2
Fig. 2. Identification of species-level groups based on their pattern of association with different microbiome summary statistics.
Species fall into three groups based on their association pattern with Kendall uniqueness. Each edge indicates an association with Q ≤ 0.05, with colors blue and red indicating significant negative and positive associations, respectively. Based on their pattern of association, the microbiome taxa can be resolved into three partitions based on their association with Kendall uniqueness. A set of 54 species-level taxa containing many of the putatively beneficial symbionts show significantly negative association with Kendall uniqueness. A group of 22 species-level taxa containing many taxa previously shown to be associated positively with multiple diseases/unhealthy measures, like frailty, associate positively with Kendall uniqueness. The disease/unhealthy aging links of the above two groups are further validated in Figs. 3 and 5. A third group of 36 taxa (highlighted as ’Others’) show no association with Kendall uniqueness. Source data
Fig. 3
Fig. 3. Increase with age in older adults of the disease-associated species that correlate positively with Kendall uniqueness.
a, Volcano plot showing the association of the clr-transformed abundances of species in the two major species groups (identified in Fig. 2) with increasing age in the microbiomes of older adults (age ≥60 years). The x axis shows the summarized estimate of the random effects model-based association meta-analysis for each species determined across the 13 selected studies (Results), along with the study cohort size (the number of independent samples/gut metagenomes from each study). The y axis shows the −log(Q)base 10, where the Q-value is obtained by correcting the overall P values obtained for the same meta-analyses across all species using the Benjamini–Hochberg correction. Taxa belonging to the three taxon groups identified in Fig. 2 are shown in different colors (pink, Kendall uniqueness positive; yellow, Kendall uniqueness negative; blue, others). Only taxa showing associations with Q ≤ 0.1 are indicated. Taxa showing significant (Q ≤ 0.1) positive associations with age tend to be dominated by those belonging to the Kendall uniqueness-positive group. b,c, Overall increase of disease-associated group of taxa with increasing age >60 years; forest plots show the results of separate random effects (RE) model-based meta-analyses performed the group abundances of the Kendall uniqueness-positive and Kendall uniqueness-negative groups with age (>60 years) (Methods). The highlighted study cohorts (highlighted in green for health-associated Kendall uniqueness-negative group and in red for disease-associated Kendall uniqueness-positive group) are those where the association pattern was similar to the overall pattern. For each plot, the effect size of the associations with age is depicted as a line, with the mean effect size shown as black squares (the size proportional to the weight or power for each study), and the lines indicate the confidence interval of this estimate. The summarized effect size is indicated at the bottom in the shape of a rhomboid, with the outer edges indicating its confidence interval. The two-sided P values of the permutation tests of each random effects model is also indicated above each plot. Source data
Fig. 4
Fig. 4. Ranked order of microbiome features that show the most consistent associations with multiple measures of unhealthy aging.
The results are shown for 43 measures of unhealthy aging phenotype in five data repositories. Disease groups containing information from less than 20 gut microbiomes were not included in this analysis. Only those features that associate consistently with multiple measures of unhealthy phenotype individually in at least three of the five data repositories and at the maximum of only two association in the opposite direction are shown. The associations are shown for individual species, mean range-scaled abundances of the Kendall uniqueness-positive and negative groups (Fig. 2) and that of the multiple-disease-enriched and multiple-disease-depleted taxon groups identified in Ghosh et al. 1, along with multiple microbiome summary statistics used here (Methods). Q-values were obtained using Benjamini–Hochberg correction for each data repository-unhealthy measure combination. Features are arranged such that those showing the most negative associations with unhealthy older adult-specific scenario (at least with Q ≤ 0.1) are at the top, with a gradual shift to putatively detrimental features showing the most positive associations with negative health (at least with Q ≤ 0.1). The two groups differentially associating with unhealthy aging phenotypes are demarcated with horizontal lines. For each association, we have also indicated the number of gut microbiomes investigated. For CMD3 and ISC, containing samples from multiple studies, we used the matched patient-control studies pertaining to each disease (number of controls in blue font and patients in red font). For single AG and He cohorts, we compared taxon abundances in patients versus controls from the same data repository (size of each disease group indicated in red and the number of controls in blue besides the repository names). For EM and NU-AGE, all microbiomes were considered (number in parentheses), and associations were performed along a continuous gradient (Methods). Abbreviations: FIM, functional independence measure; Barthel, Barthel score; MMSE, Mini Mental State Examination; Charls. comorb., Charlson comorbidity; GDS, geriatric depression scale; hand grip, hand grip strength; Constr. praxis, sensitivity C-reactive protein; MetS, metabolic syndrome; Rheum. arthr., rheumatoid arthritis (Table 1 lists additional abbreviations). Source data
Fig. 5
Fig. 5. Identification of a coabundant hub of putatively beneficial symbionts that are depleted in unhealthy aging.
Coabundance network of taxa derived from microbiomes of adults older than 60 years, across 13 individual studies. We selected a set of 112 species that were identified in both 16S and Shotgun datasets. Associations between the centered-log-ratio transformed abundances of species pair were individually computed within each study using robust linear regression models. Results of the individual robust linear regression models were then collated using random effect models to compute summarized association statistics. For each species, the summarized association P values for every other were then corrected using the stringent Bonferroni approach and only those species pairs having a Q ≤ 0.001 and an overall summarized positive association estimate (>0) were determined to have coabundant relationships and connected by an edge. The species-level nodes belonging to the different species groups are filled in different colors, namely, green for the health-associated group, red for the disease-associated group and light blue for other species. Species-level taxa that are observed to be either elevated or depleted in multiple scenarios of unhealthy aging are shown in brown and dark blue, respectively. We also investigated the interactions for the taxa depleted in multiple scenarios of unhealthy aging (Fig. 5) individually within the 11 studies (Results). This species-to-species coabundance subnetwork of health-associated markers is shown in the bottom right corner. The sizes of the labels are based on the number of connections each taxon has with the others in this subnetwork. Source data
Extended Data Fig. 1
Extended Data Fig. 1. Different uniqueness measures and their implications.
A. Summary description of the inter-microbiome distance calculation using the four different distance metrics and the aspects of gut microbiome variation captured by the different distance matrices. B. Pictorial illustration of the meaning of high or low Kendall similarity measures using three different hypothetical microbiomes (M1, M2 and M3). While Microbiomes M1 and M2 have a high Kendall Similarity, M1 and M3 do not. The two sub-plots pictorially elaborate this. Each point in the two sub-plots represents a feature which may be either the abundance of a species or genus or pathway. In the left sub-plot, the y-value of each represents the abundance of the corresponding features in M2 and the x-value represents the abundance of the same feature in M1. In the right sub-plot, the y-value of each point represents the abundance of the corresponding features in M3 and the x-value represents the abundance of the same feature in M1. As observed, in the left sub-plot of higher Kendall similarity (and low Kendall distance), highly abundant features in M1 (for example the feature F1 highlighted in red) are also highly abundant in M2. Thus, the ranking of the features in terms of their abundance in M1 and M2 are similar. This is not observed between M1 and M3 which have lower Kendall similarity and higher Kendall distance.
Extended Data Fig. 2
Extended Data Fig. 2. Links between diversity and uniqueness.
Heatmaps showing the association patterns between Shannon Diversity and the four measures of uniqueness at the level of: A. Species and Genus and B. Pathways. Each cell indicates the directionality and the strength between diversity and specific measure of uniqueness (given by the row) in a specific study (given by the column). The strengths are indicated in the legend key on the left. The number of gut microbiomes investigated in each study cohort is shown in parentheses for the corresponding studies for the top heatmap. The statistical significance of the associations were computed using two-sided robust F-tests. The p-values obtained for the association of the different microbiome summary indices were corrected on a per-study cohort basis using Benjamini–Hochberg correction to compute the Q-values. Source data
Extended Data Fig. 3
Extended Data Fig. 3. Association of different measures of Uniqueness, Shannon diversity and beta diversity with age in different study cohorts at the functional pathway-level using the MetaCyc scheme.
The names of the study cohorts (with the number of investigated gut microbiomes indicated in parentheses) are indicated. The top three rows indicate the maximum participant age, the minimum participant age and the geographical region of the study cohorts (indicated in different colors as provided in the legends). The heatmap immediately below these panels shows the results of PERMANOVA for associating overall pathway-level beta-diversity with age computed using the four different microbiome distance matrices (utilized in the current study). The bottom heatmap shows the results of the robust linear regression models for associating various pathway-level microbiome summary statistics with age across the different individual studies. The statistical significance of the associations were computed using two-sided robust F-tests, corrected on a per-study cohort basis using Benjamini–Hochberg corrections to obtain Q-values. Also indicated on the right of this heatmap are the results of the association meta-analyses of these microbiome summary statistics with age for studies grouped based on their geographical regions. For a given geographical region, the summarized associations are computed using Random Effect Models on the specific individual study-specific effect sizes (computed based on robust linear regression models (See Methods). Here, the p-values were computed using two-sided permutation tests corrected per-geography-specific-cohort groups using Benjamini–Hochberg corrections to obtain Q-values. Source data
Extended Data Fig. 4
Extended Data Fig. 4. Association between Shannon-adjusted uniqueness with age.
Heatmaps showing the association between Shannon-adjusted measures of uniqueness and age across A) the 28 studies (with taxonomic profile) and B) the 23 studies with pathway profiles, obtained using Study-Specific Robust Linear Regression models. The geographic origin of each study is also indicated. Also indicated are the results of the summarized associations obtained by performing Random Effect Models analysis of these individual study associations by grouping cohorts into different geographical bins. The number of gut microbiomes investigated in each study cohort is shown in parentheses for the corresponding studies for the top heatmap. Source data
Extended Data Fig. 5
Extended Data Fig. 5. Overall directionalities of association between different summary indices and microbiome taxa.
Stacked bar plots showing the number of species-level taxa that show either significantly positive or significantly negative associations with each microbiome summary statistics in the Random Effect Models based meta-analysis across all the 28 studies. 107 species-level taxa that we detected in at least 5% of the microbiomes, in at least 60% of the studies in both Shotgun and 16S groups of datasets. Source data
Extended Data Fig. 6
Extended Data Fig. 6. Identification of taxa enriched or depleted in multiple diseases in 12,000 gut microbiomes.
Disease associations (where disease metadata were available) were tested based upon whether or not these taxa replicated the multiple-disease-enriched and the multiple-disease-depleted taxa previously identified in Ghosh et al. which was based on 2,500 microbiome profiles that were not included in the current analysis. The results of the association analysis are shown in a single heatmap for both Shotgun (CMD3 and ISC) 16S-based (AG and He) datasets. For AG and He (where control and patient gut microbiomes were sequenced as part of a single study), we compared taxon abundances in patients (numbers of metagenomes in red; right panel) versus controls (numbers in blue besides repository names) from the same data repository using two-sided Mann–Whitney tests. For CMD3 and ISC, we used matched patient-control studies pertaining to each disease. The number of patient and control gut microbiomes being compared are indicated in the right panel in parenthesis corresponding to each disease (in red and blue font, respectively). All comparisons were done using Mann–Whitney tests, with P-values of taxa associations corrected for each dataset-disease-scenario using Benjamini–Hochberg correction to obtain Q-values. We first determined proportions of each species group that were validated in these additional gut microbiome profiles across both Shotgun and 16S datasets and then investigated the group-wise affiliations of species that associated negatively (green) and positively (red) with Kendall Uniqueness (Fig. 2). The associations of ~ 70% of the multiple disease-enriched and disease-depleted (as identified in Ghosh et al. were reproduced with the expected directionalities, with the former group overlapping significantly with the Kendall Uniq. +ve group and the latter with the Kendall Uniq. -ve (Supplementary Text S1). Please Table 1 Foot Note for disease abbreviations. Source data
Extended Data Fig. 7
Extended Data Fig. 7. Identification of a ranked order of microbiome features that show the most consistent associations with multiple measures of unhealthy phenotype in younger people (age < 60 years).
The results are shown for 30 measures of unhealthy phenotype in the younger participants (age < 60 y) from four data repositories. Disease groups containing information from less than 20 gut microbiomes were not included in this analysis. Only those features that associate consistently with multiple measures of unhealthy phenotype individually in at least two of the four data repositories and at the total maximum of only two association in the opposite direction are shown. The associations are shown for individual species, mean range-scaled abundances of the disease-associated and the health-associated groups identified in this study, the combined abundances of the multiple-disease-enriched and multiple-disease-depleted taxa groups previously identified in Ghosh et al., along with the different multiple microbiome summary statistics. P-values were FDR-corrected for each data repository-unhealthy measure combination to obtain the Q-values. Features are arranged such that those that show the most positive associations with negative health (at least with a Q < = 0.10) are shown at the top with a gradual shift to putatively beneficial features showing the most negative associations with negative health (at least with a Q < = 0.1). The number of gut microbiomes being compared for the association investigation in each scenario are indicated. The convention adopted is as described in the legend of Fig. 5. Abbreviations for clinical measures/disease phenotypes: CRC: Colorectal Cancer, IBD: Inflammatory Bowel Disease, IGT: Impaired Glucose Tolerance, T2D: Type II Diabetes, ACVD: Atherosclerotic Cardiovascular Disease, CDI: Clostridioides difficile infection, STH: Soil Transmitted Helminths, ASD: Autism Spectrum Disorder, CVD: Cardiovascular Disease, SIBO: Small Intestional Bacterial Overgrowth; Metabo. Syndro.: Metabolic Syndrome, Rheuma. Arthritis: Rheumatoid Arthritis. Source data
Extended Data Fig. 8
Extended Data Fig. 8. Relationship between degree centrality and the strength of the association with Kendall Uniqueness for the different species-level taxon groups.
Least-square regression lines linking degree centrality measures of the different taxa and their extent of association (association coefficient) with Kendall Uniqueness. Regression-lines are shown separately for taxa belonging to each of the three different species-level-groups. For each species-group, distinct regression lines are shown separately for the co-occurrence networks obtained for each study. Panel A shows these relationships only in the study-specific co-occurrence networks derived for the gut microbiomes from older participants (participant age > = 60 years); Panel B shows the same for networks derived for younger gut microbiomes (participant age < 60 years). For both the plots, bold lines indicate the mean regression line for each of the associations, the shaded regions (in gray) corresponding to each line indicate their confidence intervals (+/- standard errors). The p-values indicated above each plot are obtained using Random Effect Models (utilizing two-sided permutation tests). Source data
Extended Data Fig. 9
Extended Data Fig. 9. Single consensus coabundance network of taxa combining all the microbiomes from younger participants with age < 60 years from the 12 individual studies.
We selected a set of 112 species that are commonly identified in both 16S and Shotgun datasets. Associations between the centered-log-ratio transformed abundances of species pair were individually computed within each study using robust linear regression models. Results of the individual robust linear regression models were then collated using Random Effect models to compute summarized association statistics. For each species, the summarized association p-values for every other were then FDR-corrected and those species having a stringent threshold of Q < = 0.001 and an overall summarized association estimate of greater than 0 were determined to have co-abundant relationship with it. The species-level nodes belonging to the different species groups are filled in different colors, namely green for Kendall Uniqueness negative, red for Kendall Uniqueness positive and light blue for other species. Species-level taxa that were either elevated or depleted in multiple scenarios of unhealthy young are shown in deep pink and dark blue, respectively. Source data
Extended Data Fig. 10
Extended Data Fig. 10. Variation of the healthy aging associated taxonomic guild with age in older people (age > = 60 years).
Forest plots showing the results of the Random Effects Models investigating the variation of the mean ranked abundance of health-associated taxonomic guild of 12 species (in older persons) across age in the cohorts considering: A) All the microbiomes B) Only the microbiomes from apparently healthy nondiseased controls. For each forest plot, the effect size of the associations of different taxon groups with age is depicted as a line with the mean effect size shown as black squares (the size of the squares proportional to the weight or power for each study) and the length and the end-points of the line indicate the confidence intervals of this estimate. The summarized effect size is indicated at the bottom in the shape of a rhomboid, the outer edges of which indicates its confidence interval. The number of samples (or gut microbiome) (n) corresponding to the different studies are: AG:1023, AsnicarF_2021:127, HE:2434, HMP_2019_ibdmdb:117, ISC:202, LogMPie:51, NielsenHB_2014:68, NU-AGE:610, Odamaki:116, QinJ_2012:71, WirbelJ_2018:67, YachidaS_2019:393, ZellerG_2014:109. Two-sided P-values for the Random Effect Model were computed using permutation tests of association for the summary effect sizes. Source data

Similar articles

Cited by

References

    1. Ghosh TS, et al. Adjusting for age improves identification of gut microbiome alterations in multiple diseases. eLife. 2020;9:e50240. doi: 10.7554/eLife.50240. - DOI - PMC - PubMed
    1. Pellanda P, Ghosh TS, O’Toole PW. Understanding the impact of age-related changes in the gut microbiome on chronic diseases and the prospect of elderly-specific dietary interventions. Curr. Opin. Biotechnol. 2020;70:48–55. doi: 10.1016/j.copbio.2020.11.001. - DOI - PubMed
    1. Claesson MJ, et al. Gut microbiota composition correlates with diet and health in the elderly. Nature. 2012;488:178–184. doi: 10.1038/nature11319. - DOI - PubMed
    1. Jeffery IB, Lynch DB, O’Toole PW. Composition and temporal stability of the gut microbiota in older persons. ISME J. 2016;10:170–182. doi: 10.1038/ismej.2015.88. - DOI - PMC - PubMed
    1. O'Toole PW, Jeffery IB. Gut microbiota and aging. Science. 2015;350:1214–1215. doi: 10.1126/science.aac8469. - DOI - PubMed

Publication types