. 2023 Feb;3(2):213-228.
doi: 10.1038/s43587-022-00352-3. Epub 2023 Feb 2.

Systemic GDF11 attenuates depression-like phenotype in aged mice via stimulation of neuronal autophagy

Affiliations

Systemic GDF11 attenuates depression-like phenotype in aged mice via stimulation of neuronal autophagy

Carine Moigneu et al. Nat Aging. 2023 Feb.

Erratum in

Abstract

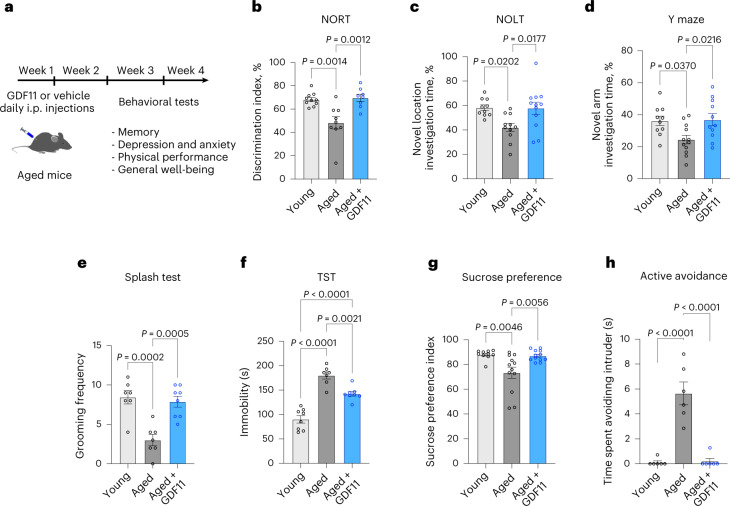
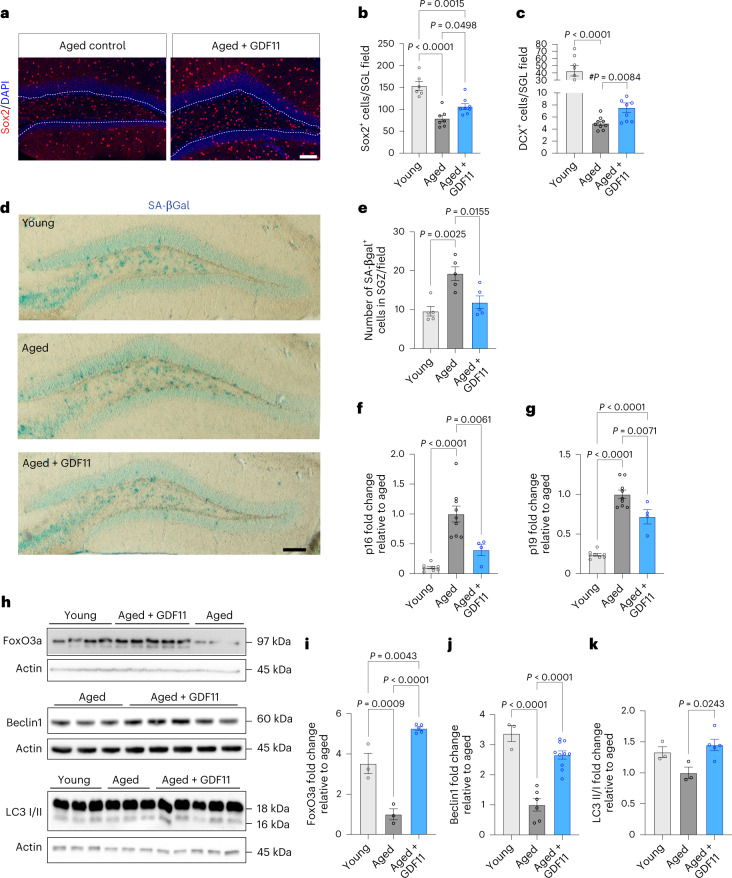
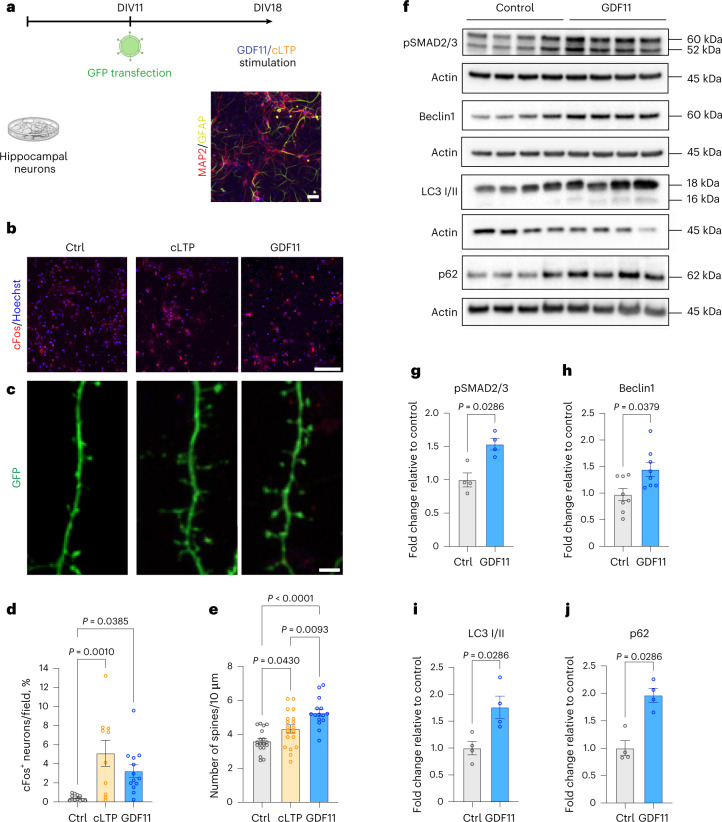
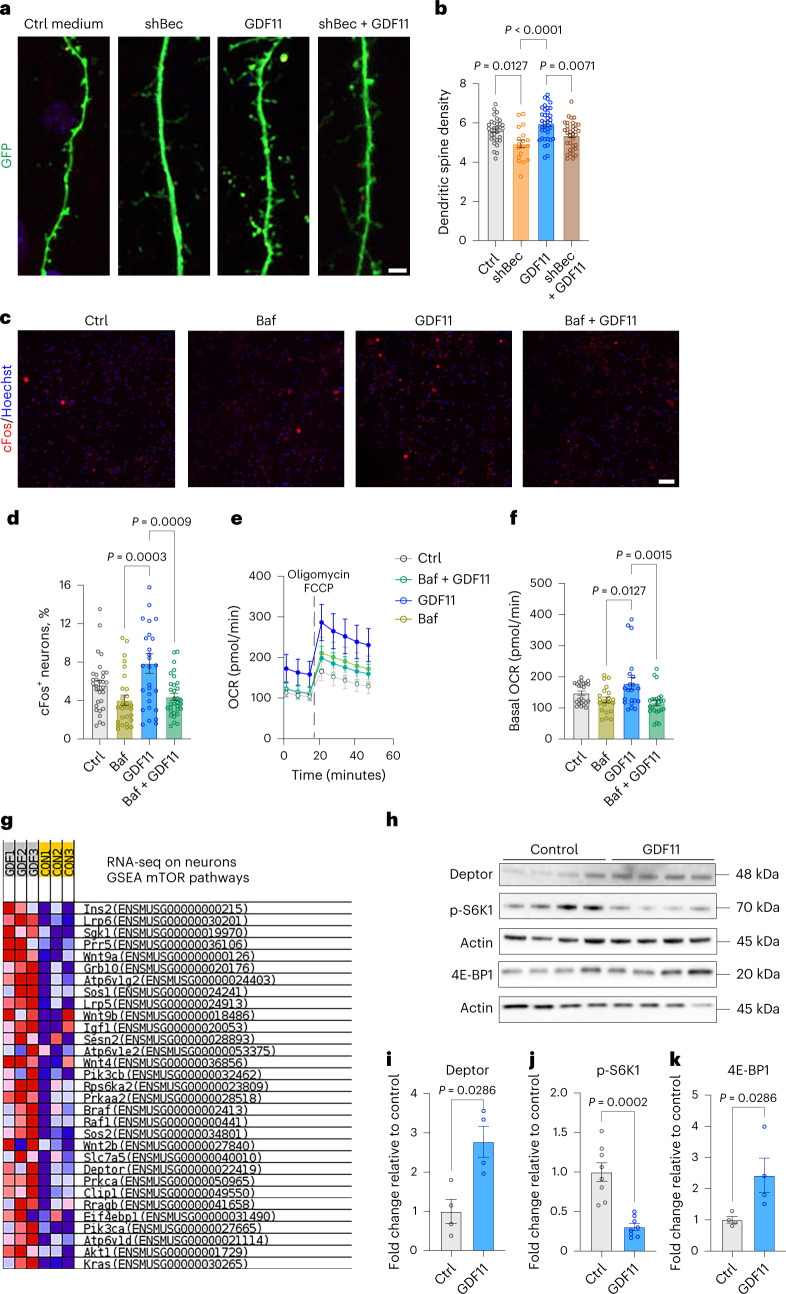
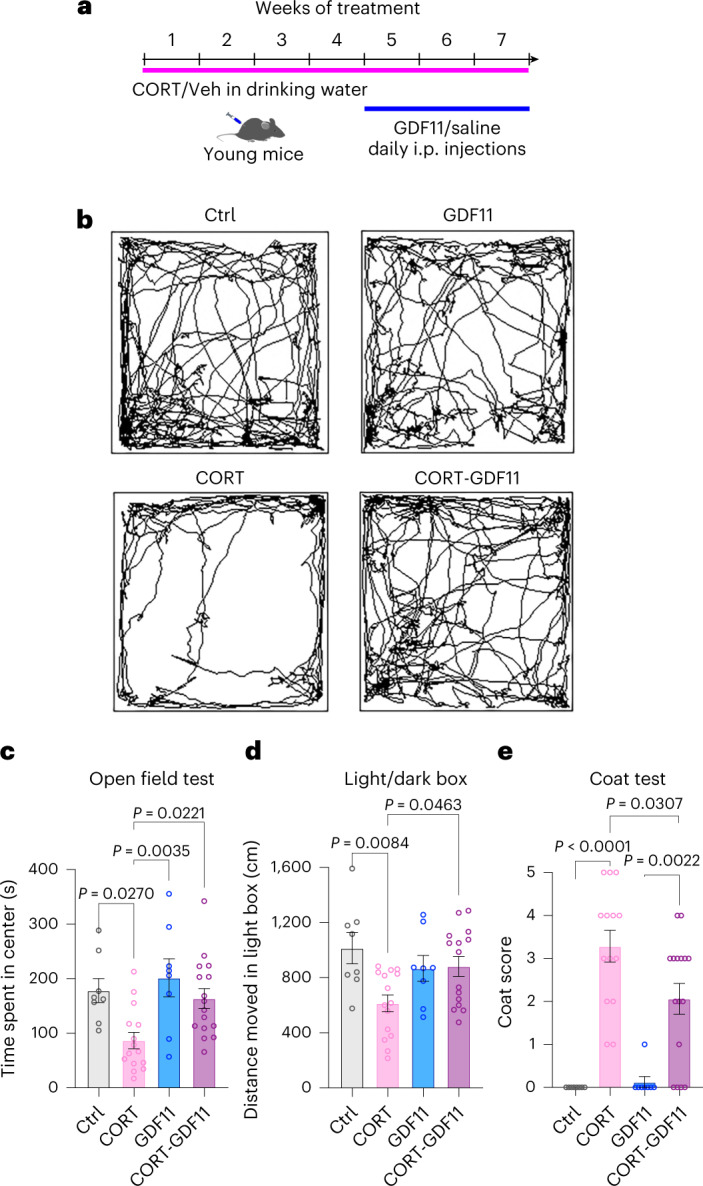
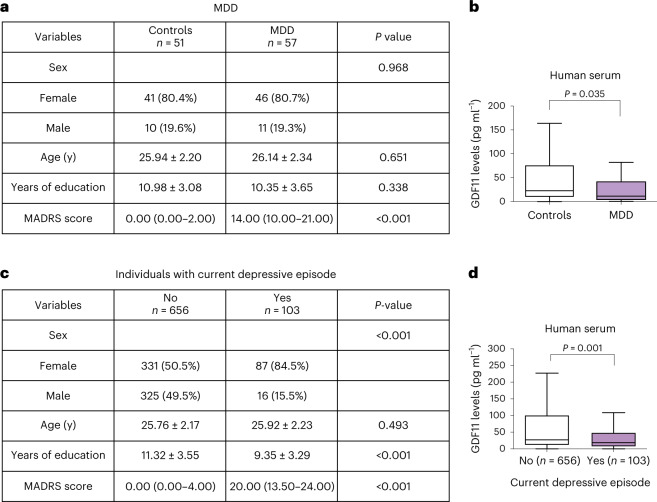
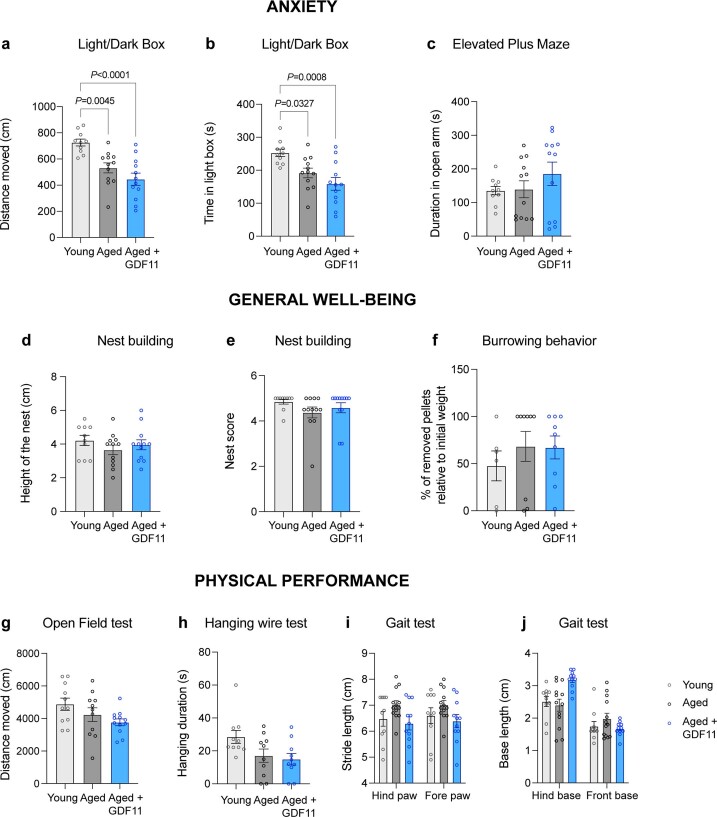
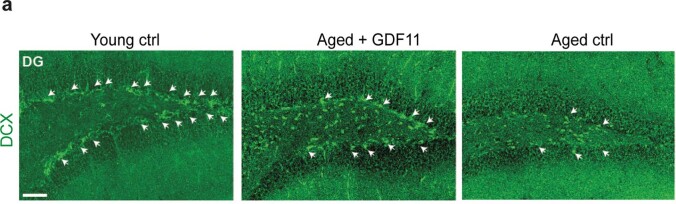
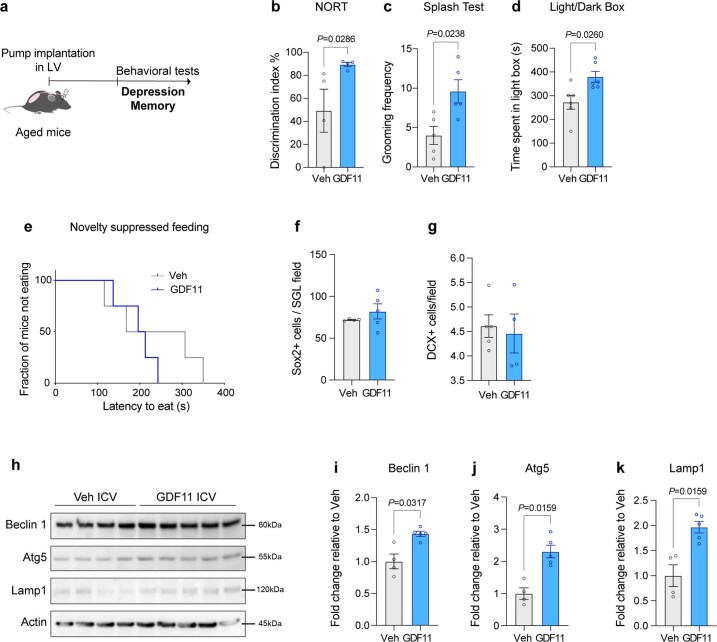
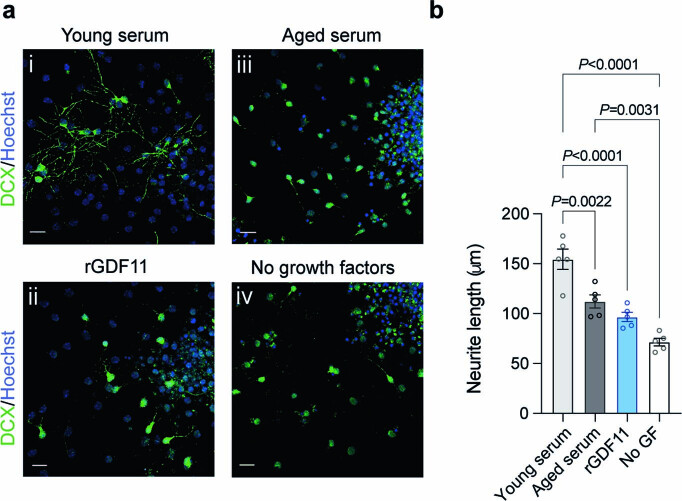
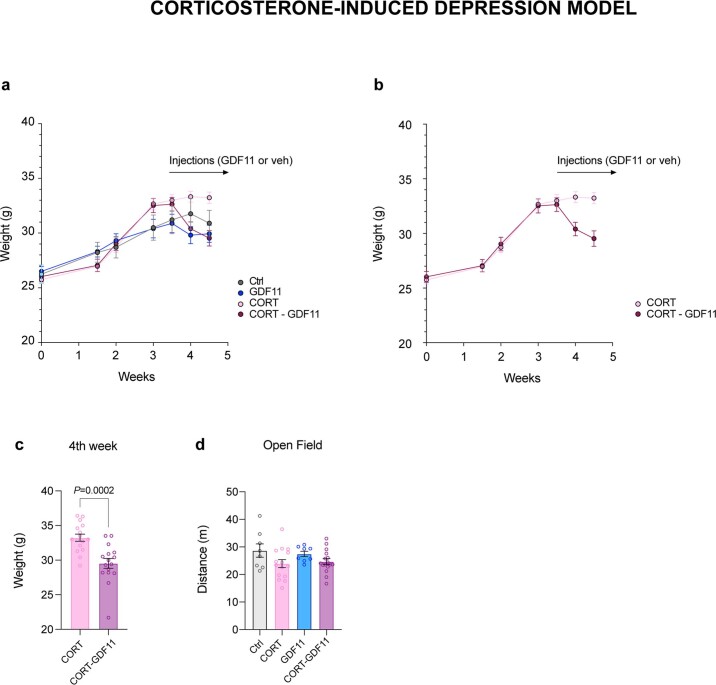
Cognitive decline and mood disorders increase in frequency with age. Many efforts are focused on the identification of molecules and pathways to treat these conditions. Here, we demonstrate that systemic administration of growth differentiation factor 11 (GDF11) in aged mice improves memory and alleviates senescence and depression-like symptoms in a neurogenesis-independent manner. Mechanistically, GDF11 acts directly on hippocampal neurons to enhance neuronal activity via stimulation of autophagy. Transcriptomic and biochemical analyses of these neurons reveal that GDF11 reduces the activity of mammalian target of rapamycin (mTOR), a master regulator of autophagy. Using a murine model of corticosterone-induced depression-like phenotype, we also show that GDF11 attenuates the depressive-like behavior of young mice. Analysis of sera from young adults with major depressive disorder (MDD) reveals reduced GDF11 levels. These findings identify mechanistic pathways related to GDF11 action in the brain and uncover an unknown role for GDF11 as an antidepressant candidate and biomarker.


Conflict of interest statement

The authors declare no competing interests.

Figures

Fig. 1
Fig. 1. Systemic GDF11 administration restores memory decline and depression-like phenotype in aged mice.
a, Schematic representation of the experimental procedure. b, Measurement of discrimination index during the NORT (percentage of time spent to observe the novel object divided by the total investigation time for both objects) (nYoung = 10 mice, nAged = 9 mice, nAged+GDF11 = 8 mice; F (2, 24) = 10.9). c, Measurement of percent investigation time of the novel location during the novel object location test (NOLT) (percentage of time spent to observe the novel location of the object divided by the total investigation time for both objects) (nYoung = 10 mice, nAged = 11 mice, nAged+GDF11 = 12 mice; F (2, 30) = 5.5). d, Measurement of percent investigation time of the novel arm during the Y-maze test (percentage of time spent to observe the novel arm divided by the total investigation time for both arms) (nYoung = 10 mice, nAged = 12 mice, nAged+GDF11 = 11 mice; F (2, 30) = 5). e, Measurement of grooming frequency during the Splash test (nYoung = 7 mice, nAged = 7 mice, nAged+GDF11 = 8 mice; F (2, 19) = 15.3). f, Measurement of immobility time during the TST (nYoung = 8 mice, nAged = 8 mice, nAged+GDF11 = 7 mice; F (2, 20) = 45.5). g, Measurement of the sucrose preference index over two days (volume consumed from the sucrose bottle divided by the total volume consumed) (nYoung = 10 mice, nAged = 12 mice, nAged+GDF11 = 12 mice; F (2, 31) = 7.8). h, Measurement of the time spent avoiding the intruder during the social interaction test (nYoung = 6 mice, nAged = 6 mice, nAged+GDF11 = 6 mice; F (2, 15) = 33.7). One-way analysis of variance (ANOVA) and Tukey’s post hoc test for multiple comparisons; F (DFn, DFd) values presented for each ANOVA statistical analysis; P values <0.05 are represented on the graph; mean ± standard error of the mean (s.e.m.). Source data
Fig. 2
Fig. 2. Cellular changes induced by GDF11 treatment in the brains of aged mice.
a, Representative confocal images of the DG of the hippocampus of young, aged and aged-GDF11 mice immunostained for Sox2 (red) and DAPI (blue). Scale bar: 100 μm. b, Quantification of Sox2+ NSCs in the SGL of the DG (nYoung = 6 mice, nAged = 7 mice, nAged+GDF11 = 8 mice; F (2, 18) = 21). c, Quantification of DCX+ neuroblasts in the SGL of the DG (nYoung = 8 mice, nAged = 9 mice, nAged+GDF11 = 9 mice; F (2, 23) = 30.3; #P value by Mann–Whitney test between aged and aged + GDF11). d, Representative images of SA-βGal staining in the DG of young, aged and aged-GDF11 mice. Scale bar: 100 μm. e, Quantification of SA-βGal+ cells in the SGZ of the DG (n = 5 mice per group; F (2, 12) = 10.3). f,g, Real-time qPCR for hallmarks of senescence showing fold changes in mRNA levels of p16 (f) (nYoung = 8 mice, nAged = 9 mice, nAged+GDF11 = 4 mice; F (2, 18) = 22.2) and p19 (g) (nYoung = 8 mice, nAged = 9 mice, nAged+GDF11 = 4 mice; F (2, 18) = 68) in hippocampi of young, aged and aged-GDF11 mice, relative to aged mice. h, Representative Western blot images of hippocampal lysates from young, aged and GDF11-treated aged mice after 9 days of treatment. ik, Quantification of western blots by optical intensity for Foxo3a (i) (nYoung = 3 mice, nAged = 3 mice, nAged+GDF11 = 5 mice; F (2, 8) = 63), Beclin 1 (j) (nYoung = 3 mice, nAged = 6 mice, nAged+GDF11 = 10 mice; F (2, 16) = 34.9), and LC3 (k) (nYoung = 3 mice, nAged = 3 mice, nAged+GDF11 = 5 mice; F (2, 8) = 5.7). One-way ANOVA and Tukey’s post hoc test for multiple comparisons; F (DFn, DFd) values presented for each ANOVA statistical analysis; P values < 0.05 are represented on the graph; mean ± s.e.m. Source data
Fig. 3
Fig. 3. GDF11 modulates neuronal activity and enhances autophagy in hippocampal neurons in vitro.
a, Schematic representation of the primary hippocampal neuronal cultures in vitro. Neurons were transfected with a GFP plasmid on DIV11 (only for the spine density experiment) and treated on DIV18. Scale bar: 20 μm. b, Representative confocal images of primary hippocampal neurons in vitro treated with vehicle (Ctrl), cLTP (positive control) or rGDF11 (40 ng ml−1) for 2 h on DIV18 and immunostained with cFos (red) and Hoechst (blue). Scale bar: 100 μm. c, Representative confocal images of GFP+ hippocampal neurons transfected with GFP (green) on DIV11 and treated with either vehicle (Ctrl) or cLTP (positive control) or rGDF11 (40 ng ml−1) on DIV18. Scale bar: 4 μm. d, Quantification of % cFos+ neurons per field (nCtrl = 12 fields, ncLTP = 10 fields, nGDF11 = 13 fields; F (2, 32) = 8.3). e, Quantification of dendritic spine density after a 2-h stimulation with either GDF11 or cLTP or vehicle (nCtrl = 18, ncLTP = 19, nGDF11 = 15 neurons examined over three independent experiments; F (2, 49) = 14.4). Numbers represent the number of spines for every 10 μm of primary dendrite. f, Western blots images of lysates from hippocampal neurons treated with GDF11 or control (vehicle). gj, Quantification of western blots by optical density for phospho-SMAD2/3 (g) (n = 4 biologically independent samples per condition), Beclin 1 (h) (n = 8 biologically independent samples per condition), LC3 (i) (n = 4 biologically independent samples per condition) and p62 (j) (n = 4 biologically independent samples per condition). One-way one-sided ANOVA and Tukey’s post hoc test for multiple comparisons; two-sided Mann–Whitney test for two-group comparisons; F (DFn, DFd) values presented for each ANOVA statistical analysis; P values <0.05 are represented on the graph; mean ± s.e.m. Source data
Fig. 4
Fig. 4. GDF11 stimulation of neuronal activity is mediated by autophagy.
a, Representative confocal images of GFP+ dendrites and spines from hippocampal neurons in culture transfected with either shBeclin 1 or GFP (green) and treated with either GDF11 or control (vehicle). Scale bar: 4 μm. b, Quantification of dendritic spine density after a 2-h stimulation with either GDF11 or control (number represents number of spines for every 10 μm of dendrite; nCtrl = 31, nshBec = 18, nGDF11 = 36, nshBec+GDF11 = 35 neurons examined over three independent experiments; F (3, 116) = 8.2). c, Representative confocal images of hippocampal neurons in vitro treated with vehicle, Baf or GDF11 or both and immunostained with cFos (green) and Hoechst (blue). Scale bar: 100 μm. d, Quantification of % cFos+ neurons per field (nCtrl = 31 fields, nBaf = 28 fields, nGDF11 = 28 fields, nBaf+GDF11 = 32 fields; F (3, 115) = 7.2). e, Oxygen consumption rate (OCR) in primary hippocampal neurons in vitro treated for 2 h with either GDF11 or Baf or both and measured with the Seahorse analyzer (nCtrl = 20, nBaf = 8, nGDF11 = 8, nBaf+GDF11 = 8 biologically independent samples). f, Measurement of basal OCR before oligomycin/FCCP addition (for each condition the three measurements were pooled; nCtrl = 24, nBaf = 21, nGDF11 = 21, nBaf+GDF11 = 24 biologically independent samples; F (3, 86) = 5.5). g, GSEA from RNA-seq on neurons treated with GDF11 or vehicle for 2 h. h, Western blots images of lysates from hippocampal neurons treated with GDF11 or control (vehicle). ik, Quantification of western blots by optical density for Deptor (i) (n = 4 biologically independent samples), phospho-S6K1 (j) (n = 8 biologically independent samples) and 4E-BP1 (k) (n = 4 biologically independent samples). Baf refers to Baf. One-way one-sided ANOVA and Tukey’s post hoc test for multiple comparisons; F (DFn, DFd) values presented for each ANOVA statistical analysis; two-sided Mann–Whitney test for two-group comparisons; P values < 0.05 are represented on the graph; mean ± s.e.m. Source data
Fig. 5
Fig. 5. Behavioral symptoms of the depressive-like phenotype are alleviated after treatment with GDF11 in young CORT mice.
a, Schematic representation of the experimental timeline and conditions. Veh, vehicle. b, Representative traces of the open field test. c, Measurement of the time spent in the center during the open field test (nCtrl = 8 mice, nCORT = 15 mice, nGDF11 = 8 mice, nCORT-GDF11 = 16 mice; F (3, 43) = 5.9). d, Measurement of the distance moved in the light box during the LDB test (nCtrl = 8 mice, nCORT = 15 mice, nGDF11 = 8 mice, nCORT-GDF11 = 15 mice; F (3, 42) = 4.6). e, Scoring of the coat state on five different areas of the mouse fur (back, abdomen, tail, forepaws and hindpaws) (nCtrl = 8 mice, nCORT = 14 mice, nGDF11 = 8 mice, nCORT-GDF11 = 16 mice; F (3, 42) = 19.8). One-way ANOVA and Tukey’s post hoc test for multiple comparisons; F (DFn, DFd) values presented for each ANOVA statistical analysis; P values < 0.05 are represented on the graph; mean ± s.e.m. Source data
Fig. 6
Fig. 6. Levels of GDF11 in the blood correlate with MDD in human subjects.
a, Table describing the clinical characteristics of the human young adults’ samples. MDD and healthy control participants were matched by sex (Pearson chi-square value = 0.002; df = 1; two-sided P value = 0.968), age (Student t test = −0.454; df = 106; two-sided P value = 0.651) and years of education (Student t test = 0.963; df = 106; two-sided P value = 0.338). There was a significant difference between groups in MADRS scores (Mann–Whitney U = 0.000; two-sided P value <0.001). b, Measurement of GDF11 by ELISA immunoassay in the serum of human healthy controls or young adults with MDD. There was a significant difference between groups in GDF11 levels (Mann–Whitney U = 1111.000; two-sided P value = 0.035). c, Table describing the clinical characteristics of the young adult individuals with a current depressive episode and controls. There was a significant difference between groups in sex (Pearson chi-square value = 41.613; df = 1; two-sided P value < 0.001), years of education (Student t test = 5.294; df = 752; two-sided P value < 0.001) and MADRS scores (Mann–Whitney U = 2961.500; two-sided P value < 0.001). There was no significant difference between groups in age (Student t test = −0.686; df = 757; two-sided P value = 0.493). d, Measurement of GDF11 by ELISA immunoassay in the serum of human controls or individuals with a current depressive episode. There was a significant difference between groups in GDF11 levels (Mann–Whitney U = 26894.000; two-sided P value = 0.001). The statistical analysis was conducted using the chi-squared test (sex), Student t test (age and years of education), and Mann–Whitney U test (MADRS and GDF11). Age and years of education are presented as mean values ± standard deviation (s.d.). MADRS are presented as the median and interquartile range. GDF11 levels are shown as Tukey boxplots, where the boxes represent the median and interquartile range. *P < 0.05. Source data
Extended Data Fig. 1
Extended Data Fig. 1. GDF11 treatment does not affect anxiety-like state, general well-being or physical performance.
(ac) Behavioral tests related to anxiety: (a) Measurement of the distance moved in the Light Box, during the Light/Dark Box test (nYoung = 10 mice, nAged = 10 mice, nAged+GDF11 = 12 mice; F (2, 31) = 12.8), (b) Measurement of the time spent in the Light Box, during the Light/Dark Box test (nYoung = 10 mice, nAged = 10 mice, nAged+GDF11 = 12 mice; F (2, 31) = 8.5), (c) Measurement of the time spent in the open arms, during the Elevated Plus Maze test (nYoung = 10 mice, nAged = 10 mice, nAged+GDF11 = 12 mice; F (2, 31) = 1.0). (df) Behavioral tests related to general well-being: (d) Measurement of the height of the nest (nYoung = 10 mice, nAged = 10 mice, nAged+GDF11 = 12 mice; F (2, 31) = 0.8), (e) Scoring of the nest quality based on five criteria (nYoung = 10 mice, nAged = 10 mice, nAged+GDF11 = 12 mice; F (2, 31) = 1.2), (f) measurement of the burrowing index (percentage of weight of pellets removed from the burrow divided by total pellet weight), during the Burrowing test (nYoung = 6 mice, nAged = 9 mice, nAged+GDF11 = 9 mice; F (2, 21) = 0.5). (gj) Behavioral tests related to physical performance: (g) measurement of the distance moved during the Open Field test (nYoung = 11 mice, nAged = 11 mice, nAged+GDF11 = 12 mice; F (2, 31) = 2.7), (h) measurement of the time mice spent hanging on the wire during the Hanging Wire test (nYoung = 10 mice, nAged = 10 mice, nAged+GDF11 = 10 mice; F (2, 27) = 3.6), (i) measurement of the hind paw and fore paw stride length during the Gait test (nYoung = 10 mice, nAged = 13 mice, nAged+GDF11 = 11 mice; F (2, 62) = 0.03), (j) measurement of the hind base and front base length during the Gait test (nYoung = 10 mice, nAged = 13 mice, nAged+GDF11 = 11 mice; F (2, 62) = 7.4). One-way and two-way ANOVA and Tukey’s post hoc test for multiple comparisons; F (DFn, DFd) value presented for each ANOVA statistical analysis; P values < 0.05 are represented on the graph; mean ± s.e.m. Source data
Extended Data Fig. 2
Extended Data Fig. 2. DCX expression in the DG after GDF11 treatment.
(a) Representative confocal images of the dentate gyrus of the hippocampus immunostained for DCX (doublecortin, a marker of immature neuroblasts) in green (nYoung = 8 mice, nAged = 9 mice, nAged+GDF11 = 9 mice) relative to quantification Fig. 2c. Scale bar: 100 μm.
Extended Data Fig. 3
Extended Data Fig. 3. Intracerebroventricular GDF11 infusion recapitulates all aspects of systemic treatment except neurogenesis.
(a) Schematic representation of the experimental procedure: miniosmotic pumps were implanted in the lateral ventricle and rGDF11 or vehicle was infused at a constant rate over 2 weeks. (b) Measurement of discrimination index during the NORT (percentage of time spent to observe the novel object divided by the percentage of total investigation time for both objects) (n = 4 mice per group). (c) Measurement of grooming frequency during the Splash test (n = 5 mice per group). (d) Measurement of time spent in the Light box during the Light/Dark Box Test (n = 6 mice per group). (e) Representation of latency to eat for mice during the Novelty Suppressed feeding test (n = 5 mice per group). (f) Quantification of Sox2+ NSCs in the SGL of the dentate gyrus (nVeh = 4 mice, nGDF11 = 5 mice). (g) Quantification of DCX+ neuroblasts in the SGL of the dentate gyrus (nVeh = 4 mice, nGDF11 = 5 mice). (hk) Quantification of Western blots by optical density for Beclin 1 (i) (nVeh = 4 mice, nGDF11 = 5 mice), Atg5 (j) (nVeh = 4 mice, nGDF11 = 5 mice), and Lamp1 (k) (nVeh = 4 mice, nGDF11 = 5 mice). Two-sided Mann–Whitney test for two-group comparisons; P values < 0.05 are represented on the graph; mean ± s.e.m. Source data
Extended Data Fig. 4
Extended Data Fig. 4. GDF11 has no effect on neurogenesis in vitro.
(a) Representative confocal images of neural stem cell differentiation into neuroblasts upon serum treatment (4 μl), rGDF11 protein (40 ng/ml) or no serum/no growth factors in the culture medium, immunostained for DCX (green) and Hoechst (blue). (b) Quantification of total neurite length per neuroblast (n = 5 wells per condition; F (3, 16) = 26.4). Scale bar, 20 μm. One-way ANOVA and Tukey’s post hoc test for multiple comparisons; F (DFn, DFd) value presented for each ANOVA statistical analysis; P values < 0.05 are represented on the graph; mean ± s.e.m. Source data
Extended Data Fig. 5
Extended Data Fig. 5. GDF11 treatment reduces weight of CORT mice.
(a) Measurement of weight over the weeks of CORT/veh treatment and GDF11/saline injections (nCtrl = 8 mice, nCORT = 16 mice, nGDF11 = 8 mice, nCORT-GDF11 = 16 mice). (b) Same measurement as (a), but only the CORT conditions are represented. (c) Measurement of the weight for CORT and CORT-GDF11 mice (n = 16 mice per group). (d) Measurement of the distance traveled during the Open Field test (nCtrl = 8 mice, nCORT = 15 mice, nGDF11 = 8 mice, nCORT-GDF11 = 16 mice; F (3, 43) = 2). One-way one-sided ANOVA and Tukey’s post hoc test for multiple comparisons; F (DFn, DFd) value shown for each statistical analysis; two-sided Mann–Whitney test for two-group comparisons; P values < 0.05 are represented on the graph; mean ± s.e.m. Source data

Comment in

References

    1. Hebert LE, Scherr PA, Bienias JL, Bennett DA, Evans DA. Alzheimer disease in the US population: prevalence estimates using the 2000 census. Arch. Neurol. 2003;60:1119–1122. doi: 10.1001/archneur.60.8.1119. - DOI - PubMed
    1. Lam RW, Kennedy SH, McLntyre RS, Khullar A. Cognitive dysfunction in major depressive disorder: effects on psychosocial functioning and implications for treatment. Can J Psychiatry. 2014;59:649–654. doi: 10.1177/070674371405901206. - DOI - PMC - PubMed
    1. Wolkowitz OM, Epel ES, Reus VI, Mellon SH. Depression gets old fast: do stress and depression accelerate cell aging? Depress Anxiety. 2010;27:327–338. doi: 10.1002/da.20686. - DOI - PubMed
    1. MacQueen G, Frodl T. The hippocampus in major depression: evidence for the convergence of the bench and bedside in psychiatric research? Mol. Psychiatry. 2011;16:252–264. doi: 10.1038/mp.2010.80. - DOI - PubMed
    1. Siopi E, et al. Anxiety- and depression-like states lead to pronounced olfactory deficits and impaired adult neurogenesis in mice. J. Neurosci. 2016;36:518–531. doi: 10.1523/JNEUROSCI.2817-15.2016. - DOI - PMC - PubMed

Publication types

Substances