. 2022 Sep;3(9):694-702.
doi: 10.1038/s43016-022-00594-9. Epub 2022 Sep 19.

Global dietary quality in 185 countries from 1990 to 2018 show wide differences by nation, age, education, and urbanicity

Collaborators, Affiliations

Global dietary quality in 185 countries from 1990 to 2018 show wide differences by nation, age, education, and urbanicity

Victoria Miller et al. Nat Food. 2022 Sep.

Abstract

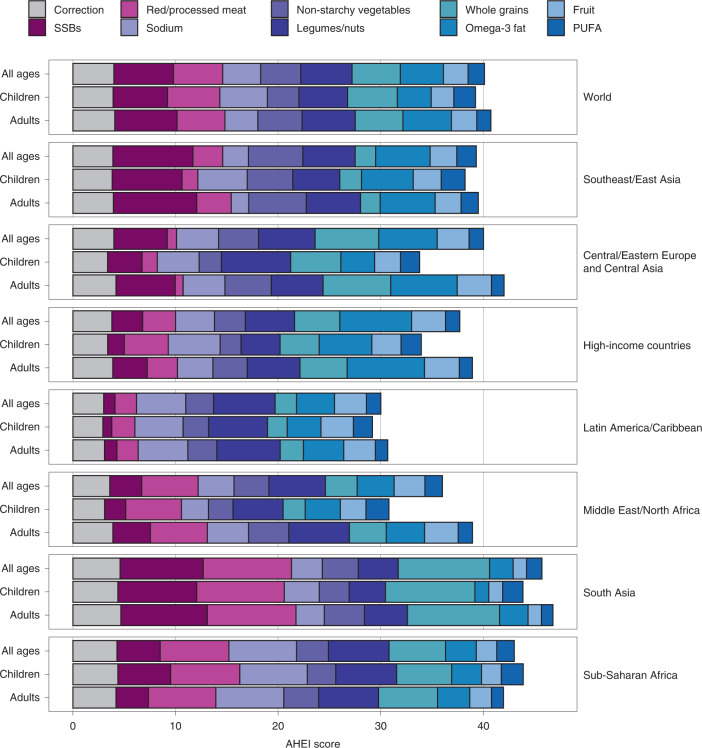
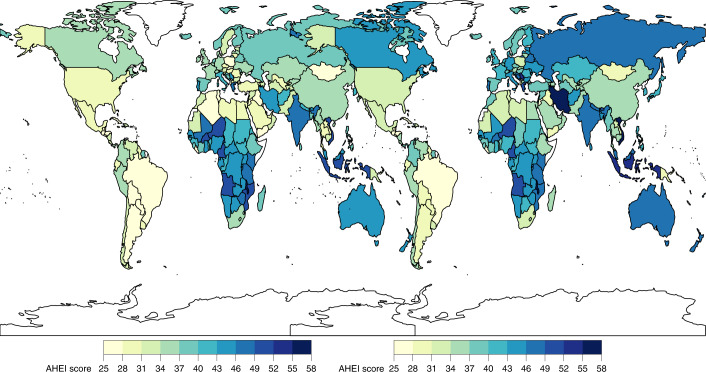
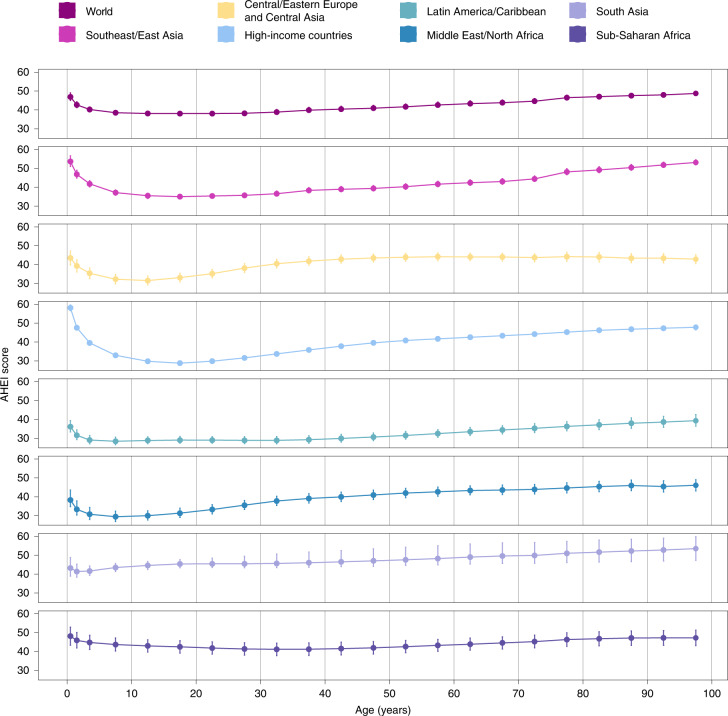
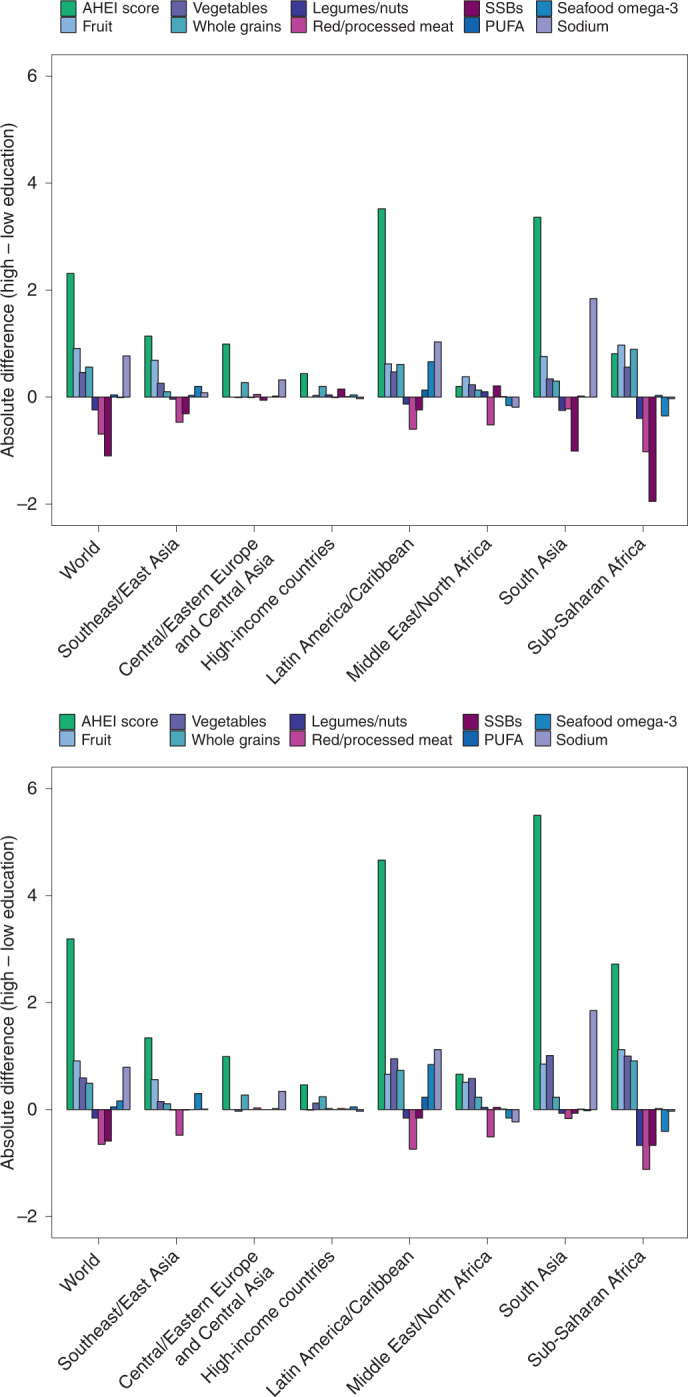
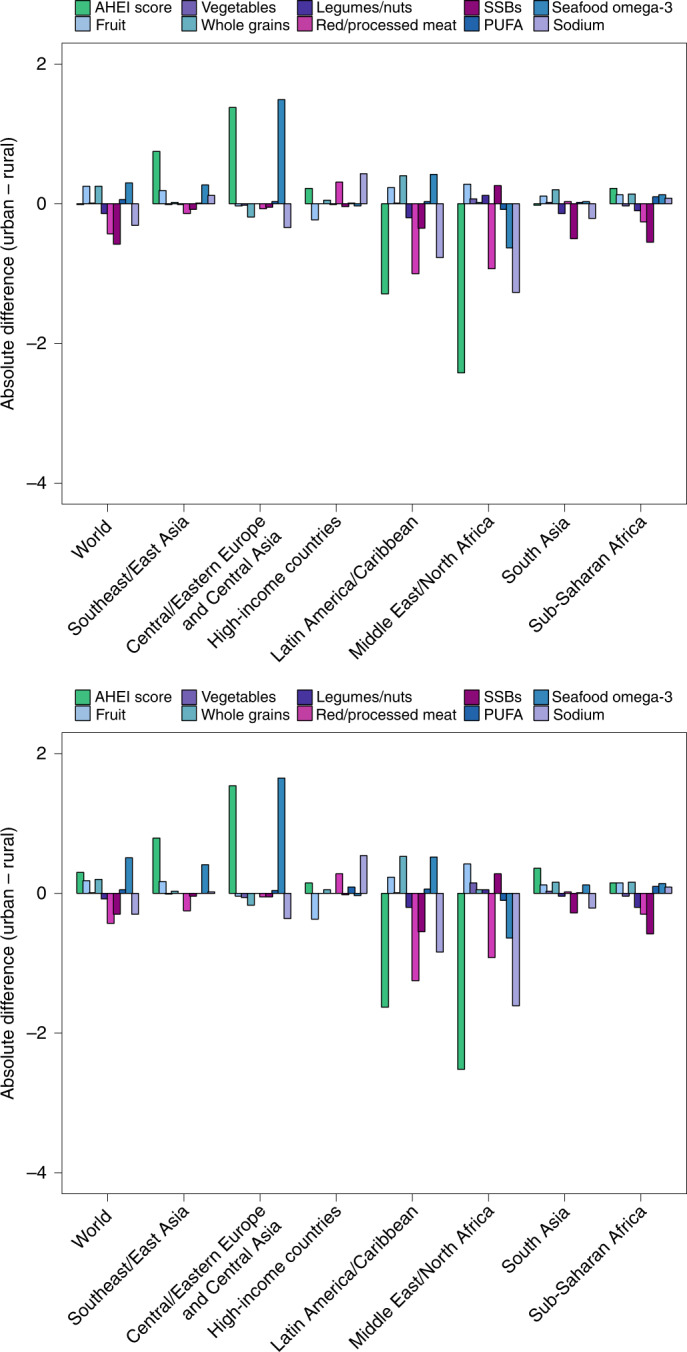
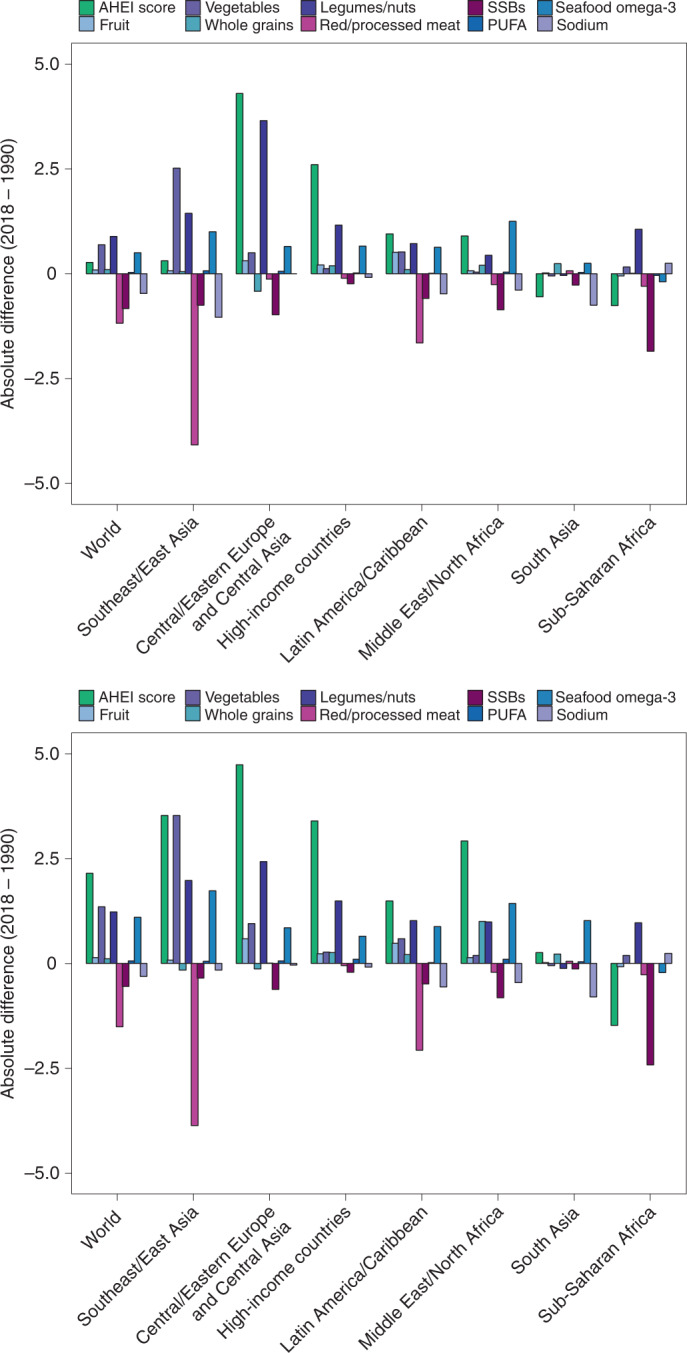
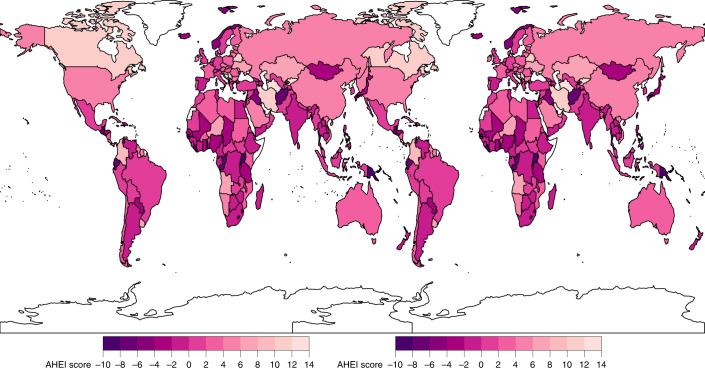
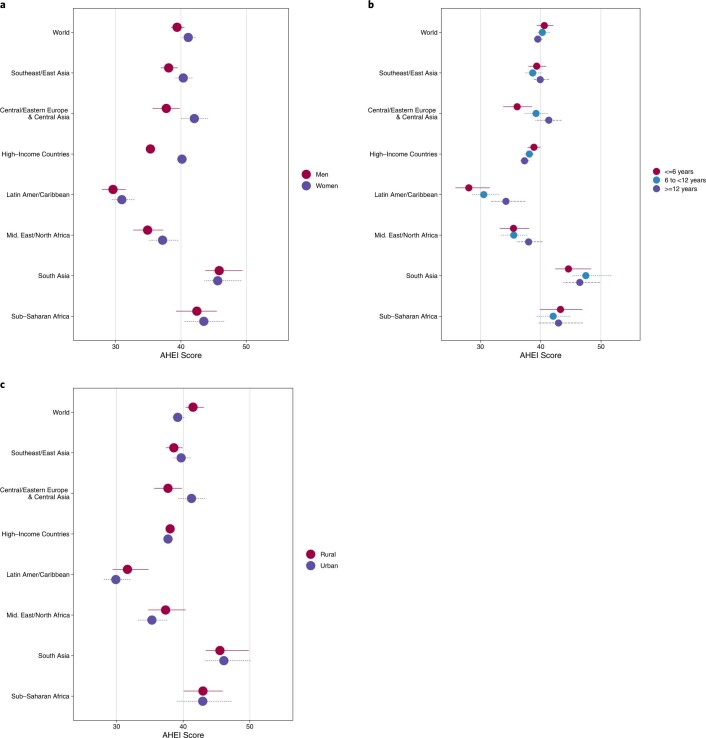
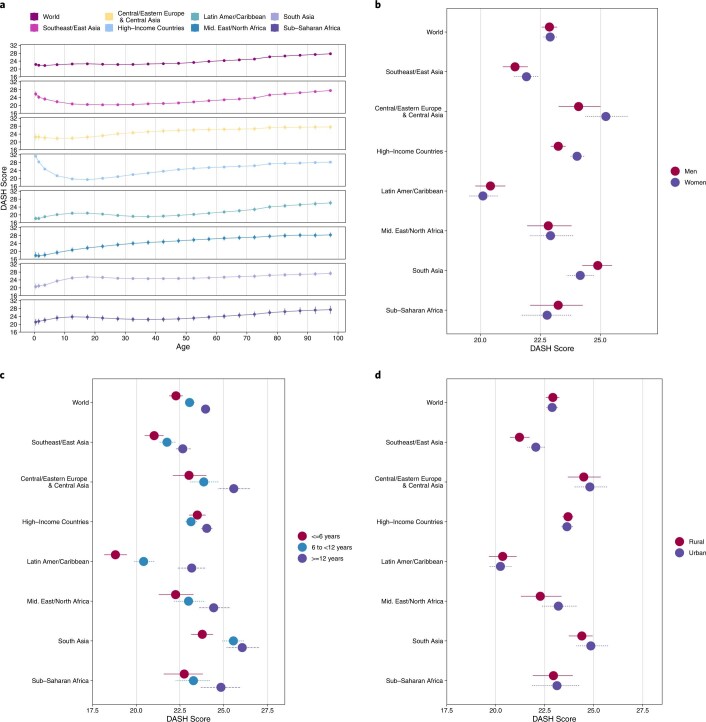
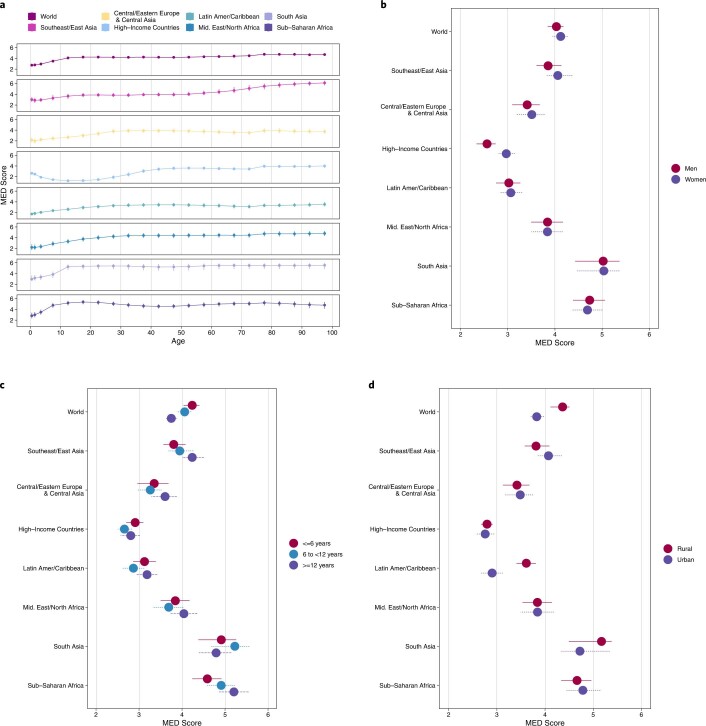
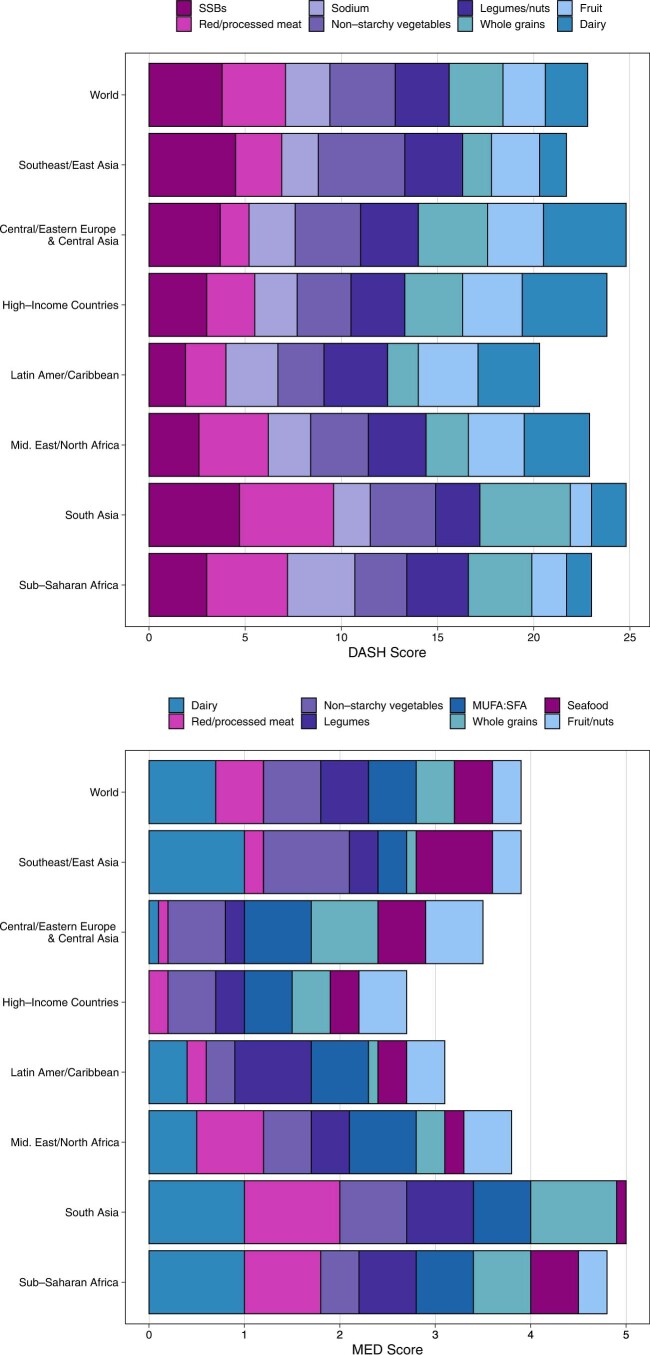
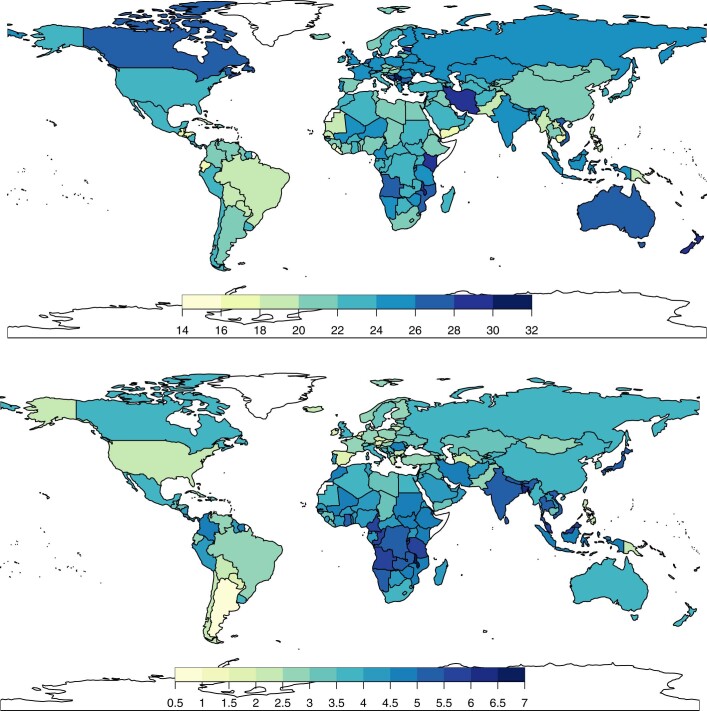
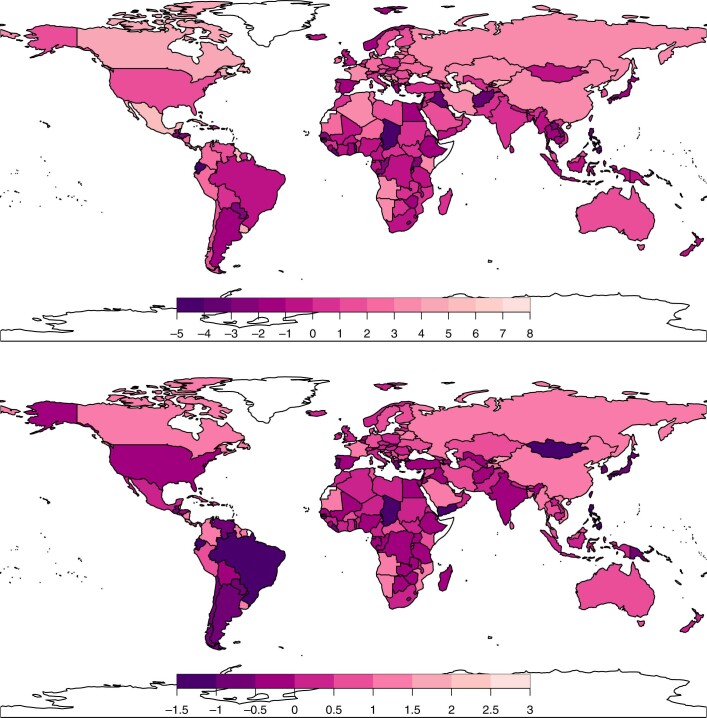
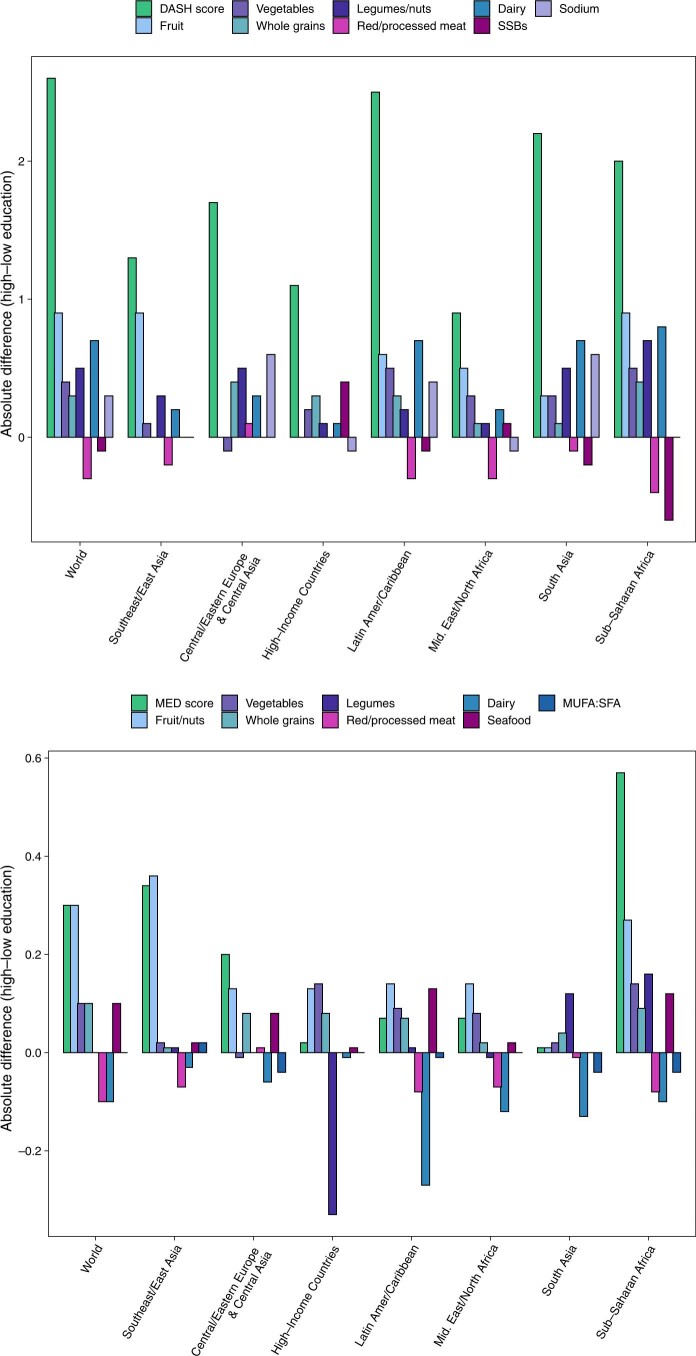
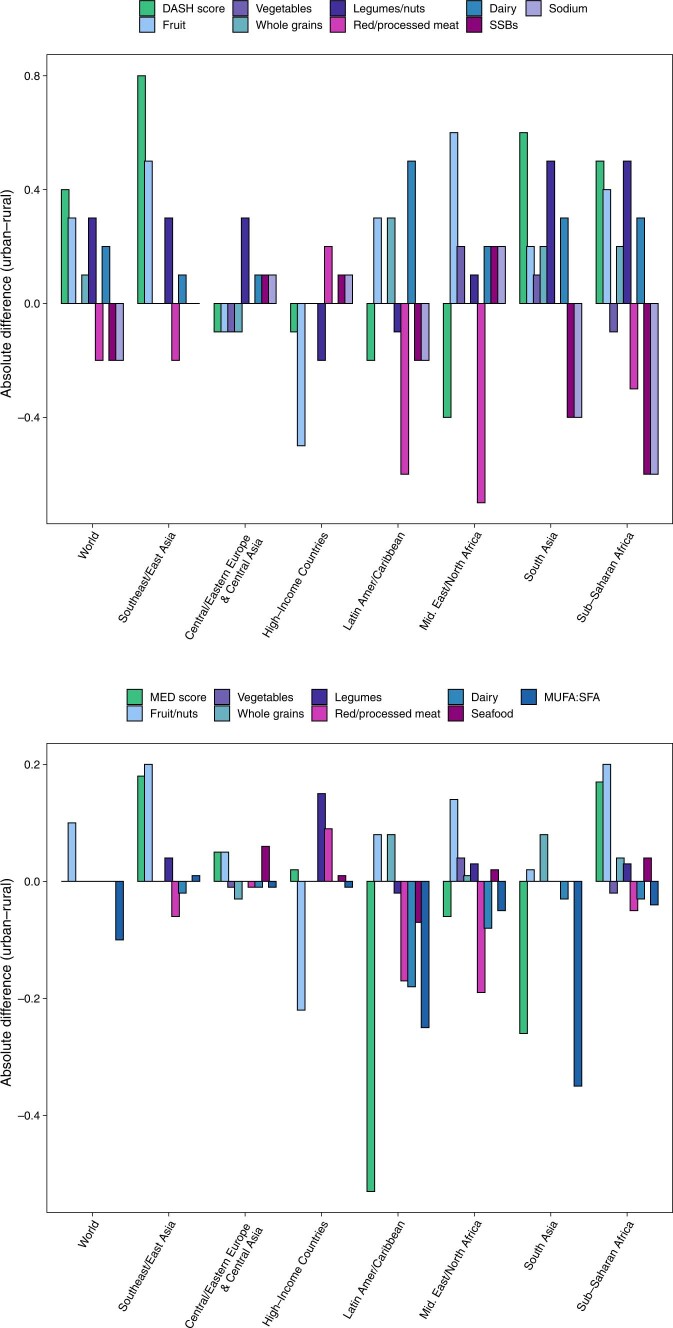
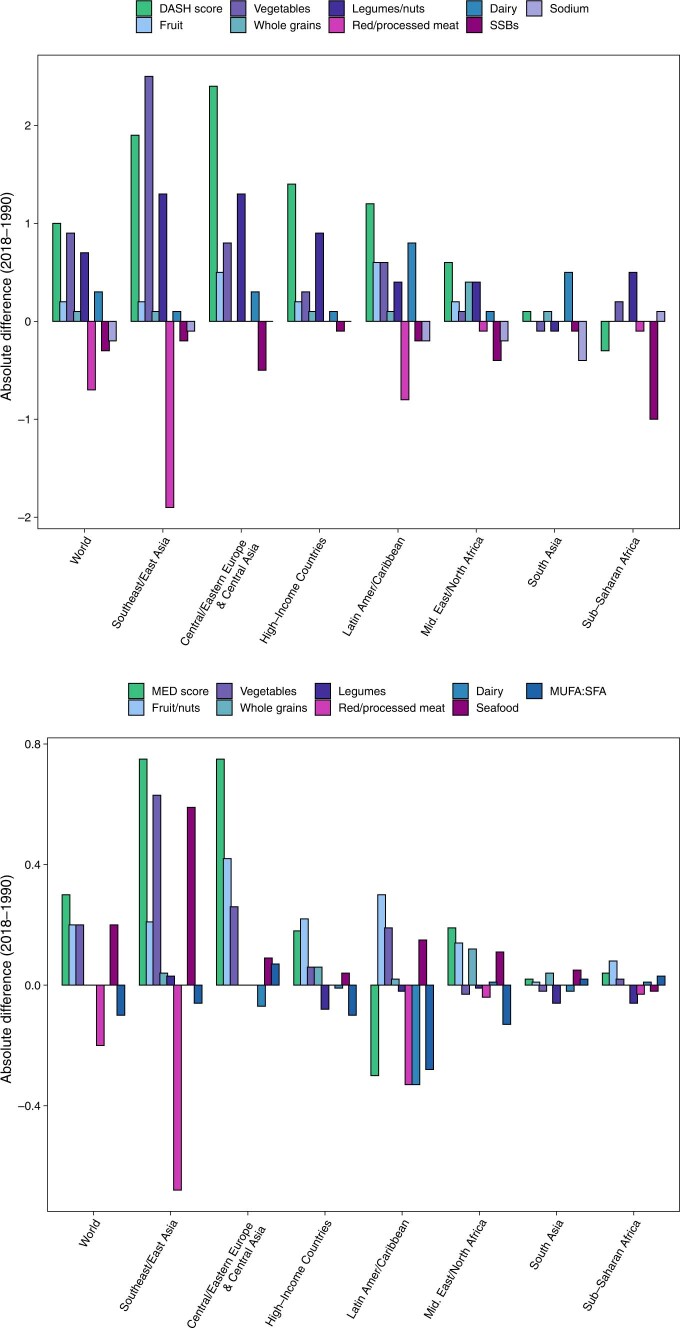
Evidence on what people eat globally is limited in scope and rigour, especially as it relates to children and adolescents. This impairs target setting and investment in evidence-based actions to support healthy sustainable diets. Here we quantified global, regional and national dietary patterns among children and adults, by age group, sex, education and urbanicity, across 185 countries between 1990 and 2018, on the basis of data from the Global Dietary Database project. Our primary measure was the Alternative Healthy Eating Index, a validated score of diet quality; Dietary Approaches to Stop Hypertension and Mediterranean Diet Score patterns were secondarily assessed. Dietary quality is generally modest worldwide. In 2018, the mean global Alternative Healthy Eating Index score was 40.3, ranging from 0 (least healthy) to 100 (most healthy), with regional means ranging from 30.3 in Latin America and the Caribbean to 45.7 in South Asia. Scores among children versus adults were generally similar across regions, except in Central/Eastern Europe and Central Asia, high-income countries, and the Middle East and Northern Africa, where children had lower diet quality. Globally, diet quality scores were higher among women versus men, and more versus less educated individuals. Diet quality increased modestly between 1990 and 2018 globally and in all world regions except in South Asia and Sub-Saharan Africa, where it did not improve.


Conflict of interest statement

V.M. reports research funding from the Canadian Institutes of Health Research, outside the submitted work. P.W. reports research grants and contracts from the United States Agency for International Development and personal fees from the Global Panel on Agriculture and Food Systems for Nutrition, outside the submitted work. J.R., J.Z. and P.S. report research funding from Nestlé, outside the submitted work. J.C. reports research funding from the Bill and Melinda Gates Foundation and the United States Agency for International Development, and personal fees from UNICEF/WHO, outside the submitted work. D.M. reports research funding from the National Institutes of Health and the Bill and Melinda Gates Foundation; personal fees from GOED, Bunge, Indigo Agriculture, Motif FoodWorks, Amarin, Acasti Pharma, Cleveland Clinic Foundation, America’s Test Kitchen and Danone; scientific advisory board member for Brightseed, DayTwo, Elysium Health, Filtricine, HumanCo and Tiny Organics; and chapter royalties from UpToDate, all outside the submitted work. The other authors have no disclosures to declare.

Figures

Fig. 1
Fig. 1. Global and regional mean AHEI component scores by age (all ages, children only and adults only) in 2018.
AHEI score: nine components scored from 0 to 10 each and scaled to ten components (correction for trans fat shown). Healthy components: fruit, non-starchy vegetables, legumes/nuts, whole grains, PUFAs and seafood omega-3 fat; unhealthy components: red/processed meat, SSBs and sodium.
Fig. 2
Fig. 2. National mean AHEI scores among children (left) and adults (right) in 2018.
Children: ≤1 years to ≤19 years; adults: ≥20 years. The AHEI score ranged from 0 to 100. The mean national score was computed as the sum of the stratum-level component scores and aggregated to the national mean using weighted population proportions for 2018.
Fig. 3
Fig. 3. Global and regional mean AHEI scores, by age (years) in 2018.
The AHEI score ranged from 0 to 100. The circles represent the global or regional mean for the age group, and the error bars represent the corresponding 95% UI. The mean and its UI are plotted for the midpoint of each age group (<1, 1–2, 3–4, 5–9, 10–14, 15–19, 20–24, 25–29, 30–34, 35–39, 40–44, 45–49, 50–54, 55–59, 60–64, 65–69, 70–74, 75–79, 80–84, 85–89, 90–94 and ≥95 years).
Fig. 4
Fig. 4. Global and regional mean absolute differences in AHEI component scores in children (top) and adults (bottom) in 2018, by high versus low education level.
AHEI score: nine components scored from 0 to 10 each and scaled to ten components (correction not shown). The absolute difference by education was computed as the difference at the stratum level and aggregated to the global and regional mean differences using weighted population proportions for low (<6 years) and high education levels (≥12 years) only (excludes education level ≥6 and <12 years).
Fig. 5
Fig. 5. Global and regional mean absolute differences in AHEI component scores in children (top) and adults (bottom) in 2018, by urban versus rural residence.
AHEI score: nine components scored from 0 to 10 each and scaled to ten components (correction not shown). The absolute difference by urbanicity was computed as the difference at the stratum level and aggregated to the global and regional mean differences using weighted population proportions.
Fig. 6
Fig. 6. Global and regional mean absolute differences in AHEI component scores in children (top) and adults (bottom), between 2018 and 1990.
AHEI score: nine components scored from 0 to 10 each and scaled to ten components (correction not shown). The absolute difference by time was computed as the difference at the stratum level and aggregated to the global and regional mean differences using weighted population proportions for 2018.
Fig. 7
Fig. 7. National mean absolute change in AHEI scores among children (left) and adults (right) between 1990 and 2018.
The AHEI score ranged from 0 to 100. The absolute difference between 2018 and 1990 was computed as the difference at the stratum level and aggregated to the national mean differences using weighted population proportions for 2018.
Extended Data Fig. 1
Extended Data Fig. 1. Global and regional AHEI score by (A) sex, (B) education, and (C) urban/rural residence in 2018.
Data are the mean score (95% uncertainty interval). The AHEI score ranged from 0 to 100. <6 years: <6 years of education; ≥6 to <12 years: ≥6 to <12 years of education; ≥12 years: ≥12 years of education. Rural: rural residence; urban: urban residence.
Extended Data Fig. 2
Extended Data Fig. 2. Global and regional DASH score by (A) age, (B) sex, (C) education, and (D) urban/rural residence in 2018.
Data are the mean score (95% uncertainty interval). The DASH score ranged from 5 to 40. <6 years: <6 years of education; ≥6 to <12 years: ≥6 to <12 years of education; ≥12 years: ≥12 years of education. Rural: rural residence; urban: urban residence.
Extended Data Fig. 3
Extended Data Fig. 3. Global and regional MED score by (A) age, (B) sex, (C) education, and (D) urban/rural residence in 2018.
Data are the mean score (95% uncertainty interval). The MED score ranged from 0 to 8. <6 years: <6 years of education; ≥6 to <12 years: ≥6 to <12 years of education; ≥12 years: ≥12 years of education. Rural: rural residence; urban: urban residence.
Extended Data Fig. 4
Extended Data Fig. 4. Global and region mean DASH scores (top panel), and MED scores (bottom panel) among all ages (children and adults) in 2018.
The DASH score ranged from 5 to 40, and the MED score ranged from 0 to 8.
Extended Data Fig. 5
Extended Data Fig. 5. National mean DASH scores (top panel), and MED scores (bottom panel) among all ages (children and adults) in 2018.
The DASH score ranged from 5 to 40, and the MED score ranged from 0 to 8.
Extended Data Fig. 6
Extended Data Fig. 6. National mean absolute change in DASH scores (top panel), and MED scores (bottom panel) among all ages (children and adults) in 2018.
The DASH score ranged from 5 to 40, and the MED score ranged from 0 to 8. The absolute difference between 2018 and 1990 was computed as the difference at the stratum-level and aggregated to the global and regional mean differences using weighted population proportions for 2018.
Extended Data Fig. 7
Extended Data Fig. 7. Global and regional mean absolute difference in DASH component scores (top panel) and MED component scores (bottom panel) in all ages (children and adults) in 2018, by high versus low education level.
The absolute difference by education was computed as the difference at the stratum-level and aggregated to the global and regional mean differences using weighted population proportions for low (<6 years) and high education levels (≥12 years) only (excludes education level = ≥6 to <12 years).
Extended Data Fig. 8
Extended Data Fig. 8. Global and regional mean absolute difference in DASH component scores (top panel) and MED component scores (bottom panel) in all ages (children and adults) in 2018, by urban versus rural residence.
The absolute difference by urbanicity was computed as the difference at the stratum-level and aggregated to the global and regional mean differences using weighted population proportions.
Extended Data Fig. 9
Extended Data Fig. 9. Global and regional mean absolute difference in DASH component scores (top panel) and MED component scores (bottom panel) in all ages (children and adults) between 2018 and 1990.
The absolute difference by time was computed as the difference at the stratum-level and aggregated to the global and regional mean differences using weighted population proportions for 2018.

References

    1. 2021 Global Nutrition Report: The State of Global Nutrition (Development Initiatives, 2021).
    1. GBD 2017 Causes of Death Collaborators. Global, regional, and national age-sex-specific mortality for 282 causes of death in 195 countries and territories, 1980–2017: a systematic analysis for the Global Burden of Disease Study 2017. Lancet10.1016/s0140-6736(18)32203-7 (2018). - PMC - PubMed
    1. GBD 2017 Risk Factor Collaborators. Global, regional, and national comparative risk assessment of 84 behavioural, environmental and occupational, and metabolic risks or clusters of risks for 195 countries and territories, 1990–2017: a systematic analysis for the Global Burden of Disease Study 2017. Lancet10.1016/s0140-6736(18)32225-6 (2018). - PMC - PubMed
    1. GBD 2017 Diet Collaborators. Health effects of dietary risks in 195 countries, 1990–2017: a systematic analysis for the Global Burden of Disease Study 2017. Lancet10.1016/s0140-6736(19)30041-8 (2019). - PMC - PubMed
    1. Sacks FM, et al. Rationale and design of the Dietary Approaches to Stop Hypertension trial (DASH). A multicenter controlled-feeding study of dietary patterns to lower blood pressure. Ann. Epidemiol. 1995;5:108–118. doi: 10.1016/1047-2797(94)00055-X. - DOI - PubMed

Publication types