. 2022 Oct;2(10):885-895.
doi: 10.1038/s43587-022-00286-w. Epub 2022 Oct 14.

Long-term life history predicts current gut microbiome in a population-based cohort study

Affiliations

Long-term life history predicts current gut microbiome in a population-based cohort study

Jiyeon Si et al. Nat Aging. 2022 Oct.

Abstract

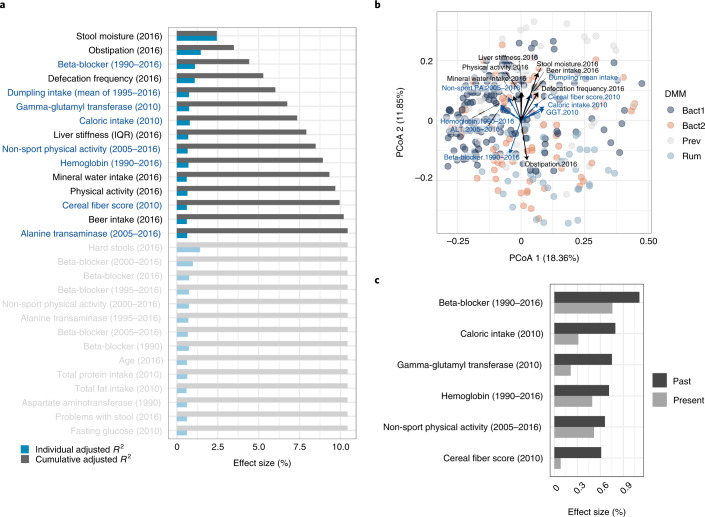
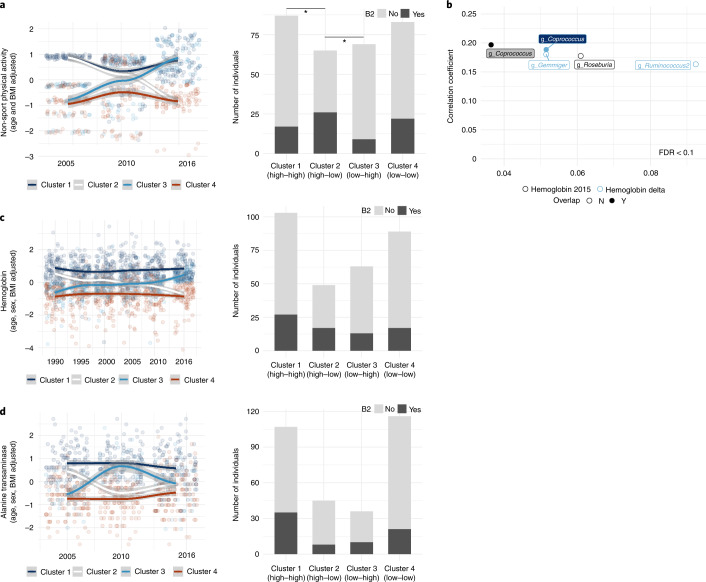
Extensive scientific and clinical microbiome studies have explored contemporary variation and dynamics of the gut microbiome in human health and disease1-3, yet the role of long-term life history effects has been underinvestigated. Here, we analyzed the current, quantitative microbiome composition in the older adult Bruneck Study cohort (Italians, Bruneck, n = 304 (male, 154; female, 150); age 65-98 years) with extensive clinical, demographic, lifestyle and nutritional data collected over the past 26 years4. Multivariate analysis of historical variables indicated that medication history, historical physical activity, past dietary habits and specific past laboratory blood parameters explain a significant fraction of current quantitative microbiome variation in older adults, enlarging the explanatory power of contemporary covariates by 33.4%. Prediction of current enterotype by a combination of past and contemporary host variables revealed good levels of predictability (area under the curve (AUC), 0.78-0.83), with Prevotella and dysbiotic Bacteroides 2 being the best predicted enterotypes. These findings demonstrate long-term life history effects on the microbiota and provide insights into lifestyle variables and their role in maintaining a healthy gut microbiota in later life.


Conflict of interest statement

The authors declare no competing interests.

Figures

Fig. 1
Fig. 1. Explanatory variables for the microbiome variation in the Bruneck Study cohort.
a, Individual and cumulative effect size of contemporary and historical covariates. Dark-colored bars indicate individual (upper bar) and cumulative (lower bar) effect sizes of variables included in the forward stepwise RDA model. Historical covariates are denoted with blue labels. IQR, interquartile range. b, Principal coordinate analysis (PCoA) based on Bray–Curtis dissimilarity. Arrows indicate significant covariates that can significantly explain the current microbiome variation. Colour key indicates different enterotypes. GGT, γ-glutamyl transferase; PA, physical activity. c, Comparison of the individual effect size of historical parameters and contemporary covariates. All statistical tests were performed on 304 individuals in the Bruneck Study cohort.
Fig. 2
Fig. 2. Association of beta-blocker history with microbiomes of older adults.
a, Left, evaluation of model fit was performed using Bayesian information criterion (BIC) where the best model fit was found at four Dirichlet components. The FGFP cohort (n = 2,215) was used as a background dataset when enterotyping the Bruneck cohort. Right, top seven most abundant genera in enterotypes. b, Ordination plot by beta-blocker treatment (PCoA based on Bray–Curtis dissimilarity; Adonis r2 = 0.013, P = 0.0002). c, Biodiversity of individuals by beta-blocker treatment. No groups is significantly different. d, Left, prevalence of enterotype by beta-blocker treatment (Fisher’s exact test permuted, P = 0.0005). Chronic, treatment with beta-blocker both in 1990 and 2016; current, currently medicated; and none, not medicated in 1990 and 2016. Right, number of years of beta-blocker treatment across the years. An asterisk indicates FDR < 0.1 by Kruskal–Wallis test followed by post hoc Dunn’s test. e, Association of beta-blocker use with cardiovascular disease history and diet (chi-squared test, P = 0.327). Boxes represent the 25th percentile, median, and 75th percentile. Whiskers represent the lowest and highest values of the data. All statistical tests used were two sided and performed on 304 individuals in the Bruneck Study cohort. A.total.AHEL, total Alternate Healthy Eating Index.
Fig. 3
Fig. 3. Link of life history with the gut microbiome of older adults.
a, Left, clusters of non-sport physical activity across the years. Right, comparisons of the ratio of B2 and non-B2 by clusters were plotted by bar graphs. An asterisk indicates pairwise chi-squared test FDR < 0.1. b, Correlation of hemoglobin with current bacterial abundances after adjusting for age and stool moisture. Color-filled labels indicate taxa overlapping between historical and current levels of hemoglobin (partial correlation, FDR < 0.1). c,d, Comparison of clusters of hemoglobin (c) and ALT (d) across the years. Cluster 1, high activity in the past and at present; cluster 2, high activity in the past and low activity at present; cluster 3, low activity in the past and high activity at present; and cluster 4, low activity in the past and at present. All statistical tests used were two sided and performed on 304 individuals in the Bruneck Study cohort.
Fig. 4
Fig. 4. Prediction of current microbiome using life history.
a, Receiver operating characteristic curve for the evaluations in 1995, 2000, 2005, 2010, 2016 and all years together based on 40 rounds of 40-fold cross-validation. Error bars indicate ranges of true-positive rate (TPR) in the cross-validation process. FPR, false positive rate. Data are shown as mean TPR ± standard error (SE) obtained from the cross-validation. The mean AUCs and their s.d. are shown in the bottom-right corner. b, Proportion of the variables in each category per enterotype. Top, variables selected from the analysis of each year. Bottom, variables selected from the analysis of all years together. c, Proportion of feature importance calculated for each enterotype in the analysis of all years together. Divisions within the bar chart indicate different variables. Values reported are the mean of the cross-validation replicates. The numbers in parentheses indicate the combined number of variables selected. All analyses were performed on 304 individuals in the Bruneck Study cohort.
Extended Data Fig. 1
Extended Data Fig. 1. Prediction of current microbiome using life history.
(a) Variables selected for enterotypes in the analysis of individual years and (b) all years combined. All statistical tests were performed on 304 subjects in the Bruneck Study cohort.
Extended Data Fig. 2
Extended Data Fig. 2. Changes in dietary habits and lifestyles across the years.
Each dot indicates average value of the year. All statistical tests were performed on 304 subjects in the Bruneck Study cohort.
Extended Data Fig. 3
Extended Data Fig. 3. Evaluation of number of data features in modeling.
(a) Relationship between number of features and AUC values in prediction models (a) with and (b) without feature selection. (c) Comparison of mean AUC and number of features between predictions with or without feature selection (Wilcoxon rank-sum test, p < 0.0001 for both). (d) Number of features entered in prediction models with feature selection (Spearman rho = 0.048; p−value = 0.771). Boxes represent the 25th percentile, median, and 75th percentile. Whiskers represent the lowest and highest values of the data. The grey bands represent the 95% confidence interval. All analyses were performed on 304 subjects in the Bruneck Study cohort.

References

    1. Falony G, et al. Population-level analysis of gut microbiome variation. Science. 2016;352:560–564. doi: 10.1126/science.aad3503. - DOI - PubMed
    1. Valles-Colomer M, et al. The neuroactive potential of the human gut microbiota in quality of life and depression. Nat. Microbiol. 2019;4:623–632. doi: 10.1038/s41564-018-0337-x. - DOI - PubMed
    1. Vieira-Silva S, et al. Statin therapy is associated with lower prevalence of gut microbiota dysbiosis. Nature. 2020;581:310–315. doi: 10.1038/s41586-020-2269-x. - DOI - PubMed
    1. Kiechl S, Willeit J. In a nutshell: findings from the Bruneck study. Gerontology. 2019;65:9–19. doi: 10.1159/000492329. - DOI - PubMed
    1. Schmidt TSB, Raes J, Bork P. The human gut microbiome: from association to modulation. Cell. 2018;172:1198–1215. doi: 10.1016/j.cell.2018.02.044. - DOI - PubMed

Publication types

LinkOut - more resources