. 2023 Mar;3(3):327-345.
doi: 10.1038/s43587-023-00373-6. Epub 2023 Mar 9.

Heterochronic parabiosis reprograms the mouse brain transcriptome by shifting aging signatures in multiple cell types

Affiliations

Heterochronic parabiosis reprograms the mouse brain transcriptome by shifting aging signatures in multiple cell types

Methodios Ximerakis et al. Nat Aging. 2023 Mar.

Erratum in

Abstract

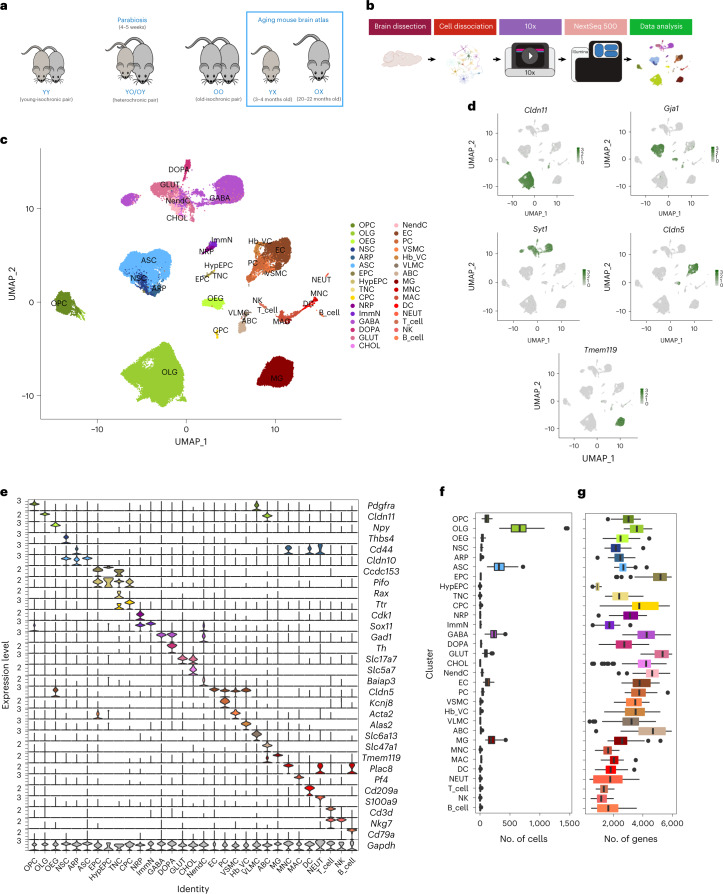
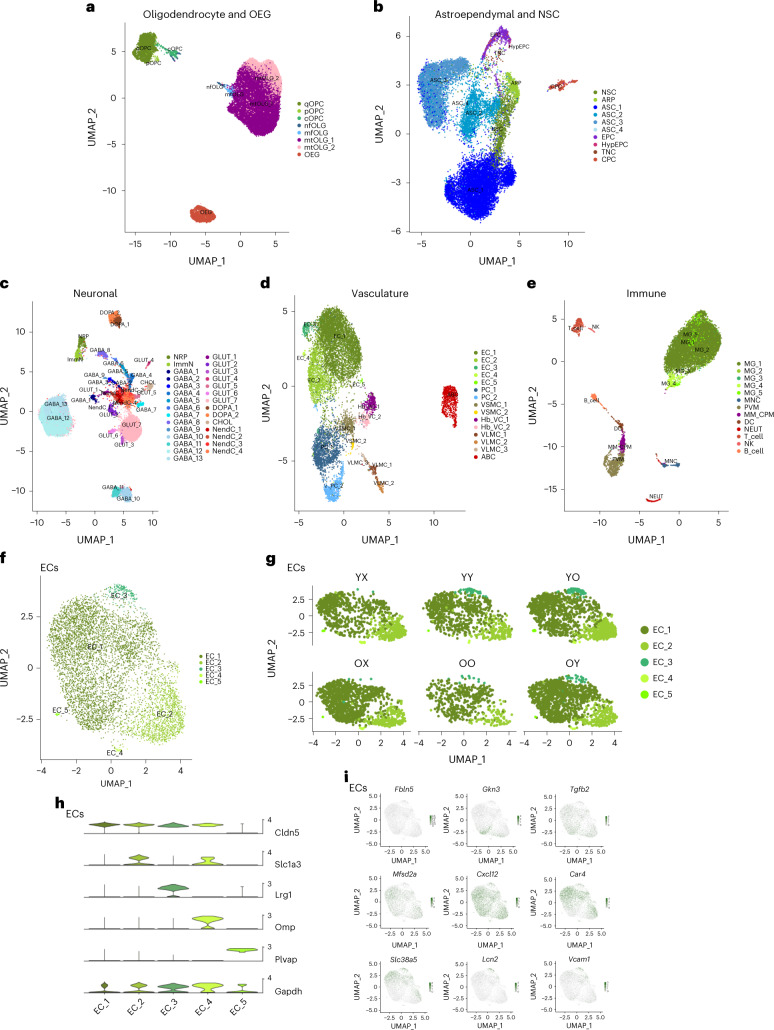
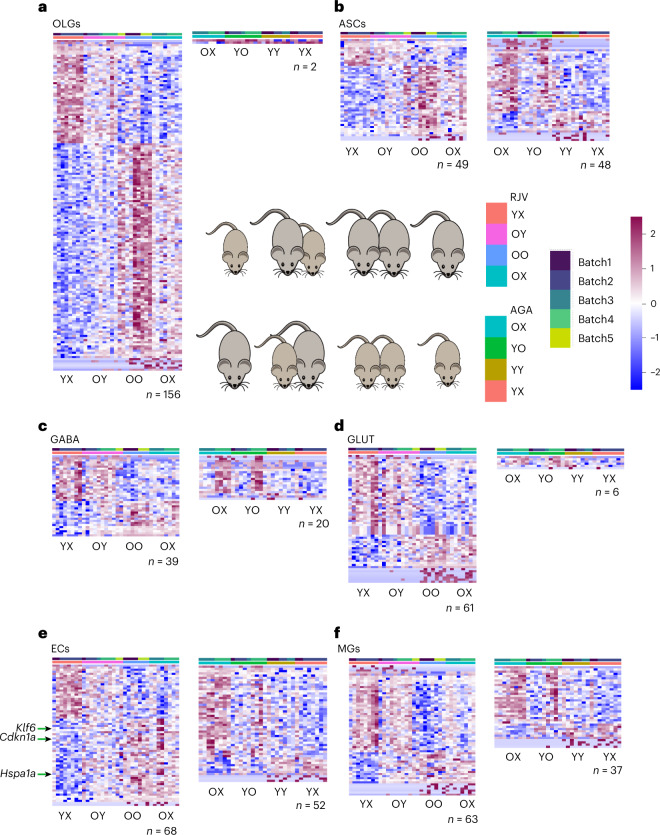
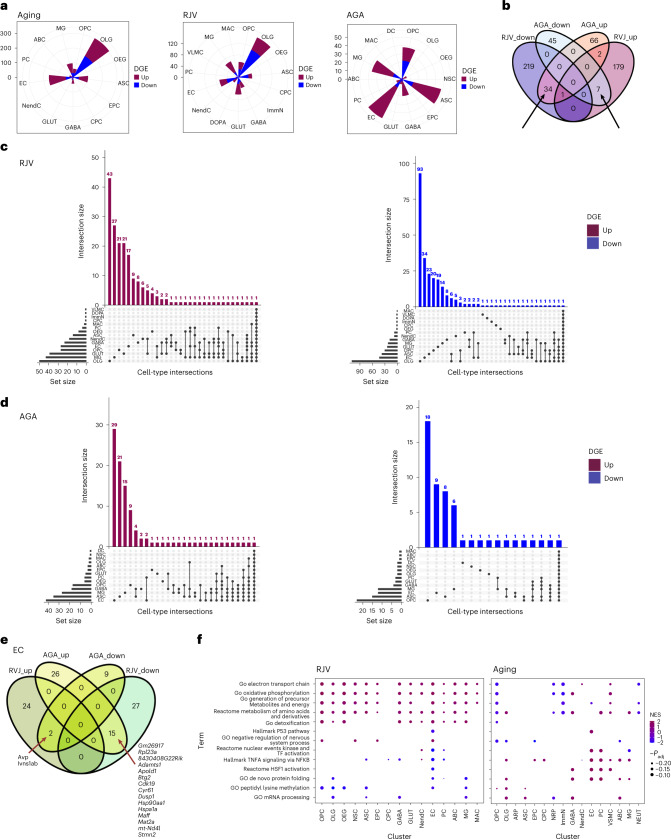
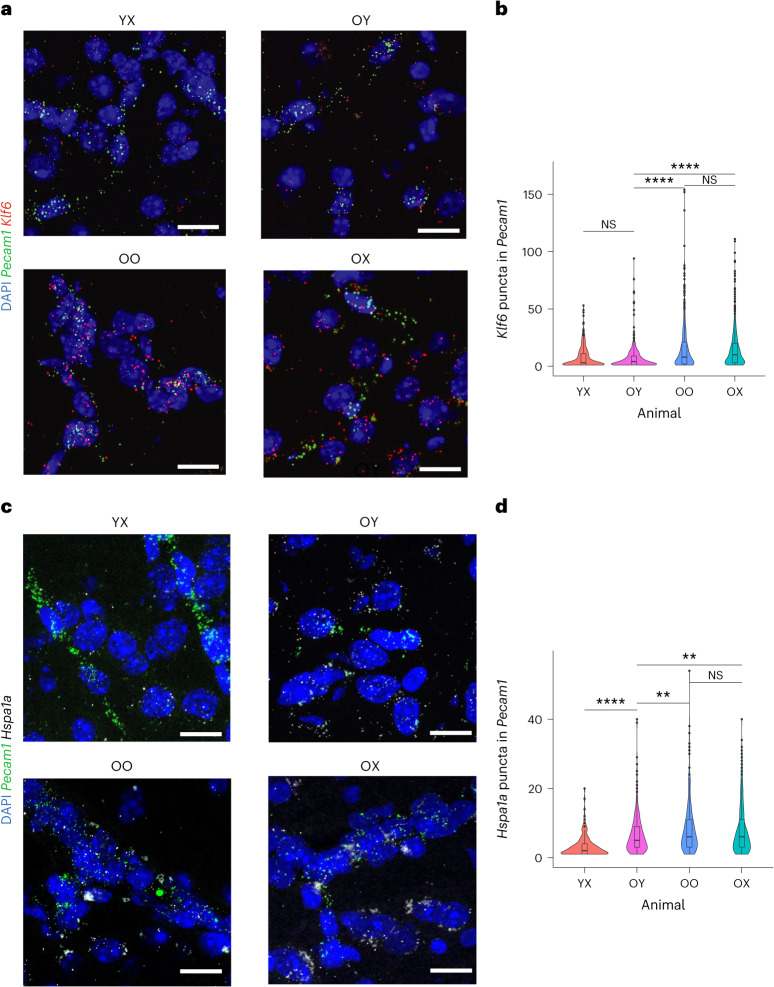
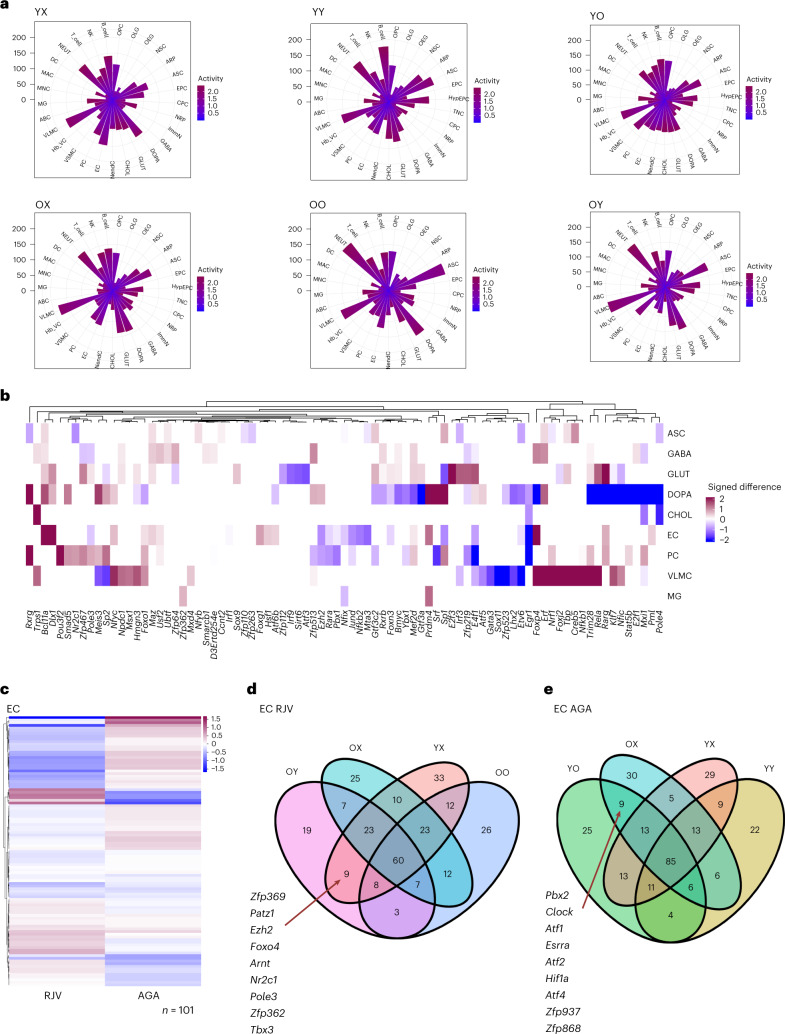
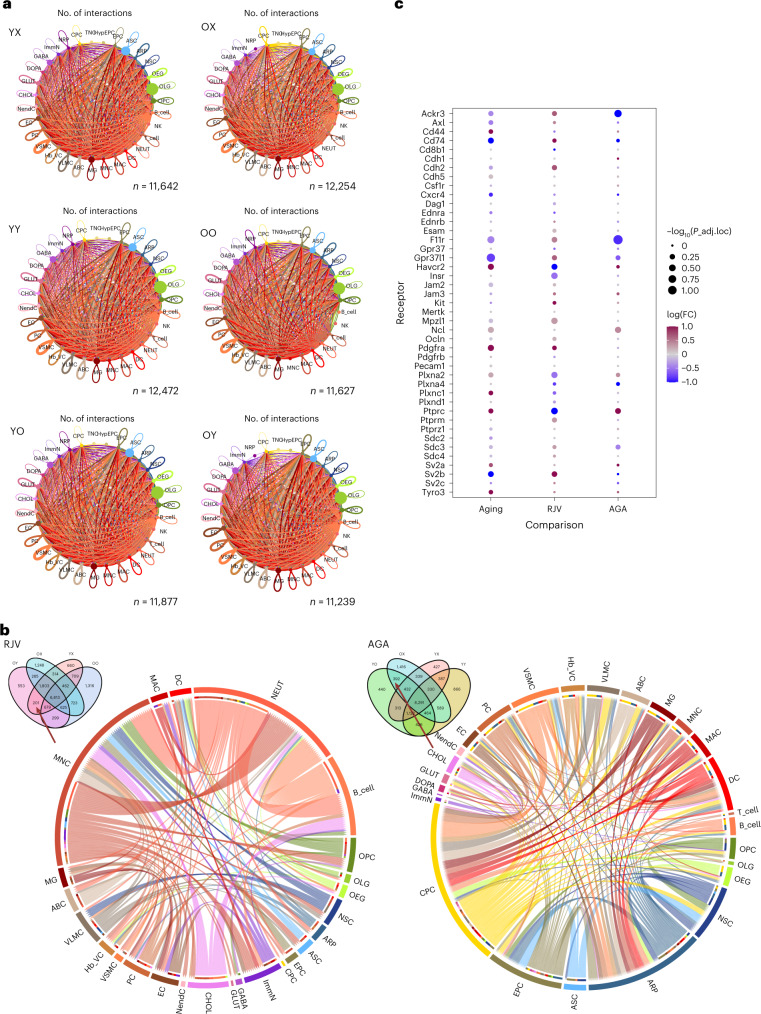
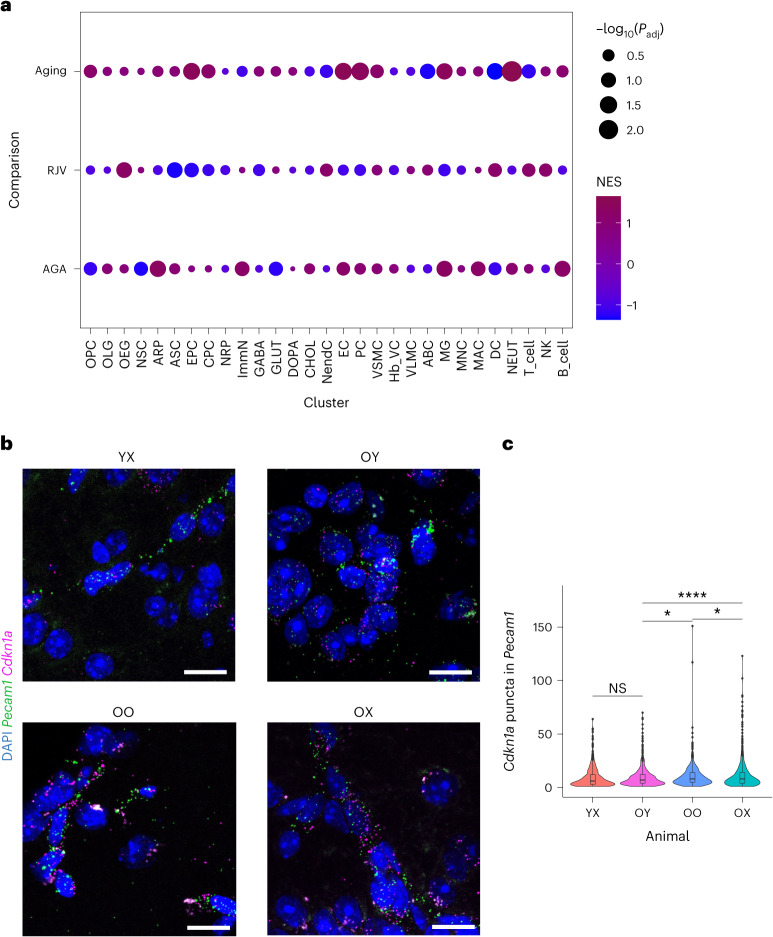
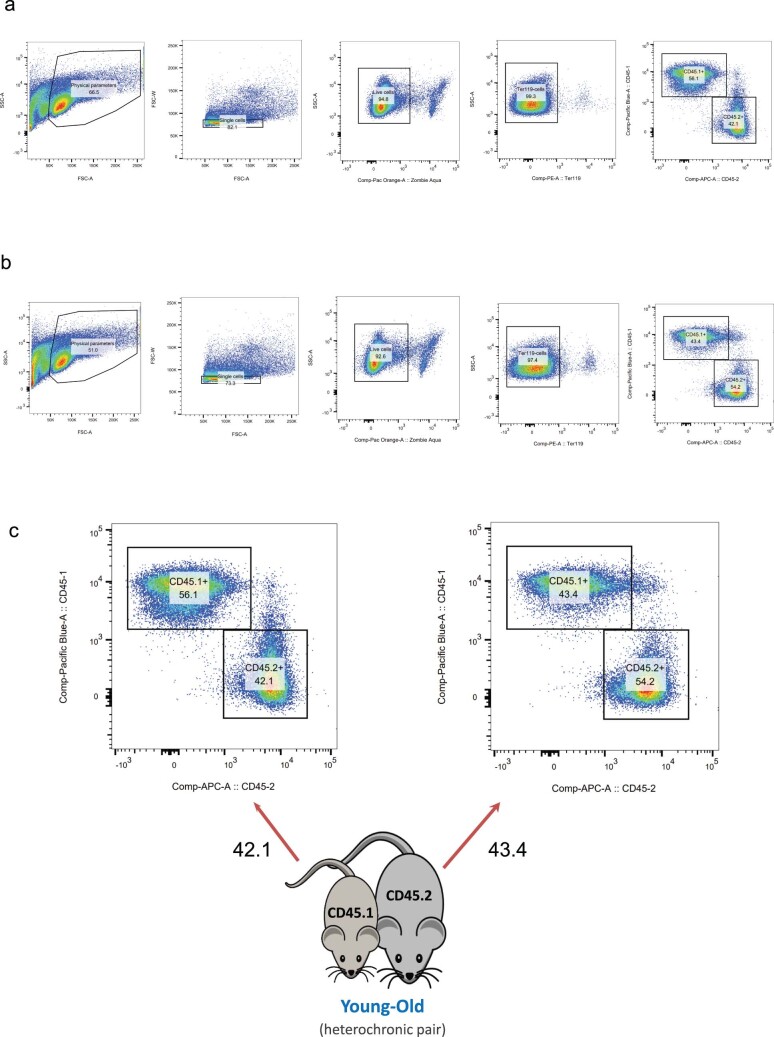
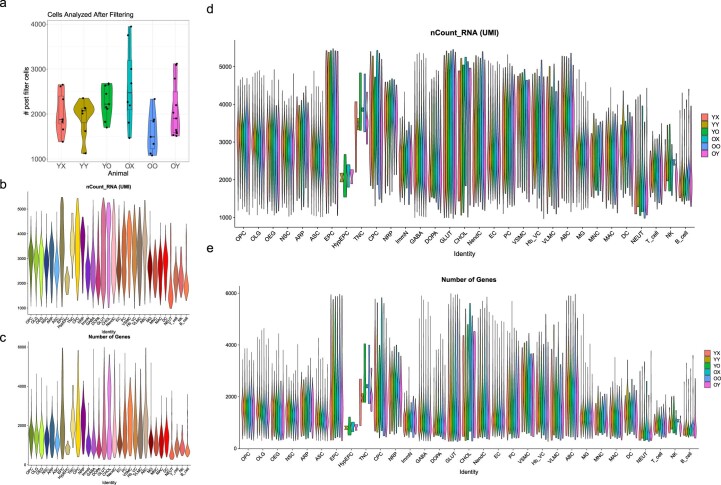
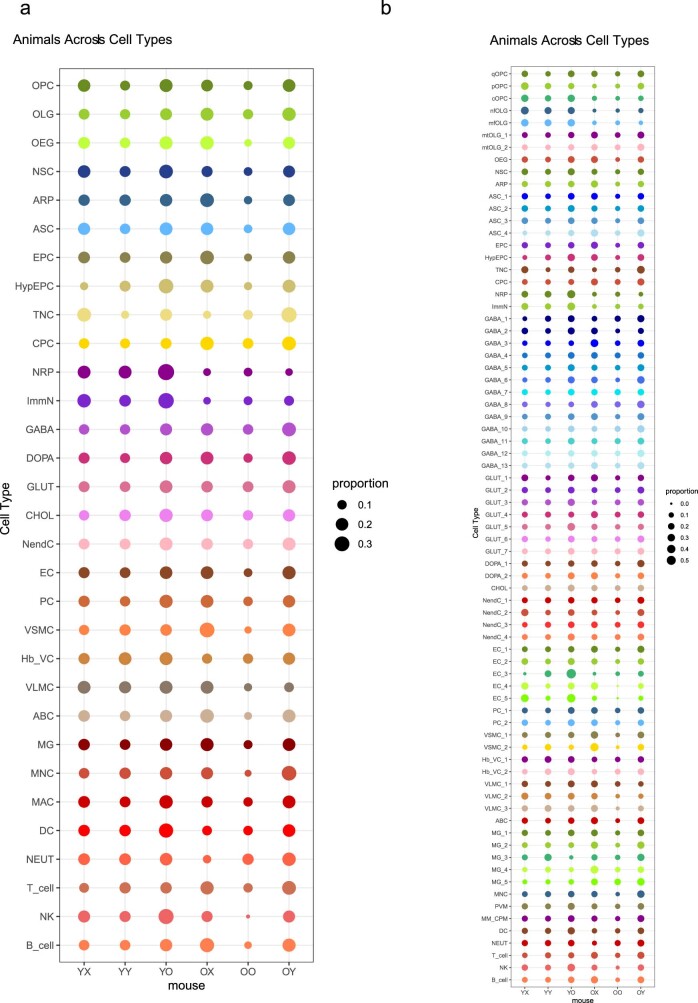
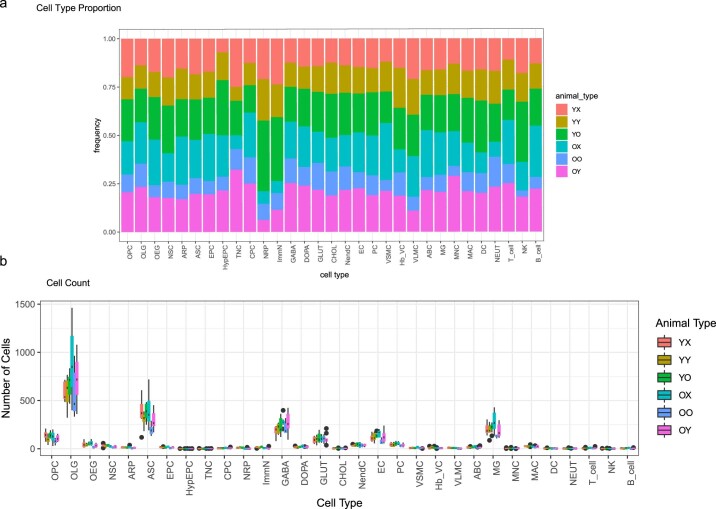
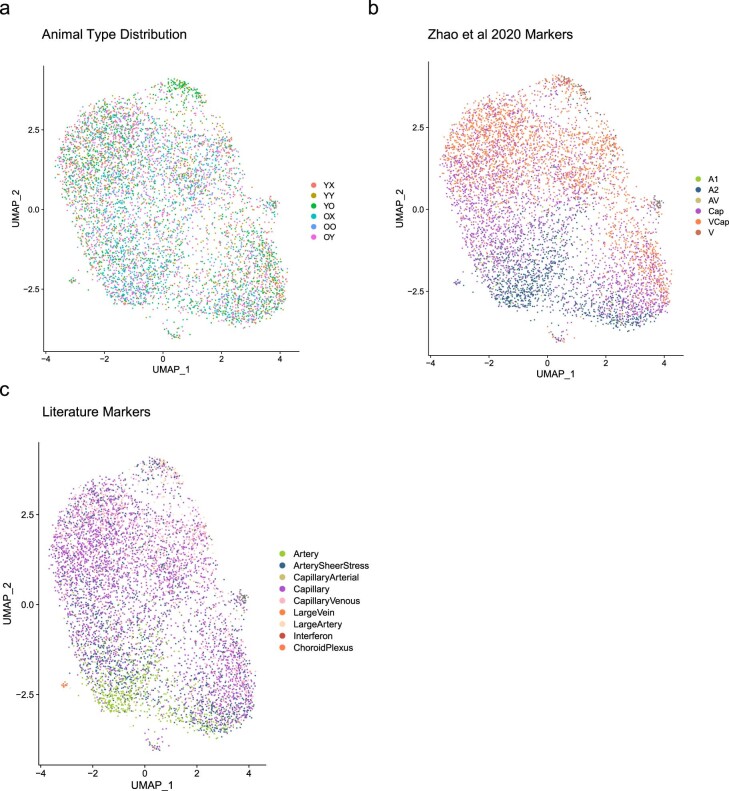
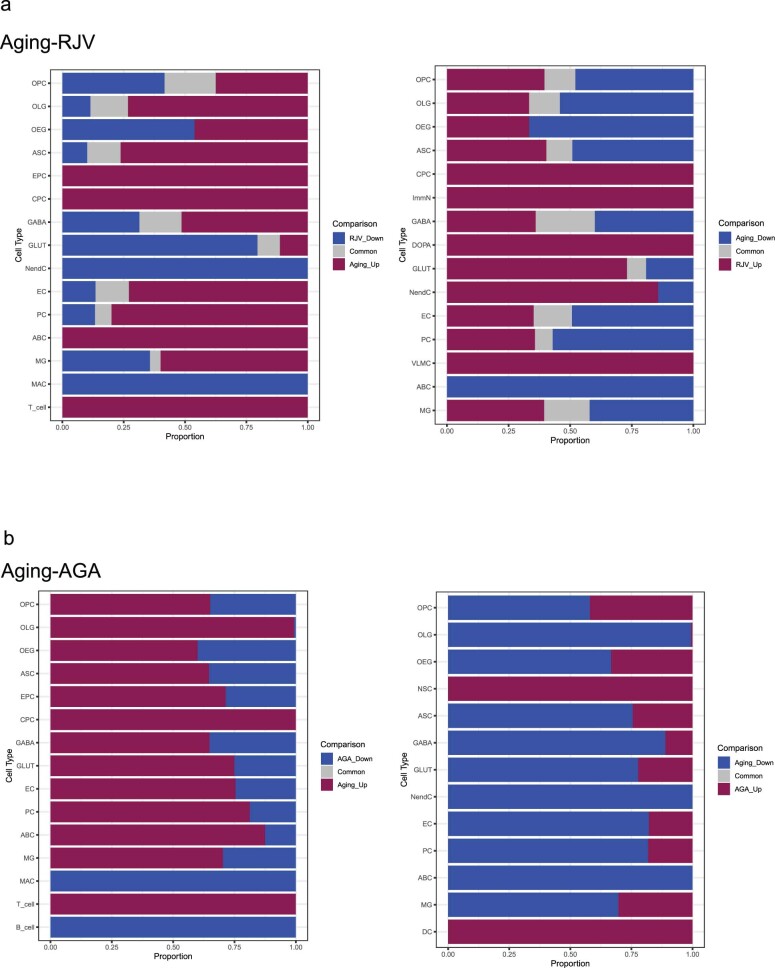
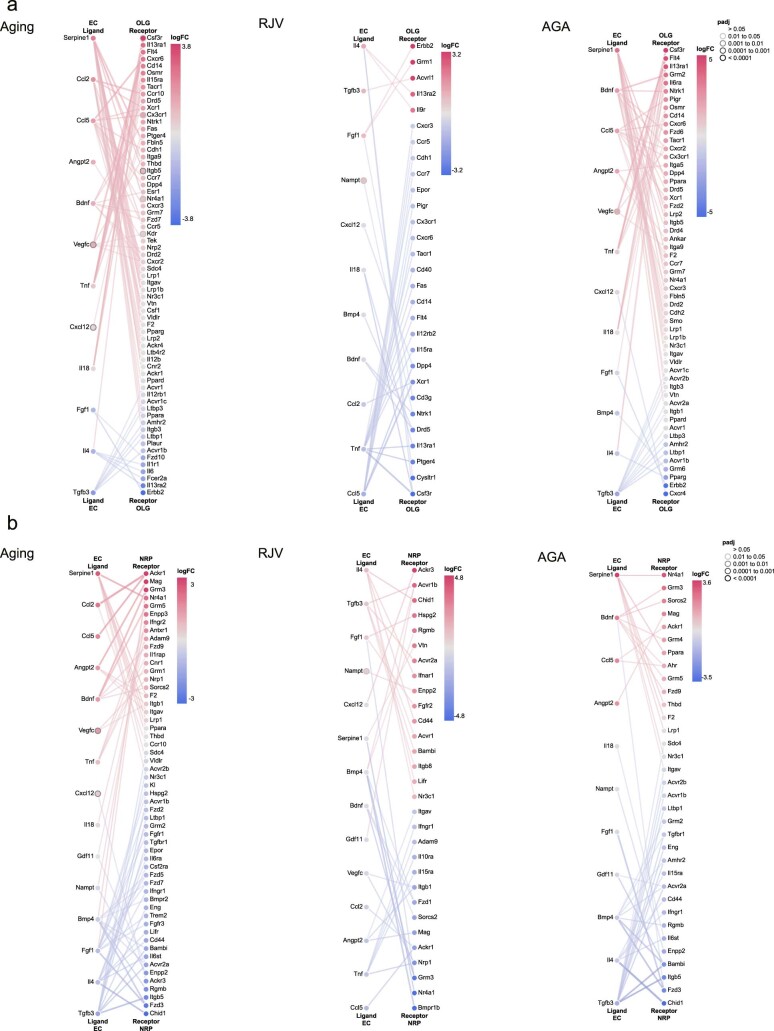
Aging is a complex process involving transcriptomic changes associated with deterioration across multiple tissues and organs, including the brain. Recent studies using heterochronic parabiosis have shown that various aspects of aging-associated decline are modifiable or even reversible. To better understand how this occurs, we performed single-cell transcriptomic profiling of young and old mouse brains after parabiosis. For each cell type, we cataloged alterations in gene expression, molecular pathways, transcriptional networks, ligand-receptor interactions and senescence status. Our analyses identified gene signatures, demonstrating that heterochronic parabiosis regulates several hallmarks of aging in a cell-type-specific manner. Brain endothelial cells were found to be especially malleable to this intervention, exhibiting dynamic transcriptional changes that affect vascular structure and function. These findings suggest new strategies for slowing deterioration and driving regeneration in the aging brain through approaches that do not rely on disease-specific mechanisms or actions of individual circulating factors.


Conflict of interest statement

L.L.R. is a founder of Elevian, Rejuveron and Vesalius Therapeutics, a member of their scientific advisory boards and a private equity shareholder. All are interested in formulating approaches intended to treat diseases of the nervous system and other tissues. He is also on the advisory board of Alkahest, a Grifols company, focused on the plasma proteome. None of these companies provided any financial support for the work in this paper. A.J.W. is a scientific advisor for Kate Therapeutics and Frequency Therapeutics, and is a founder of Elevian, Inc. and a member of their scientific advisory board and shareholder. Elevian, Inc. also provides sponsored research to the Wagers lab. A.R. is a founder and equity holder of Celsius Therapeutics, an equity holder in Immunitas Therapeutics and until 31 August 2020 was a SAB member of Syros Pharmaceuticals, Neogene Therapeutics, Asimov and Thermo Fisher Scientific. From 1 August 2020, A.R. has been an employee of Genentech, a member of the Roche Group. M.X. has been an employee of Merck & Co. since August 2020. The remaining authors declare no competing interests.

Figures

Fig. 1
Fig. 1. Overview of the single-cell sequencing analysis.
a, Schematic representation of the animal types used in the present study. Sequencing data from isochronic (YY and OO) and heterochronic (YO and OY) parabiosis pairs were generated and integrated with sequencing data from young (YX) and old (OX) unpaired mice from our previous work which were generated simultaneously with those of the parabionts. b, Schematic representation of the experimental workflow (see Methods for details). c, UMAP projection of 105,329 cells across 31 clusters derived from 34 parabionts (7 YY, 9 YO, 7 OO and 11 OY) and 16 unpaired animals (8 YX and 8 OX). For the cell-type abbreviations please see the text and Methods (Supplementary Table 1). d, UMAP projection of five major cell populations showing the expression of representative, well-known, cell-type-specific marker genes (OLGs: Cldn11; ASCs: Gja1; NEUR: Syt1; ECs: Cldn5; MGs: Tmem119). The numbers reflect the number of nCount RNA (UMI) detected for the specified gene for each cell. e, Violin plot showing the distribution of expression levels of well-known, representative, cell-type-enriched, marker genes across all 31 distinct cell types. f,g, Boxplot showing the distribution over n = 50 biologically independent animals of the number of detected cells per cell type (f) or number of detected genes per cell type (g). Boxplot minimum is the smallest value within 1.5× the interquartile range (IQR) below the 25th percentile and maximum is the largest value within 1.5× the IQR above the 75th percentile. Boxplot center is the 50th percentile (median) and box bounds are the 25th and 75th percentiles. Outliers are >1.5× and <3× the IQR. Panel b was created with BioRender.com.
Fig. 2
Fig. 2. Characterization of cell types and subpopulations.
ae, Subpopulation analysis of cell types grouped in five distinct cell classes: OLG lineage and OEGs (n = 41,873 cells) (a), astroependymal cells and NSCs (n = 19,520 cells) (b), neuronal lineage (n = 20,869 cells) (c), vasculature cells (n = 10,438 cells) (d) and immune cells (n = 12,629 cells) (e). q, quiescent; p, proliferating; c, committed, nf, newly formed; mf, myelin-formin; mt, mature. f, UMAP subpopulation analysis of EC clusters (n = 6,218 cells). g, UMAP subpopulation of EC clusters, stratified by animal type. h, Violin plot of delineating markers of ECs, as Cldn5, Slc1a3, Lrg1, Omp and Plvap. i, UMAP overlay of EC zonation markers along the arteriovenous axis curated from the literature. Markers in left-to-right order: large arteries: Fbln5; arterial: Gkn3; capillary–arterial: Tgfb2; capillary: Mfsd2a; capillary: Cxcl12; capillary–venous: Car4; venous: Slc38a6; large veins: Lcn2; and large vessels: Vcam1.
Fig. 3
Fig. 3. DGE across major cell types revealed RJV DGEs and aging AGA genes.
af, An FDR ≤ 0.05 was used to identify significant DGE genes, with n denoting the total number of genes meeting this threshold. The RJV framework depicts normalized gene expression changes across YX, OY, OO and OX. The AGA framework depicts normalized gene expression changes across OX, YO, YY and YX. DGE genes are log2(z-scored) scaled across rows (all animals) and are ordered by descending log(FC), with OLGs (n = 156 RJV and n = 2 AGA) (a), ASCs (n = 49 RJV and n = 48 AGA) (b), GABA (n = 39 RJV and n = 20 AGA) (c), GLUT (n = 61 RJV and n = 6 AGA) (d), ECs (n = 68 RJV and n = 52 AGA) (e) and MGs (n = 63 RJV and n = 37 AGA) (f) in respective order. The color bar of the heatmap reflects the z-score, from negative (blue) to positive (magenta). The batch is denoted in the top annotation bar and animal type in the second annotation bar.
Fig. 4
Fig. 4. DGE characterization across cell types.
a, Rose diagrams (circular histograms of number of DGEs) of aging, RJV and AGA across all cell types at FDR ≤ 0.05, colored by direction of log(FC) (up magenta, down blue). b, Venn diagram of RJV and AGA DGEs across all cell types, demonstrating bidirectional log(FC) changes between the comparisons (depicted with arrows). c,d, Upset plot of FDR = 0.05 DGE with positive log(FC) (upregulation) and negative log(FC) (downregulation) in both RJV (c) and AGA (d). The top bar height reflects the number of DGEs in the intersection (in common between the barbells below), and the side bar width reflects the magnitude of the set size. e, EC RJV and AGA DGE Venn diagram split by log(FC) sign, revealing genes that reverse direction between comparisons. The arrows point to listed bidirectional genes. f, GSEA dot plots (Benjamini–Hochberg-adjusted P value for multiple comparisons (Padj) ≤ 0.25) of representative terms across cell types in RJV and aging, with the size of dot proportional to inverse Padj and color by NES from negative (blue) to positive (magenta).
Fig. 5
Fig. 5. RNA in situ hybridization assays showing aging and RJV reversal of key aging-associated genes.
a, Representative RNA images of mouse cortices showing Klf6 puncta in Pecam1+ ECs in YX, OY, OO and OX mice. Scale bars, 20 µm. b, Violin and boxplot representation of RNA quantification (n = 3 biologically independent animals) by two-tailed Welch’s t-test with no multiple comparison adjustment for significance. P values for OY–YX: 0.473 (95% confidence interval (CI) −1.588, 0.737); OY–OO: 5.328 × 10−19 (95% CI −10.260, −6.620), OY–OX: 4.900 × 10−28 (95% CI −8.881, −6.244); OO–OX: 0.349 (95% CI −0.960, 2.714). Nonsignificant (NS) P > 0.05, *P ≤ 0.05, **P ≤ 0.01, ***P ≤ 0.001, ****P ≤ 0.0001. Boxplot minimum is the smallest value within 1.5× the IQR below the 25th percentile and maximum is the largest value within 1.5× the IQR above the 75th percentile. Boxplot center is the 50th percentile (median) and box bounds are the 25th and 75th percentiles. Outliers are >1.5× and <3× the IQR. c, Representative RNA images of mouse cortices showing Hspa1a puncta in Pecam1+ ECs in YX, OY, OO and OX mice. Scale bars, 20 µm. d, Violin and boxplot representation of RNA quantification (n = 4 biologically independent animals) by two-tailed Welch’s t-test with no multiple comparison adjustment for significance. P values for OY–YX: 3.535 × 10−16 (95% CI 2.727, 4.373); OY–OO 0.008 (95% CI −2.603, −0.385); OY–OX: 0.006 (95% CI −2.177, −0.372); OO–OX: 0.686 (95% CI −0.847, 1.286). NS P > 0.05, *P ≤ 0.05, **P ≤ 0.01, ***P ≤ 0.001, ****P ≤ 0.0001. Boxplot minimum is the smallest value within 1.5× the IQR below the 25th percentile and maximum is the largest value within 1.5× the IQR above the 75th percentile. Boxplot center is the 50th percentile (median) and box bounds are the 25th and 75th percentiles. Outliers are >1.5× and <3× the IQR. Source data
Fig. 6
Fig. 6. Gene regulatory analysis reveals transcriptionally active cell types and GRN reversals between RJV and AGA.
a, Rose diagrams of GRN scores per cell type across YX, YY, YO, OX, OO and OY. The color scale from blue to magenta reflects the degree of GRN activity (Methods). b, Difference heatmap of active GRN TFs corresponding to RJV/AGA log(FC) change sign. Magnitude is the absolute magnitude of the difference, and direction is positive for upregulation in RJV (magenta) and negative for upregulation in AGA (blue). c, Heatmap of EC-active GRN TFs plotted by RJV and AGA log(FC), with upregulation magenta, downregulation blue, clustered with Euclidean distance, average linkage. d,e, Venn diagrams of EC RJV (d) and AGA (e) animal frameworks’ active GRN TFs. The arrows point to those TFs in common between OY and YX and YO and OX, respectively.
Fig. 7
Fig. 7. Cell–cell communication is affected by aging and parabiosis.
a, Summarization network graphs of the number of ligand–receptor interactions between cell types in YX, YY, YO, OX, OO and OY mice. Node size is proportional to cell population size. Edge width and transparency of color are proportional to the number of all edges between a set of nodes. b, Chord diagrams representing the informatically predicted unique source:target:receptor:ligand pairings identified only in the rejuvenation model of OY and YX (Venn diagram inset, left panel) or the aging acceleration model of YO and OX (Venn diagram inset, right panel). c, For all identified EC receptors, edgeR DGE QLF test metrics are shown for the aging, RJV and AGA paradigms. Node size is inversely proportional to the Benjamini–Hochberg-adjusted P value for multiple comparisons and node color is scaled by intensity of log(FC) from blue (negative, downregulation) to magenta (positive, upregulation).
Fig. 8
Fig. 8. Senescence status demonstrated shifts in aging and RJV.
a, Dot-plot representation of senescence-associated marker genes curated from the literature,, permuted against each cell type in aging, RJV and AGA with fast GSEA. The inverse log10(Padj) values for multiple comparisons (Benjamini–Hochberg) reflect the size of the dot and NESs reflect color from blue (negative enrichment) to magenta (positive enrichment). b, Representative RNA in situ images of mouse cortices showing Cdkn1a puncta in Pecam1+ ECs in YX, OY, OO and OX mice. Scale bars, 20 µm. c, Violin and boxplot representation of RNA quantification (n = 6 biologically independent animals) by two-tailed Welch’s t-test with no multiple comparison adjustment for significance. P values: OY–YX: 0.810 (95% CI −0.930, 1.190); OY–OO: 0.0484 (95% CI −1.670, −0.006); OY–OX: 0.0000874 (95% CI −3.063, −1.025); and OO–OX: 0.0251 (95% CI −2.260, −0.151). NS P > 0.05, *P ≤ 0.05, **P ≤ 0.01, ***P ≤ 0.001 and ****P < 0.0001. Boxplot minimum is the smallest value within 1.5× the IQR below the 25th percentile and maximum is the largest value within 1.5× the IQR above the 75th percentile. Boxplot center is the 50th percentile (median) and box bounds are the 25th and 75th percentiles. Outliers are >1.5× and <3× the IQR. Source data
Extended Data Fig. 1
Extended Data Fig. 1. Confirmation of blood chimerism.
Representative flow cytometry analysis of CD45.1 and CD45.2 expression markers on splenocytes isolated from (a) young (CD45.1+) and (b) old mice (CD45.2+) following heterochronic parabiosis. c) The percentage of donor-derived blood cells from one partner in the spleen of the other partner is depicted by arrows.
Extended Data Fig. 2
Extended Data Fig. 2. Sample metrics.
Profiling of animals and their derived brain cells used for sequencing, before (N = 56) (a,c,e) and after (n = 50) (b,d,f) quality control filtering in which certain animals were omitted (see Methods). Boxplot minimum is the smallest value within 1.5 times the interquartile range below the 25th percentile, maximum is the largest value within 1.5 times the interquartile range above the 75th percentile. Boxplot center is the 50th percentile (median), box bounds are the 25th and 75th percentile. Outliers are >1.5 times and < 3 times the interquartile range. a-b. Age of mice in weeks prior to parabiosis surgeries. c-d. Number of days joined across parabiotic pairs. e-f. Number of dissociated cells analyzed per brain across all animal types.
Extended Data Fig. 3
Extended Data Fig. 3. Sequencing metrics.
Violin plots with boxplots showing sequencing metrics of the distribution of animals from all sequenced animal types. Each dot represents one animal. Boxplot minimum is the smallest value within 1.5 times the interquartile range below the 25th percentile, maximum is the largest value within 1.5 times the interquartile range above the 75th percentile. Boxplot center is the 50th percentile (median), box bounds are the 25th and 75th percentile. Outliers are >1.5 times and < 3 times the interquartile range. a. Number of cells sequenced by animal. b. Table of total number of animals and cells analyzed. c. Mean number of mapped reads per cell by animal. d. Median number of nCount RNA (UMI) detected per cell by animal. e. Median number of genes detected per cell by animal. f. Percent of sequencing saturation by animal.
Extended Data Fig. 4
Extended Data Fig. 4. Distribution of 50 animals across 5 sequencing batches, with respect to cell clusters, and cell count.
a. UMAP projection of color-coded batches over clusters that passed filtering criteria. b. Frequency of each color-coded batch representation in each cell type. All cell types are represented by cells from all batches, except for HypEPC in batch 5, probably due to its small size. c. Number of detected cells in each cell type.
Extended Data Fig. 5
Extended Data Fig. 5. Primary data analysis.
a. Violin plot and boxplot showing the number of cells analyzed by animal after cell filtering, in which all cells were successfully assigned to a specific cell type. Each dot represents one animal. Boxplot minimum is the smallest value within 1.5 times the interquartile range below the 25th percentile, maximum is the largest value within 1.5 times the interquartile range above the 75th percentile. Boxplot center is the 50th percentile (median), box bounds are the 25th and 75th percentile. b-e. Violin plots showing QC metrics, plots in (b, c) showing aggregated data of cells of all brain types, while plots in (d, e) showing individual cell data separated by animal type: (b, d) showing nCount RNA (UMI) per cell type. (c, e) showing nFeature RNA (number of unique genes) detected per cell.
Extended Data Fig. 6
Extended Data Fig. 6. Representation of each animal type’s distribution within each cell type.
a. Dot plot representation of each cell type’s representation by each animal type. Size of the dot is proportional to the number of cells contributed by each animal type within a cell type. b. Dot plot representation of each subpopulation’s representation by each animal type. Size of the dot is proportional to the number of cells contributed by each animal type within a subpopulation.
Extended Data Fig. 7
Extended Data Fig. 7. Cell type composition and cell count from each animal type.
a. Frequency bar plot demonstrating composition of each cell type with respect to animal type. b. Boxplot of raw cell counts with respect to each animal. All animals contribute to all cell types. ANOVA p-values (one-tailed) for pairwise iterations can be found in Supplementary Table 2. The only comparisons with unadjusted p-values < 0.05 are: OOvOX: DC (p = 0.041), YOvYX DOPA (p = 0.022), YYvYX OEG (p = 0.046), ImmN (p = 0.045), and PC (p = 0.016), Boxplot minimum is the smallest value within 1.5 times the interquartile range below the 25th percentile, maximum is the largest value within 1.5 times the interquartile range above the 75th percentile. Boxplot center is the 50th percentile (median), box bounds are the 25th and 75th percentile. Outliers are >1.5 times and < 3 times the interquartile range.
Extended Data Fig. 8
Extended Data Fig. 8. Animal type distribution and machine learning approaches to explore EC arteriovenous zonation.
a. Animal type cell distribution across EC subclusters. b-c. Probabilistic programming cell class assignment using EC marker genes described by Zhao et al 2020 (b) and others (c).
Extended Data Fig. 9
Extended Data Fig. 9. Composition of DGEs per cell type between Aging-RJV, and Aging-AGA.
a. Bar graph of each cell type’s total FDR ≤ 0.05 DGEs split by logFC direction. The proportion of DGEs reflecting Aging and RJV is depicted, as well as the fraction of overlapping signatures (intersection in grey). b. Bar graph of each cell type’s total FDR ≤ 0.05 DGEs split by logFC direction. The proportion of DGEs reflecting Aging and AGA is depicted, as well as the fraction of overlapping signatures (intersection in grey).
Extended Data Fig. 10
Extended Data Fig. 10. Intercellular communication networks between EC-OLG and EC-NRP revealed aging-related interactions that were modified by heterochronic parabiosis.
Canonical EC ligands and their cognate receptors in OLG (a) or in NRP (b) are shown in each paradigm (Aging, RJV, AGA). In all panels of ligand-receptor interactions, node color represents the magnitude of the DGE (logFC as estimated by DGE) such that the most significantly up-regulated genes are in magenta, and the downregulated genes are in blue. Node borders indicate multiple testing corrected Benjamini-Hochberg FDR for statistical significance of DGE as calculated by edgeR. Edge color represents the sum of scaled differential expression magnitudes from each contributing node, while width and transparency are determined by the magnitude of the scaled differential expression (see details in the Methods section).

References

    1. Lopez-Otin, C., Blasco, M. A., Partridge, L., Serrano, M. & Kroemer, G. Hallmarks of aging: an expanding universe. Cell10.1016/j.cell.2022.11.001 (2022). - PubMed
    1. Burke, S. N. & Barnes, C. A. Neural plasticity in the ageing brain. Nat. Rev. Neurosci.7, 30–40 (2006). - PubMed
    1. Mattson, M. P. & Arumugam, T. V. Hallmarks of brain aging: adaptive and pathological modification by metabolic states. Cell Metab.27, 1176–1199 (2018). - PMC - PubMed
    1. Navarro, A., Gomez, C., Lopez-Cepero, J. M. & Boveris, A. Beneficial effects of moderate exercise on mice aging: survival, behavior, oxidative stress, and mitochondrial electron transfer. Am. J. Physiol. Regul. Integr. Comp. Physiol.286, R505–R511 (2004). - PubMed
    1. Brett, J. O. et al. Exercise rejuvenates quiescent skeletal muscle stem cells in old mice through restoration of cyclin D1. Nat. Metab.2, 307–317 (2020). - PMC - PubMed

Publication types