. 2022 Jun;2(6):526-535.
doi: 10.1038/s43587-022-00204-0. Epub 2022 Apr 25.

Biomarker modeling of Alzheimer's disease using PET-based Braak staging

Affiliations

Biomarker modeling of Alzheimer's disease using PET-based Braak staging

Joseph Therriault et al. Nat Aging. 2022 Jun.

Abstract

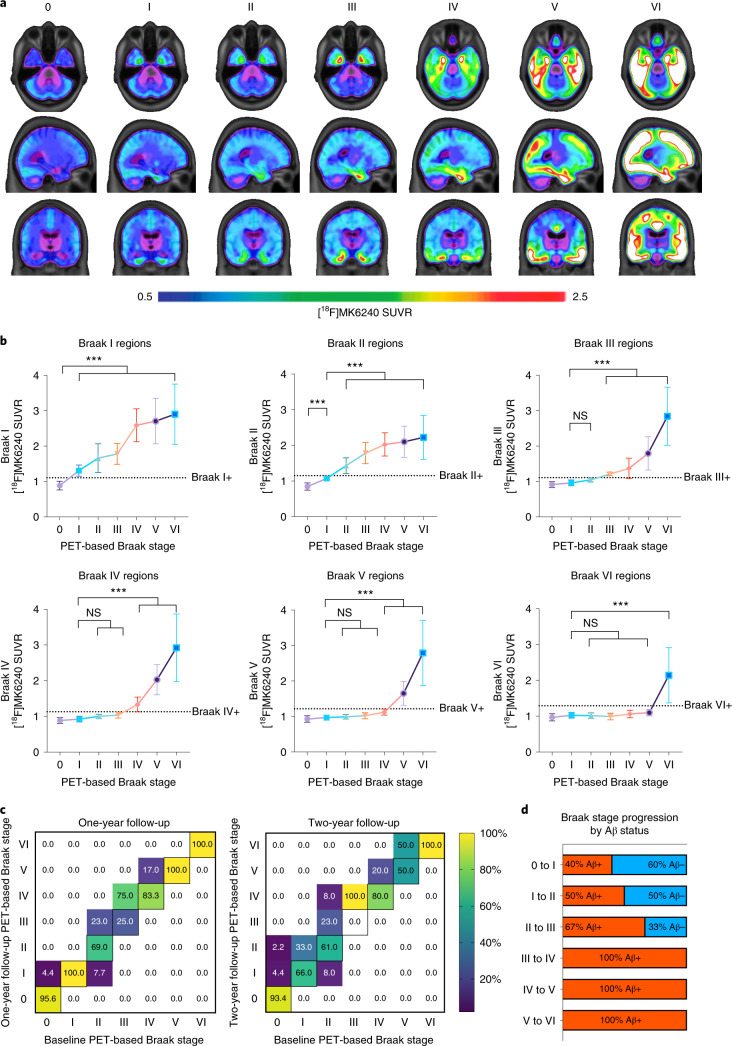
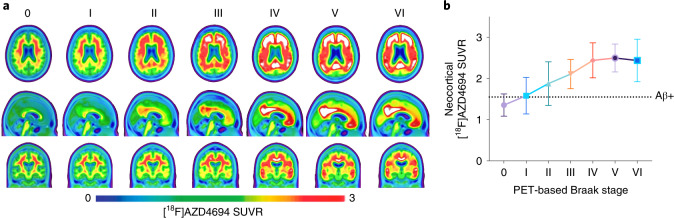
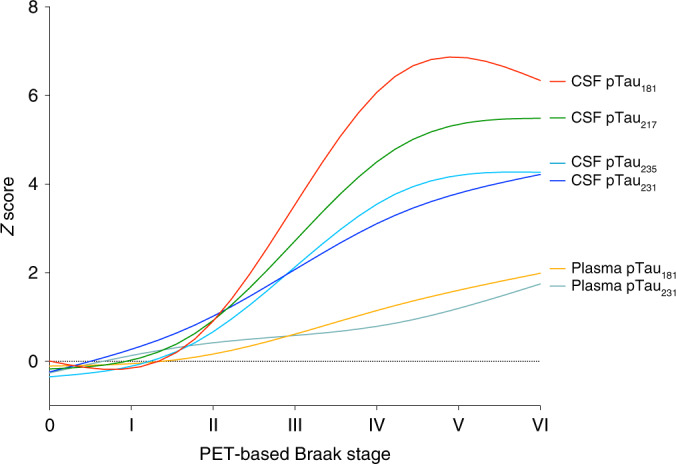
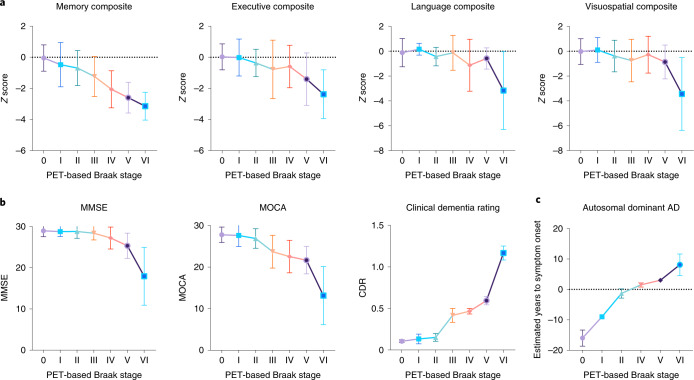
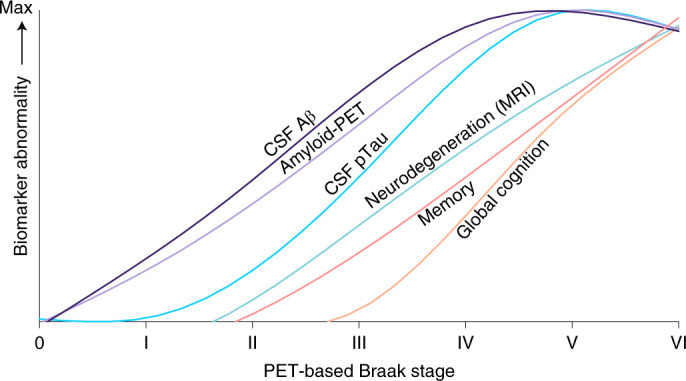
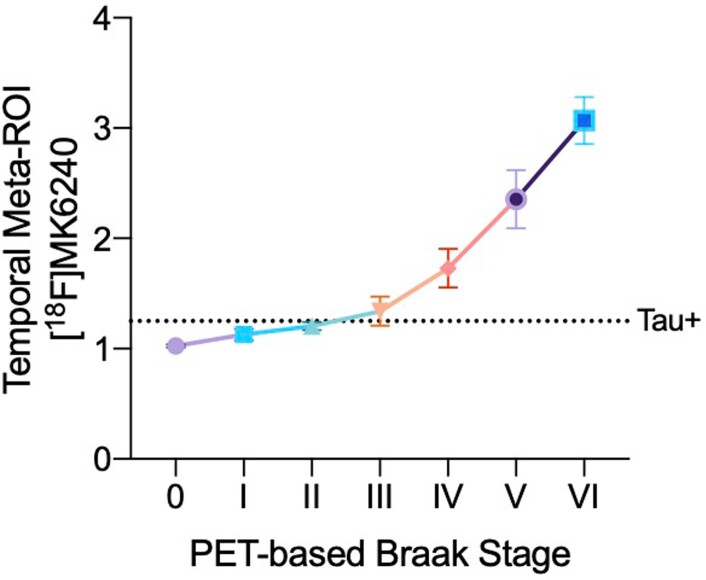
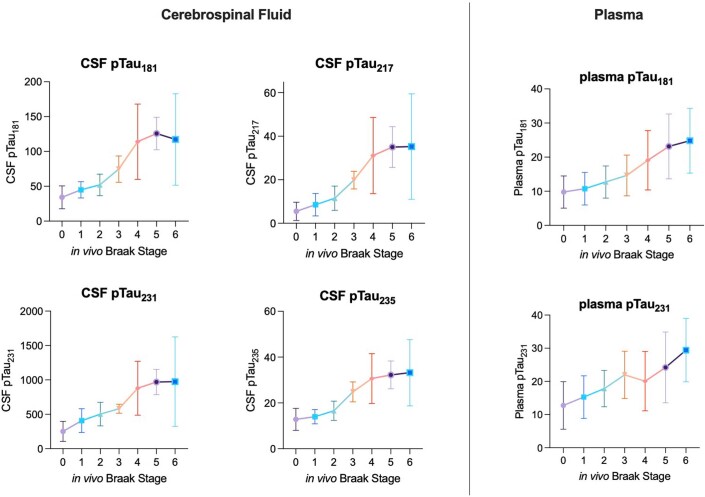
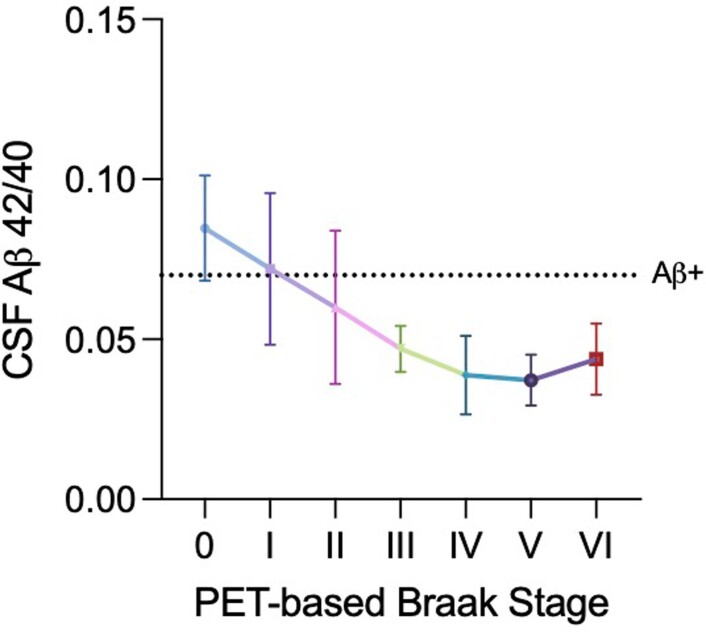
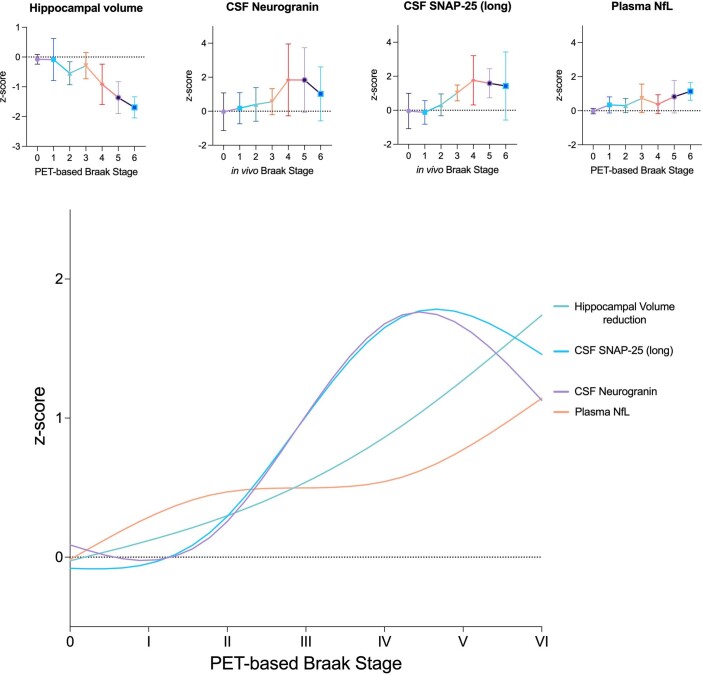
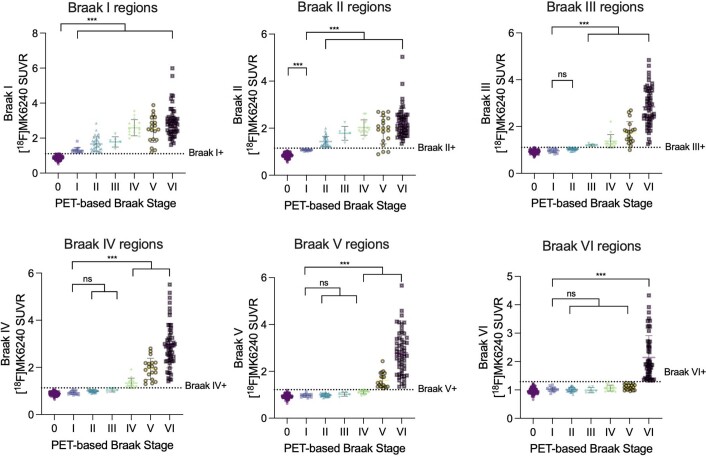
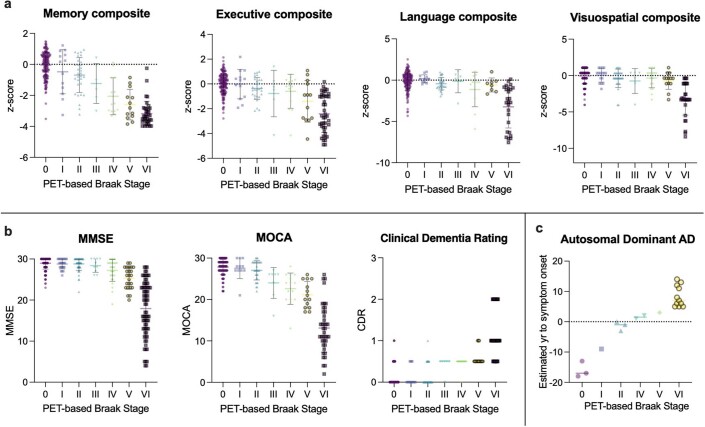
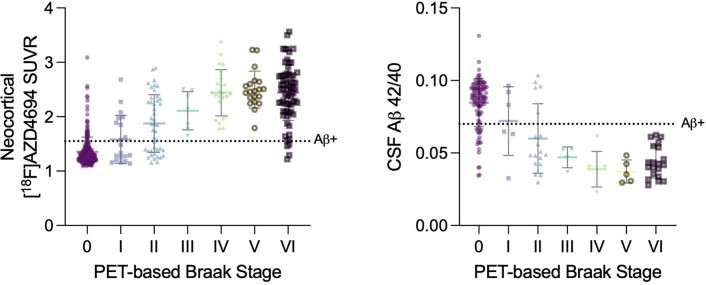
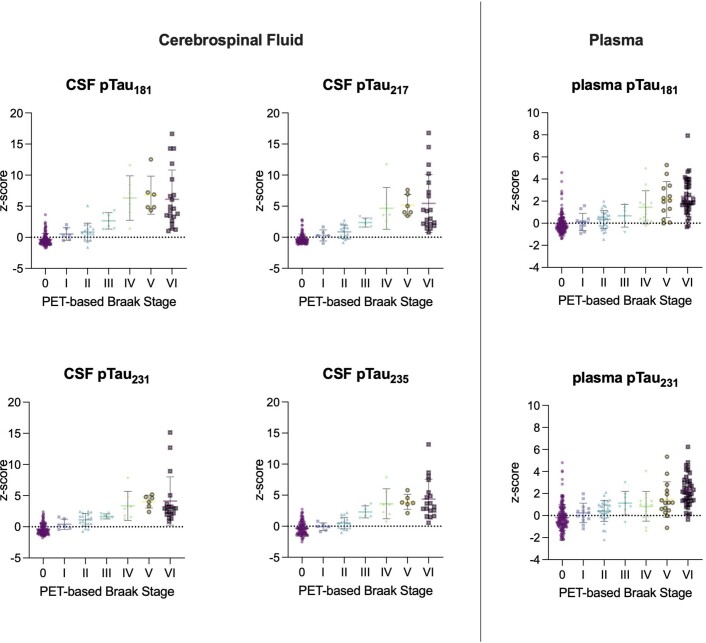
Gold-standard diagnosis of Alzheimer's disease (AD) relies on histopathological staging systems. Using the topographical information from [18F]MK6240 tau positron-emission tomography (PET), we applied the Braak tau staging system to 324 living individuals. We used PET-based Braak stage to model the trajectories of amyloid-β, phosphorylated tau (pTau) in cerebrospinal fluid (pTau181, pTau217, pTau231 and pTau235) and plasma (pTau181 and pTau231), neurodegeneration and cognitive symptoms. We identified nonlinear AD biomarker trajectories corresponding to the spatial extent of tau-PET, with modest biomarker changes detectable by Braak stage II and significant changes occurring at stages III-IV, followed by plateaus. Early Braak stages were associated with isolated memory impairment, whereas Braak stages V-VI were incompatible with normal cognition. In 159 individuals with follow-up tau-PET, progression beyond stage III took place uniquely in the presence of amyloid-β positivity. Our findings support PET-based Braak staging as a framework to model the natural history of AD and monitor AD severity in living humans.


Conflict of interest statement

The authors declare no competing interests.

Figures

Fig. 1
Fig. 1. PET-based Braak staging captures variability in magnitude and topography of pathological tau.
a, Average [18F]MK6240 SUVRs across the whole brain for all participants grouped according to PET-based Braak stage. Individuals at stage 0 did not have detectable tau abnormality in regions comprising any Braak stage. At stage I, tau abnormality is confined to the transentorhinal cortex. Braak stages V and VI are characterized by high magnitude of tau pathology, with stage VI extending to primary sensory cortices. b, Regional accumulation of tau-PET conforms to hierarchical histopathological tau staging model. Higher levels of tau-PET SUVR in the transentorhinal cortices are observed at all subsequent stages (family-wise error (FWE)-corrected P < 0.001 for all). In the entorhinal and hippocampal cortices (Braak II regions), tau-PET is abnormal only in individuals assigned to PET-based Braak stage II and above and increased with advancing PET-based Braak stage. Overall, cortical regions remain largely spared until the corresponding Braak stage is reached. Only individuals assigned to stage VI had statistically different tau-PET SUVR in regions comprising Braak VI. Dashed lines represent stage-specific cutoffs for tau-PET in each Braak stage. Group means are represented by shapes, and error bars represent standard deviation. Stage I is represented by the purple circle, stage II is represented by the blue square, stage III is represented by the green triangle, stage IV is represented by the orange inverted triangle, stage V is represented by the hollow purple circle and stage VI is represented by the hollow blue square. Successive Braak stages are connected by a solid line, which carries the color of the previous stage. ***P < 0.001; two-sided analysis of variance (ANOVA) corrected for multiple comparisons using Dunnett’s correction (n = 324). c, Longitudinal stability and progression of Braak stage. Percentages along the diagonal indicate proportion of individuals at each Braak stage who did not change Braak stage over the follow-up period. Deviations from the diagonal indicate a change in Braak stage; percentages above the diagonal midline indicate Braak stage progression, and percentages below the diagonal midline likely represent misclassifications. d, Stage-specific associations between amyloid-β positivity and PET-based Braak stage progression. Aβ, amyloid-β; NS, not significant.
Fig. 2
Fig. 2. Amyloid-PET evolution with respect to Braak stage.
a, Average [18F]AZD4694 amyloid-PET SUVRs across the whole brain grouped according to PET-based tau Braak stage. Each set of images represents the average amyloid-PET of individuals grouped according to their tau-PET scan. b, Neocortical amyloid-PET uptake increases and then plateaus with advancing Braak stage. The dashed line indicates a previously validated threshold for amyloid-PET positivity. Individuals at PET-based Braak stage 0 were often amyloid-β negative. Neocortical amyloid-PET SUVRs were higher at PET-based Braak stages I and II, although both stages were compatible with amyloid-β positivity and amyloid-β negativity. Individuals at Braak stage III and higher were almost exclusively amyloid-β positive. From Braak stage IV onwards, a plateau of amyloid-PET uptake was observed. Group means are represented by shapes, and error bars represent s.d. Summary statistics for all amyloid-PET comparisons are reported in Supplementary Table 2; two-sided ANOVA with Dunnett’s correction for multiple comparisons (n = 324).
Fig. 3
Fig. 3. PET-based Braak stages reflect the evolution of soluble pTau species.
Measures of four soluble pTau epitopes demonstrate differential evolution with respect to PET-based Braak stage. Magnitude of CSF pTau changes mirror the spatial extent of neurofibrillary tangle pathology. At Braak stage I, when tau abnormality is confined to the transentorhinal cortex, there are no statistically significant differences in any CSF or plasma pTau measures with individuals who are at Braak stage 0. At Braak stage II, small differences in the concentrations of CSF pTau231, pTau217, pTau235 and pTau181 are present. Starting at Braak stage III, when abnormal tau begins to accumulate outside the medial temporal lobe, CSF measures of pTau epitopes begin to show substantial increases. Larger differences in the magnitude of CSF pTau231 were observed at earlier stages, whereas larger differences in CSF pTau181 were observed at later stages. In contrast of CSF measurements, plasma measures of pTau show more modest increases across Braak stages, with plasma pTau231 becoming abnormal before plasma pTau181. The magnitude of pTau181 abnormality was largest at PET-based Braak stages IV–VI. CSF pTau measures exhibited plateaus at late Braak stages, whereas plasma pTau measures continued to increase. Curves were fit with locally estimated scatterplot smoothing (LOESS) regression. Summary statistics for all pTau comparisons are reported in Supplementary Table 3. Biomarker curves with 95% confidence intervals are displayed in Extended Data Fig. 3.
Fig. 4
Fig. 4. Early Braak stages are associated with isolated memory dysfunction and late Braak stages are associated with dementia severity.
a, Memory, executive, language and visuospatial composite Z scores according to PET-based Braak stage (n = 291 individuals with neuropsychological evaluation available). Memory function begins to decline at Braak stage II, while other cognitive domains remain unaffected. Memory continued to decline with increasing Braak stage. Language and visuospatial domains remain relatively spared until late Braak stages. b, Summary cognitive assessments according to PET-based Braak stage. Little change in MMSE scores were observed from Braak stages 0 to III. Steeper declines in MMSE score were observed at Braak stages V and VI. Changes in MOCA score were detectable by stage IV. Braak stages 0–II were largely compatible with the absence of dementia as assessed by the CDR. Braak stages III and IV consisted almost exclusively of individuals with CDR = 0.5 (very mild dementia). Braak stage V and VI were incompatible with normal cognition, with Braak stage VI being associated with increased dementia severity (n = 324 with summary cognitive assessments). c, In a subsample of individuals with autosomal dominant AD (PSEN1 mutation carriers; n = 14, total of 21 tau-PET scans including follow-ups), PET-based Braak stage was associated with estimated years to the onset of symptoms. Shapes indicate means, and error bars indicate s.d. Summary statistics for all cognitive outcome comparisons are reported in Supplementary Table 6. Statistics were conducted with two-sided ANOVA using Dunnett’s correction for multiple comparisons. PSEN1, Presenilin-1.
Fig. 5
Fig. 5. AD biomarker abnormalities in relation to the topography of cerebral tau pathology.
Summary of data-driven AD biomarker abnormalities from the perspective of PET-based Braak staging. Trajectories of scaled biomarker data are fitted with LOESS regression. In this conceptual framework, the x axis represents Braak stage and not time. Therefore, unlike other AD biomarker models, the x axis is not indented to represent the linear temporal evolution of AD and instead displays multiple AD pathophysiological changes in relation to the spatial distribution of tau pathology measured with tau-PET. Similar to other models, biomarker curves represent group-level biomarker changes, and individual-level variability is expected (i.e., Braak stages I and II were compatible with both amyloid-β positivity and negativity at the individual level). However, even in the tau-centric framework, detectable CSF and PET continuous measures of amyloid-β preceded elevated pTau concentrations measured in CSF. CSF pTau abnormality accelerated dramatically between Braak stages III and VI. Neurodegeneration indexed by hippocampal volume was closely followed by memory dysfunction. Dysfunction in global cognition rose slightly around stages III–VI and more dramatically at stages V–VI. PET-based Braak staging also provides a framework for testing new biomarkers.
Extended Data Fig. 1
Extended Data Fig. 1. Tau-PET summary measures increase with respect to PET-based Braak stage.
Tau-PET in the temporal meta-ROI increases nonlinearly with advancing Braak stage (p < 0.0001; ANOVA two-sided ANOVA corrected for multiple comparisons using Dunnett’s correction; n = 324 individuals). The dashed line indicates a previously validated threshold for tau positivity using the temporal meta-ROI. This tau positivity threshold is located between the group-level means of Braak stages II and III, supporting the notion that tau positivity is associated with tau spread outside the medial temporal lobe. Group means are represented by shapes, error bars represent standard deviation.
Extended Data Fig. 2
Extended Data Fig. 2. Atypical clinical phenotypes of AD are largely compatible with Braak staging model.
Top: proportion of cases with established focal cortical presentations of AD that fit (turquoise) and do not fit (purple) with the Braak staging system. Middle: Tau-PET images of representative Braak-discordant cases are displayed in the middle. Bottom: [18F]MK6240 Tau-PET uptake in each Braak stage of discordant case presented. Absence of tau abnormality in Braak stage II (entorhinal cortex and hippocampus) was the most common reason for Braak discordance in atypical focal cortical presentations of AD, and may be associated with MTL-sparing AD. Relative tau-PET uptake within certain Braak stages may be associated with relative predominance of specific cognitive impairment and clinical presentation. Individuals with nonamnestic dementia phenotypes were included in the main analyses. The individual focal cortical syndrome cases displayed above were classified as Braak stage V.
Extended Data Fig. 3
Extended Data Fig. 3. Phosphorylated tau species curves displayed with 95% Confidence Intervals.
Left: CSF biomarkers of pTau epitopes increase with respect to PET-based Braak stages. For all CSF pTau epitopes, modest differences were observed at early Braak stages, likely reflecting the fact that only subtle pathological changes are occurring in the cerebral cortex. No differences were observed between stages V and VI for any CSF pTau measures (n = 189 individuals with lumbar punctures). Right: Plasma biomarkers of pTau181 and pTau231 increase with advancing PET-based Braak stage. Despite stepwise increases at the group level, large within-stage variability exists for each fluid pTau biomarker in each Braak stage. Means are represented by shapes and error bars indicate 95% CIs (n = 292 individuals with plasma pTau assessments).
Extended Data Fig. 4
Extended Data Fig. 4. Braak stages evolve with respect to CSF amyloid-β concentrations.
Means are represented by shapes and error bars indicate standard deviation. Dashed line represents a previously validated threshold for amyloid positivity. Similar to amyloid-PET data, most individuals at Braak stage 0 were amyloid negative. PET-based Braak stages I and II were compatible with both amyloid positivity and negativity. A higher proportion of individuals were CSF amyloid-positive at stage II and were amyloid-PET positive at stage II. A plateau of amyloid abnormality was observed at late Braak stages. 189 individuals had CSF measurements available.
Extended Data Fig. 5
Extended Data Fig. 5. PET-based Braak stage is associated with imaging, CSF and plasma measures of neurodegeneration.
Top: Individual neurodegeneration biomarkers represented with 95% Confidence Intervals. MRI-measured hippocampal volume (adjusted for intracranial volume) increased in severity starting at stage II onwards (n = 324 individuals). Fluid neurodegeneration biomarkers increase with advancing PET-based Braak stage. CSF measurements of SNAP-25 (long) and neurogranin increased at stages III–IV (189 individuals with CSF measurements). No differences were observed between stages 0, I and II. Substantial within-stage variability was observed for plasma NfL (n = 292 individuals). No differences were observed between stages 0, I and II. Both fluid and imaging neurodegeneration biomarkers showed substantial within-stage variability, potentially reflecting the fact that neurodegeneration is a multifactorial process, influenced by factors other than tau-mediated neurodegeneration. Bottom: Neurodegeneration biomarker curves superimposed according to PET-based Braak stage. Note that Hippocampal volume was inverted in order to compare the degree of abnormality.
Extended Data Fig. 6
Extended Data Fig. 6. Full distribution of [18F]MK6240 SUVR in Braak regions.
Group means are represented by lines, error bars indicate standard deviation. The three individuals with focal cortical syndromes who were Braak stage discordant were not included in this figure. ***: p < 0.001; two-sided ANOVA corrected for multiple comparisons using Dunnett’s correction (n = 324 individuals).
Extended Data Fig. 7
Extended Data Fig. 7. Full distributions of Cognitive outcomes grouped by Braak stage.
Group means are represented by lines, error bars indicate standard deviation where applicable. a: n = 292 individuals with neuropsychological assessments available. b: n = 324 individuals with summary cognitive assessments available. c: n = 14 PSEN1 mutation carriers; total of 21 scans including follow-ups.
Extended Data Fig. 8
Extended Data Fig. 8. Full distribution of [18F]AZD4694 SUVR and CSF Aβ 42/40 grouped by Braak stage.
Group means are represented by lines, error bars indicate standard deviation. Note that the CSF biomarkers represent a subsample of individuals (n = 189 individuals with CSF evaluations) which did not include the amyloid-PET negative individuals at Braak stage VI (n = 324 individuals with amyloid-PET).
Extended Data Fig. 9
Extended Data Fig. 9. Full distribution of fluid phosphorylated tau concentrations grouped by Braak stage.
Group means are represented by lines, error bars indicate standard deviation (n = 189).

Comment in

References

    1. Gonnella JS, Hornbrook MC, Louis DZ. Staging of disease: a case-mix measurement. JAMA. 1984;251:637–644. doi: 10.1001/jama.1984.03340290051021. - DOI - PubMed
    1. Jack CR, et al. Tracking pathophysiological processes in Alzheimer’s disease: an updated hypothetical model of dynamic biomarkers. Lancet Neurol. 2013;12:207–216. doi: 10.1016/S1474-4422(12)70291-0. - DOI - PMC - PubMed
    1. Bateman RJ, et al. Clinical and biomarker changes in dominantly inherited Alzheimer’s disease. N. Engl. J. Med. 2012;367:795–804. doi: 10.1056/NEJMoa1202753. - DOI - PMC - PubMed
    1. Villemagne VL, et al. Amyloid-β deposition, neurodegeneration, and cognitive decline in sporadic Alzheimer’s disease: a prospective cohort study. Lancet Neurol. 2013;12:357–367. doi: 10.1016/S1474-4422(13)70044-9. - DOI - PubMed
    1. Jack CR, et al. NIA-AA research framework: toward a biological definition of Alzheimer’s disease. Alzheimers Dement. 2018;14:535–562. doi: 10.1016/j.jalz.2018.02.018. - DOI - PMC - PubMed

Publication types