. 2022 Sep;2(9):837-850.
doi: 10.1038/s43587-022-00281-1. Epub 2022 Sep 20.

Complement C1q-dependent excitatory and inhibitory synapse elimination by astrocytes and microglia in Alzheimer's disease mouse models

Affiliations

Complement C1q-dependent excitatory and inhibitory synapse elimination by astrocytes and microglia in Alzheimer's disease mouse models

Borislav Dejanovic et al. Nat Aging. 2022 Sep.

Abstract

Microglia and complement can mediate neurodegeneration in Alzheimer's disease (AD). By integrative multi-omics analysis, here we show that astrocytic and microglial proteins are increased in TauP301S synapse fractions with age and in a C1q-dependent manner. In addition to microglia, we identified that astrocytes contribute substantially to synapse elimination in TauP301S hippocampi. Notably, we found relatively more excitatory synapse marker proteins in astrocytic lysosomes, whereas microglial lysosomes contained more inhibitory synapse material. C1q deletion reduced astrocyte-synapse association and decreased astrocytic and microglial synapses engulfment in TauP301S mice and rescued synapse density. Finally, in an AD mouse model that combines β-amyloid and Tau pathologies, deletion of the AD risk gene Trem2 impaired microglial phagocytosis of synapses, whereas astrocytes engulfed more inhibitory synapses around plaques. Together, our data reveal that astrocytes contact and eliminate synapses in a C1q-dependent manner and thereby contribute to pathological synapse loss and that astrocytic phagocytosis can compensate for microglial dysfunction.


Conflict of interest statement

Several authors were full-time employees of Genentech during the course of the study. M.S. is scientific co-founder and member of the SAB of Neumora Therapeutics and member of the SAB of Vanqua Bio, ArcLight Therapeutics and Cerevel Therapeutics. All other authors declare no competing interests.

Figures

Fig. 1
Fig. 1. C1q deletion reduces neurodegeneration in P301S mice.
a, Study design. Male P301S and C1qKO mice were crossed as indicated and analyzed using longitudinal volumetric brain MRI, behavioral hyperactivity and pathological analysis, transcriptomics and synapse proteomics. b, Representative volumetric MRI images in male mice at 6 and 9 months of age. Arrows indicate hippocampal atrophy and ventricle enlargement in P301S mice. c, Longitudinal volumetric MRI quantification of whole brain volume changes in indicated mouse genotypes at 6 and 9 months (normalized to 3 months). d, Whole brain volume changes in indicated mouse genotypes at 6 and 9 months of age. P301S transgenic mice were normalized to non-transgenic mice with the same C1q genotype for comparison. e, Longitudinal volumetric MRI quantification of hippocampal brain volume changes in indicated mouse genotypes at 6 and 9 months (normalized to 3 months). f, Hippocampus volume changes in indicated mouse genotypes at 6 and 9 months of age. P301S transgenic mice were normalized to non-transgenic mice with the same C1q genotype for comparison. g, Nine-month-old mice were evaluated in the open field behavioral test by measuring total beam breaks to assess for behavioral hyperactivity. Each dot represents the values from one mouse. n = 8–10 mice per genotype (cg). One-way ANOVA with Tukey’s multi-comparisons test (d,f) and one-way ANOVA with Fisher’s least significant difference test (g). All data are presented as mean ± s.e.m. Source data
Fig. 2
Fig. 2. C1q deletion blunts proteomic changes in P301S synapses.
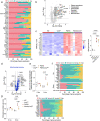
a, Experimental design of hippocampal PSD proteome analysis. Hippocampi from 6- and 9-month-old male mice were dissected and isolated synapse fractions were analyzed by TMT multiplex proteomics (Methods). b, Venn diagram showing the number of identified proteins and overlap between synapse proteomes in the 6- and 9-month cohort from this study and synapse proteome from 9-month-old female mice described previously. c, Percentage of DE proteins in the indicated genotype comparisons at 6 and 9 months. d, A heat map showing z scores across genotypes for proteins that were DE between C1qKO and WT mice (regardless of P301S genotype) (P ≤ 0.05; FC ≥ 5). e,f, Volcano plots showing the comparison between P301S versus WT and P301S;C1qKO versus WT synapse proteomes at 6 and 9 months. MSstats was used to calculate log2FC and standard error utilizing a linear mixed-effects model that considered quantification from each peptide and biological replicate per protein. P values were then calculated by comparing the model-based test statistic to a two-sided Student’s t-test distribution. Significantly up- and downregulated proteins (P < 0.05, log2FC ± 0.5) are shown in blue and red circles, respectively. Selected DE proteins are labeled with their protein or gene name. g, Selected up- or downregulated KEGG pathways in P301S versus WT and P301S,C1qKO versus WT synapse proteomes at 6 and 9 months. Only DE proteins were included for pathway analysis. Source data
Fig. 3
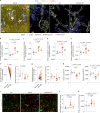
Fig. 3. Glial proteins are elevated at P301S synapses and normalized by C1qKO.
a, Cell-type-specific expression of genes that encode the most highly increased proteins in P301S synapses at 9 months. Percentage of gene expression in the major brain cell types (excitatory (exc.) neurons, astrocytes, microglia and oligodendrocytes (oligo)) was calculated based on pseudobulk analysis of scRNA-seq data from P301S mice. b, Heat maps showing z scores for normalized levels of glial proteins across genotypes in synapses at 6 and 9 months. Genes from a were defined as glial if the percentage of gene expression in excitatory neuron was <4%. Dotted lines indicate the cell type(s) that mainly express the corresponding gene. A, astrocyte; M, microglia; O, oligodendrocyte. Glia protein set score (right). c, Representative immunoEM images of EAAT2 in DG. Presynapses are pseudo-colored in red, postsynapses in green. EAAT2+ astrocyte processes are shown in blue. The synapse perimeter is outlined in orange and the astrocytic plasma membrane that is in contact with the synapse is in yellow. Scale bar, 200 nm. d, Length of astrocyte plasma membrane in association with the synapse in WT and P301S mice. e, Quantification of synapse perimeter in WT and P301S mice. f, Two-tailed Pearson’s correlation of astrocyte–synapse association and percentage of C1q-labeled presynapses, which was quantified previously in the same mice. g, Representative images showing the raw confocal immunofluorescence and the corresponding Imaris-processed image of GFAP (blue) and Homer1 (yellow) from a P301S brain. Inset shows three-dimensional (3D)-reconstructed GFAP+ astrocyte processes in the P301S brains and representative images from WT and P301S;C1qKO brains. Only Homer1 puncta that associate with astrocytes are shown (pink dots). h, Fraction of Homer1 puncta associated with astrocytes. Data were analyzed by two-way ANOVA with Tukey’s multi-comparisons test (b); two-tailed unpaired Student’s t-test (d,e) (10–16 astrocyte-synapses were quantified per mouse) and one-way ANOVA with Dunnett’s multiple comparisons test (h). Each dot shows average data from one mouse; n = 2–3 mice per genotype (b); n = 3 mice per genotype (d,e) and n = 7–10 mice per genotype (h). All data are presented as mean ± s.e.m. Source data
Fig. 4
Fig. 4. Glial proteins are increased in human AD synapse fractions and C4 is elevated in AD CSF.
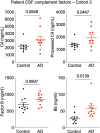
a, Scatter-plot comparison of synapse proteomes from 9 months old P301S versus WT mice (x axis) and AD versus control patients (y axis). Only orthologous protein pairs that were present in both datasets are shown. Of the 315 proteins that were significantly increased in P301S versus WT mice (P < 0.05, FC > 2) regardless of C1q genotype), 175 were increased in patients with AD versus controls, including the labeled proteins. Overall correlation of 0.34. NC, no change. b, Levels of total and processed C4 and Factor B and processed Bb fragment in CSF from controls and patients wth AD. Each dot represents the values from one individual. CSF samples from 15 controls and 14 patients with AD were analyzed (the same patients identified in previous works; cohort 1). Data were analyzed by two-tailed unpaired Student’s t-test. All data are presented as mean ± s.e.m. Source data
Fig. 5
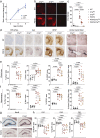
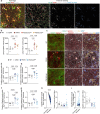
Fig. 5. Astrocytes and microglia eliminate excitatory and inhibitory synapses in P301S mice in a complement-dependent manner.
a, Representative images of a confocal z-stack and Imaris 3D reconstructions of mouse brain sections immunostained for GFAP (blue), Iba1 (white), Lamp1 (green), Homer1 (yellow) and gephyrin (red). LAMP1+ lysosomes within GFAP+ or Iba1+ volumes were classified as astrocytic or microglial lysosomes, respectively. Scale bar in the raw image, 10 µm; scale bar in the Imaris 3D-rendered image, 2 µm. b,c, Fraction of Homer1 puncta identified inside astrocytic or microglial lysosomes across genotypes. d,e, Fraction of total gephyrin puncta identified inside astrocytic or microglial lysosomes across genotypes. f, Normalized number of Homer1 puncta engulfed by astrocytes or microglia, respectively (left). Ratio of Homer1 puncta within astrocytic/microglial lysosomes (right). g, Normalized number of gephyrin puncta engulfed by astrocytes or microglia, respectively (left) and ratio of gephyrin puncta within astrocytic/microglial lysosomes (right). Dotted line in f and g at a ratio of 1 indicates that astrocytic and microglial lysosomes contained the same number of synaptic puncta, ratio of >1 means that more synaptic puncta were localized within astrocytic lysosomes and <1 indicates that microglial lysosomes contained more synaptic puncta. Connected dots in the left of f and g show astrocytic and microglial Homer1 or gephyrin engulfment from the same mouse. h, Excitatory and inhibitory synapse density across genotypes as measured by number of identified Homer1 and gephyrin puncta per field of view (FOV). i, Representative confocal images of immunostained Homer1 (green) and C3 (red) in the CA1 region of WT, P301S and P301S;C1qKO brains. Colocalized Homer1 and C3 puncta are indicated by circles. Scale bar, 2 µm. j, Graph shows percentage of C3-labeled Homer1+ synapses. k, Total number of C3 puncta per FOV. Data were analyzed by one-way ANOVA with Dunnett’s post hoc test (be,h,j,k) and a two-tailed paired Student’s t-test (f,g). Each dot shows average data from one mouse; 7–10 mice per genotype were analyzed. All data are presented as mean ± s.e.m. Source data
Fig. 6
Fig. 6. Astrocytes compensate for impaired microglial phagocytosis of inhibitory synapses in Trem2-deficient TauPS2APP mice.
a, Representative images of confocal z-stack and Imaris 3D reconstructions of mouse brain sections immunostained for GFAP (blue), Iba1 (white), Lamp1 (green), Homer1 (yellow) and gephyrin (red). LAMP1+ lysosomes within GFAP+ or Iba1+ volumes were classified as astrocytic or microglial lysosomes. Plaques were identified indirectly by the presence of large clusters of Lamp1 accumulation (outside of glial cell bodies), which labels dystrophic axons. In the 3D reconstructions (right hand image of each pair), only Lamp1 structures within GFAP or Iba1 volume are rendered. Scale bars, 5 µm. b,c, Fraction of Homer1 (b) or gephyrin (c) puncta identified within microglial lysosomes. d,e, Fraction of Homer1 (d) or gephyrin (e) puncta identified within astrocytic lysosomes. f,g, Ratio of Homer1 (f) and gephyrin (g) puncta within astrocytic/microglial lysosomes. Dotted line at a ratio of 1 indicates that astrocytic and microglial lysosomes contained the same number of synaptic puncta, ratio of >1 means that more synaptic puncta were localized within astrocytic lysosomes and <1 indicates that microglial lysosomes contained more synaptic puncta. Images containing dystrophic axons (plaques), were considered as ‘near plaque’ and images without any dystrophic axons were defined as ‘away plaque’. Data were analyzed by one-way ANOVA with Dunnett’s multiple comparisons test. Each dot shows average data from one mouse; n = 10–12 mice per genotype. Note that due to increased plaque load, in some TauPS2APP;Trem2KO mice we were not able to image plaque-free areas. All data are presented as mean ± s.e.m. Source data
Extended Data Fig. 1
Extended Data Fig. 1. Immunohistochemical characterization of C1q experimental cohort.
(a) Longitudinal volumetric T2 weighted MRI quantification of whole brain volume changes in WT and C3KO mice at 6 and 9 months (normalized to 3 months). (b) Example C1q immunofluorescence images from hemibrains of each genotype used in the study. (c) Quantification of C1q immunofluorescence in the whole brain of 9-month-old mice. (d) Representative images showing AT8 (pTau), Iba1, GFAP in hemibrains and Amino Cupric Silver staining in the hippocampus. (e) Quantification of pTau, Iba1, GFAP and Amino cupric silver positive area in whole brains. (f) Quantification of the same markers as in E) with analysis restricted to the hippocampus. (g) Representative images showing NeuN staining in each genotype with example ROIs for the CA1, CA3, and dentate gyrus (DG), subfields are illustrated on the first image. (h) Percentage of NeuN+ area in hippocampal CA1, CA3 and DG subregion across genotypes. Each dot shows average data from one mouse. 13–14 mice/genotype were used for volumetric MRI experiment in a), 8–10 mice/genotype were analyzed by immunohistochemistry in c-h). One-way ANOVA with Tukey multiple comparison test was used. All data are presented as mean ± SEM. Source data
Extended Data Fig. 2
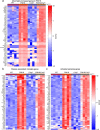
Extended Data Fig. 2. C1q deletion does not impact transcriptional changes in P301S mice.
(a) Heatmap showing Z score of genes that were most highly up-regulated in P301S vs. WT mice (without respect to C1q genotype). No genes showed DE when comparison was made between P301S and P301S;C1qKO mice (adjusted p <0.05) except for C1qc (log2FC = −6.44, p = 0.000256). (b) Heatmap showing Z score of top 60 DAM genes taken from the list in. (c) Heatmap showing Z score of top astrocytes activated genes taken from the list in.
Extended Data Fig. 3
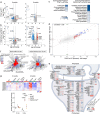
Extended Data Fig. 3. C1q-dependent synapse proteome changes in P301S mice.
(a,b) Volcano plots showing the comparison between A) C1qKO vs WT and B) P301S;C1qKO vs P301S synapse fraction proteomes at 6 and 9 months. MSStats was used to calculate log2(fold change) and standard error utilizing a linear mixed-effects model that considered quantification from each peptide and biological replicate per protein. P values were then calculated by comparing the model-based test statistic to a two-sided Student t-test distribution. Significantly up- and downregulated proteins (p-value < 0.05, log2FC ± 0.5) are shown in blue and red circles, respectively. Selected differentially expressed proteins are labeled with their protein or gene name. (c) KEGG pathways significantly downregulated in synapses from 6 months old C1qKO mice and 9 months old P301S;C1qKO vs P301S mice. (d) Scatterplot comparison of PSD proteomes from 9 months old P301S vs WT mice (x-axis) and P301S;C1qKO vs WT mice (y-axis). Note that protein changes in this comparison are larger in P301S compared to P301S;C1qKO synapse fractions, suggesting that C1q deletion blunts changes in P301S mice. Red indicates significantly different (p-value <0.05) in P301S vs. WT, but not significantly different in P301S;C1qKO vs WT (97 proteins), green indicates significantly different in P301S;C1qKO vs WT, but not significantly different in P301S vs. WT (only C1qC), and blue indicates significantly different in both comparisons (12 proteins). P-values and fold changes were calculated by MSStats, as described in methods. (e) Schematic representation of an excitatory synapse with the localization of selected proteins grouped by their function. Heatmaps show protein log2 fold-changes for individual genotype and age comparison. (f) SynGO analysis of downregulated proteins in P301S vs WT and P301S;C1qKO vs WT synapse proteomes at 9 months. (g) Heatmaps of normalized protein expression of annexins across genotypes in synapses at 6 and 9 months. The annexin protein set score is shown below. In g) each dot shows data from one mouse. 2–3 mice/genotype were used. Two-way ANOVA with Šidak’s test. All data are presented as mean ± SEM. Source data
Extended Data Fig. 4
Extended Data Fig. 4. Heritability enrichment analyses in differentially abundant proteins identified in P301S and P301S;C1qKO synapse fractions.
(a) Manhattan plots of per-SNP enrichment p-values for the top 1000 down-regulated proteins in 9-month P301S and P301S;C1qKO PSDs for 752 traits across 23 of the 24 UK Biobank Domains. The dotted red line corresponds to the Bonferroni threshold at 0.05 correcting for 752 traits (6.65 ×10⁻⁵). (b) Per-SNP heritability coefficients and 95% confidence intervals of seven select cognitive and psychiatric traits for the top 1000 up- or down-regulated proteins in C1qKO, P301S and P301S;C1qKO PSDs at 6 and 9 months. The GWAS for the seven cognitive and psychiatric traits have sample sizes between 46,350 to 1.1 million individuals (see methods). Dots with p-value < 0.001 were labeled in the graph. All P values are one-sided and calculated using s-LDSC.
Extended Data Fig. 5
Extended Data Fig. 5. Abundance of glial proteins at synapses and expression of their corresponding genes.
(a) Cell-type-specific expression of genes that encode the most highly decreased proteins in P301S synapses at 9 months. Percentage of gene expression was calculated based on pseudobulk analysis of scRNAseq data from P301S mice. (b) Volcano plot comparing P301S and WT synapse proteomes highlighting increased proteins that are selectively expressed by glial cells (<5% gene expression by neurons) and their annotated subcellular localization. MSStats was used to calculate log2(fold change) and standard error utilizing a linear mixed-effects model that considered quantification from each peptide and biological replicate per protein. P values were then calculated by comparing the model-based test statistic to a two-sided Student t-test distribution. (c) Heatmap showing z-scores from bulk RNAseq across genotypes for astrocyte and microglia specific genes encoding proteins in Fig 3c. The glial gene set score is shown on the right. (d) Mitochondrial proteins (blue dots) highlighted in volcano plots comparing 9 months old P301S vs WT synapse proteomes. Statistical tests were done as in panel B. The most highly up- or downregulated mitochondrial proteins are labeled using their gene or protein name. (e) Gene set score for mitochondrial proteins that are significantly increased in P301S synapses are shown across genotypes and age as indicated. (f) Cell-type-specific expression of genes encoding mitochondrial proteins that are up- or down-regulated in P301S PSDs at 9 months. Percentage of gene expression was calculated based on pseudobulk analysis of scRNAseq data from P301S mice. (g) Gene set score for peroxisome proteins that are significantly increased in P301S synapses are shown across genotypes and age as indicated. (h) Cell-type-specific expression of genes encoding peroxisome proteins that are up- or down-regulated in P301S PSDs at 9 months. Each dot shows data from one mouse. 2–5 mice/genotype were used. In c one-way ANOVA with Tukey multiple comparison test and in e, g two-way ANOVA with Tukey multiple comparison test was used. Percentage of gene expression in a, f and h is based on scRNAseq data from P301S mice. Source data
Extended Data Fig. 6
Extended Data Fig. 6. IEM and IHC analysis of astrocyte–synapse interaction.
(a) Representative immunoEM images of EAAT2 in hippocampal CA1 region. Presynapses are pseudo-colored in red, postsynapses in green. EAAT2+ astrocyte processes are shown in blue. The synapse perimeter is outlined in orange and the astrocytic plasma membrane that is in contact with the synapse in yellow. Scale bar = 200 nm. (b) Length of the astrocytic plasma membrane associated with the synapse in CA1 region from WT and P301S mice. (c) Quantification of synapse perimeter in CA1 region from WT and P301S mice. (d) Representative confocal image and Imaris 3D reconstructions of immunostained S100B (green) and Homer1 (red). In the 3D reconstructions only S100B-associated Homer1 puncta are shown. Scale bar = 5µm. (e) Percentage of Homer1 puncta that associated with S100B+ astrocytes. B, c Unpaired two-tailed t-test; e One-way ANOVA with Dunnett multi comparison test. Each dot shows average data from one mouse, in b,c) n = 3 mice/genotype, in e) n = 8–10 mice/genotype. All data are presented as mean ± SEM. Source data
Extended Data Fig. 7
Extended Data Fig. 7. Complement C4 and Factor B concentrations in AD CSF.
Levels of total and processed C4 and Factor B and processed Bb fragment in CSF from controls and AD patients. Each dot represents the values from one individual. CSF samples from 10 controls and 10 AD patients were analyzed (the same patients from, cohort 2). Unpaired two-tailed t-test. All data are presented as mean ± SEM. Source data
Extended Data Fig. 8
Extended Data Fig. 8. Complement-dependent engulfment of excitatory and inhibitory synapses by astrocytes and microglia in P301S mice.
(a) Representative image and Imaris 3D rendering of immunostained S100B (green), GFAP (red) and Lamp1 (white). 3D reconstructions show lysosomes (Lamp1 structures) within S100B+ astrocytes (white) or GFAP+ astrocytes (blue). Note that lysosome structures segmented within S100B+ and GFAP+ astrocytes are almost identical. Scale bar = 10µm. (b) Volume of LAMP1+ lysosomes inside astrocytes and microglia, respectively, in hippocampi from WT, C1qKO, P301S and P301S;C1qKO. (c) Representative images of WT, P301S and P301S;C1qKO brains immunostained for Homer1 (green), Gephyrin (red), LAMP1 (white), Iba1 (yellow) and GFAP (blue). Images on the right show 3D reconstructed GFAP+ astrocytes and Iba1+ microglia together with the raw immunofluorescence from Homer1, Gephyrin and LAMP1. Arrows highlight Gephyrin immunoreactivity accumulated in microglial lysosomes. Note that the neighboring astrocytic lysosomes do contain accumulated Gephyrin. (d,e) Fraction of Homer1 and Gephyrin puncta inside astrocytic or microglial lysosomes across genotypes. (f,g) Fraction of Gephyrin puncta inside astrocytic or microglial lysosomes across genotypes. (h) Normalized number of Homer1 puncta inside astrocytes or microglia, respectively (left graph) and ratio of Homer1 puncta within astrocytic/microglial lysosomes. (i) as in H) but showing engulfment data for Gephyrin. Dotted line at a ratio of 1 indicates that astrocytic and microglial lysosomes contained the same number of synaptic puncta, ratio of >1 means that more synaptic puncta were localized within astrocytic lysosomes and <1 indicates that microglial lysosomes contained more synaptic puncta. One-way ANOVA with Dunnett’s post hoc test (B, D-G) or paired two-tailed t-test (H, I). Each dot shows average data from one mouse. In b) 7–10 mice/genotype and in d-i) 9–10 mice/genotype were used. All data are presented as mean ± SEM. Source data

Similar articles

Cited by

References

    1. Selkoe DJ. Alzheimer’s disease is a synaptic failure. Science. 2002;298:789–791. doi: 10.1126/science.1074069. - DOI - PubMed
    1. Hansen DV, Hanson JE, Sheng M. Microglia in Alzheimer’s disease. J. Cell Biol. 2018;217:459–472. doi: 10.1083/jcb.201709069. - DOI - PMC - PubMed
    1. Dejanovic B, et al. Changes in the synaptic proteome in tauopathy and rescue of Tau-induced synapse loss by C1q antibodies. Neuron. 2018;100:1322–1336. doi: 10.1016/j.neuron.2018.10.014. - DOI - PubMed
    1. Wu T, et al. Complement C3 is activated in human AD brain and is required for neurodegeneration in mouse models of amyloidosis and tauopathy. Cell Rep. 2019;28:2111–2123. doi: 10.1016/j.celrep.2019.07.060. - DOI - PubMed
    1. Bai B, et al. Deep multilayer brain proteomics identifies molecular networks in Alzheimer’s disease progression. Neuron. 2020;106:700. doi: 10.1016/j.neuron.2020.04.031. - DOI - PMC - PubMed

Publication types