. 2023 Jan;3(1):121-137.
doi: 10.1038/s43587-022-00335-4. Epub 2022 Dec 19.

Cell-type-specific aging clocks to quantify aging and rejuvenation in neurogenic regions of the brain

Affiliations

Cell-type-specific aging clocks to quantify aging and rejuvenation in neurogenic regions of the brain

Matthew T Buckley et al. Nat Aging. 2023 Jan.

Abstract

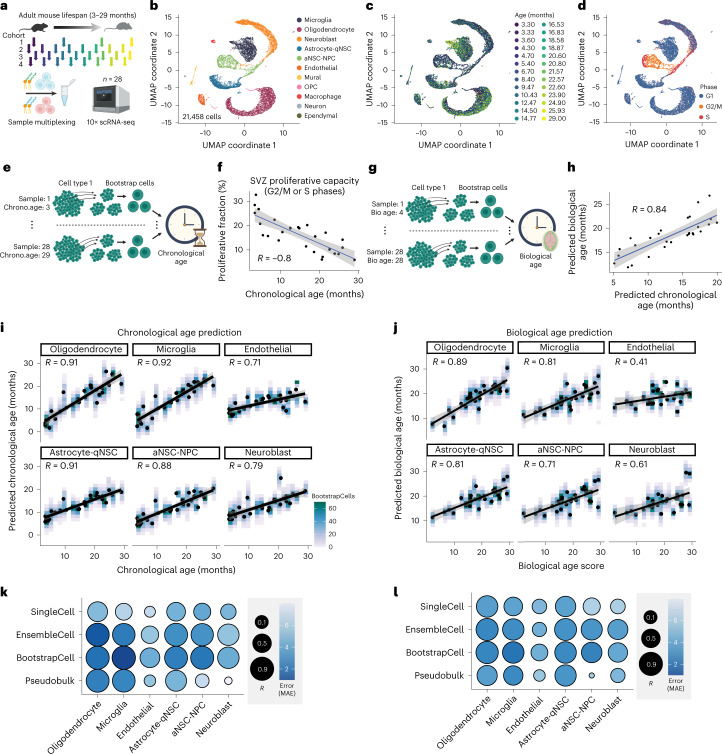
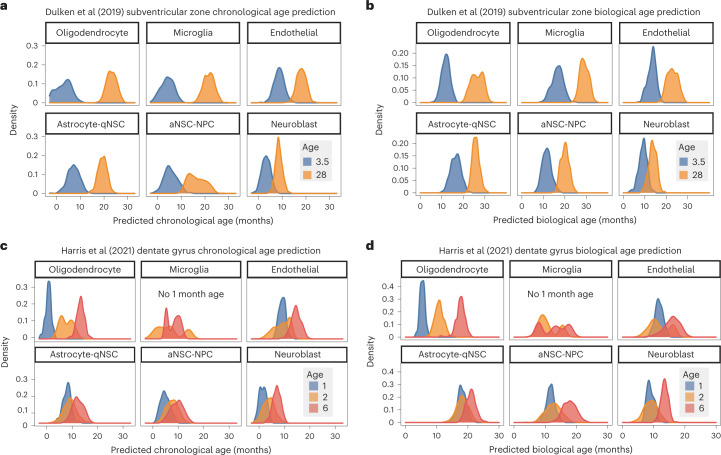
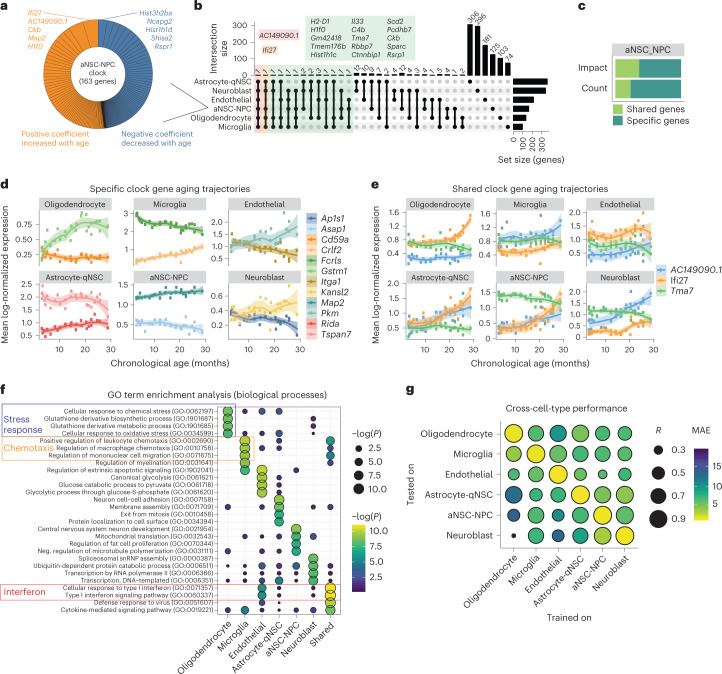
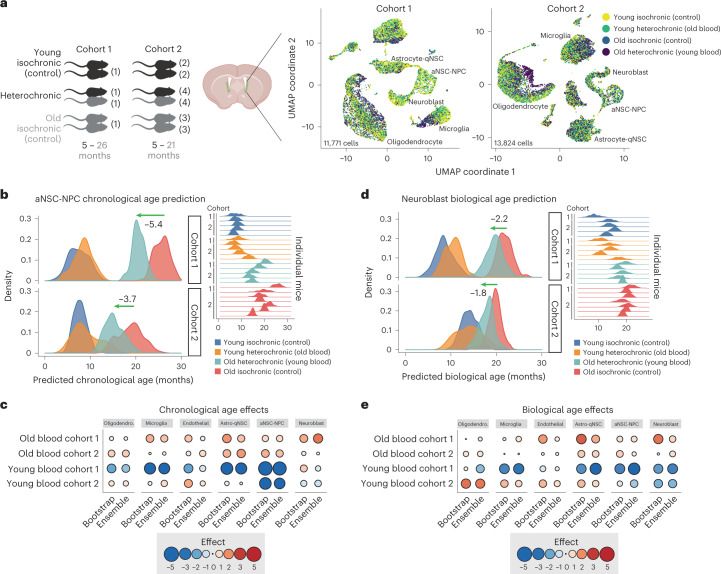
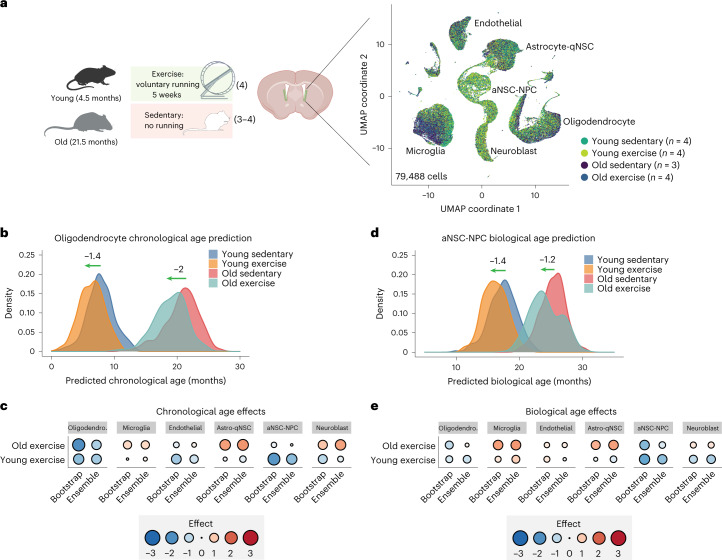
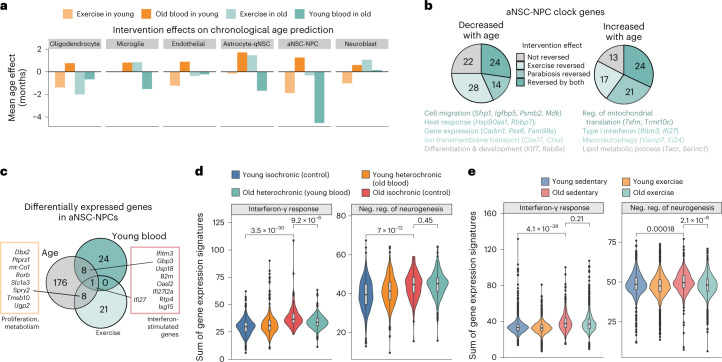
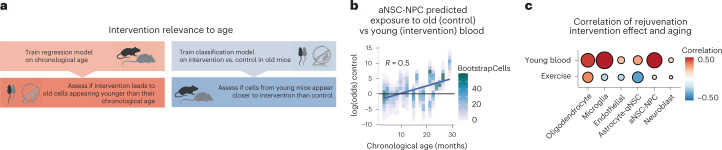
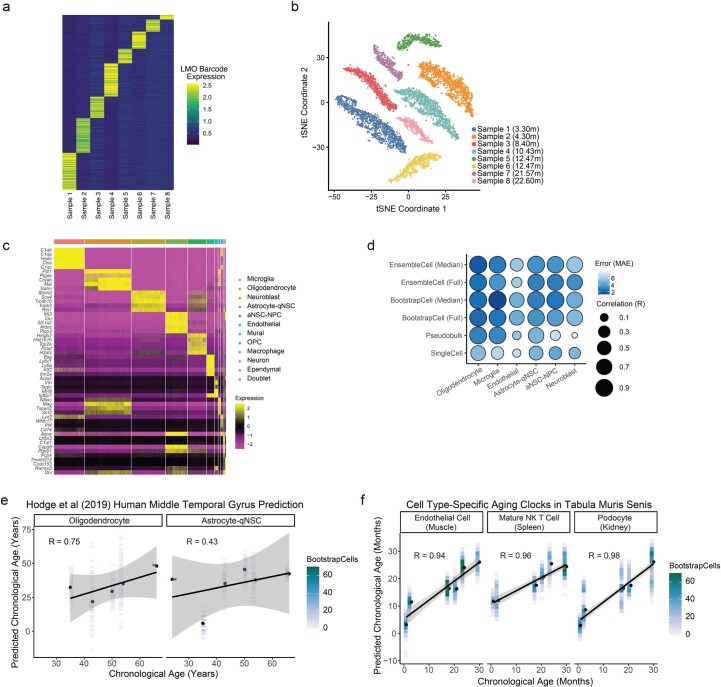
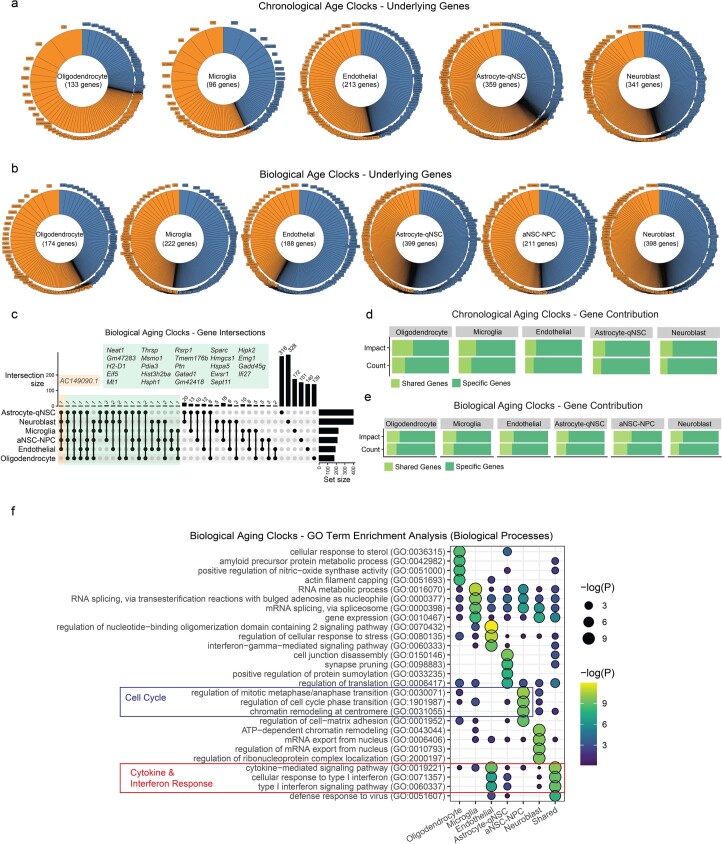
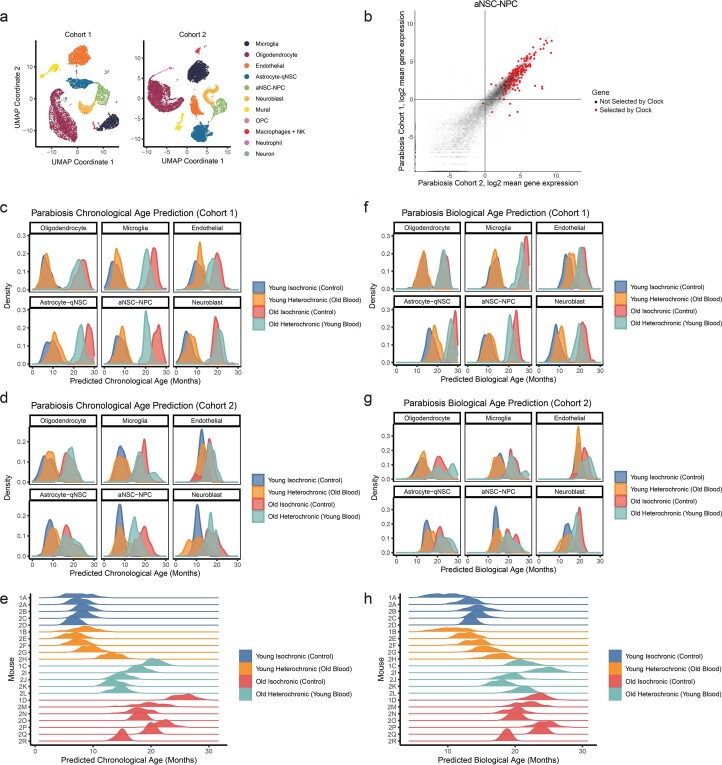
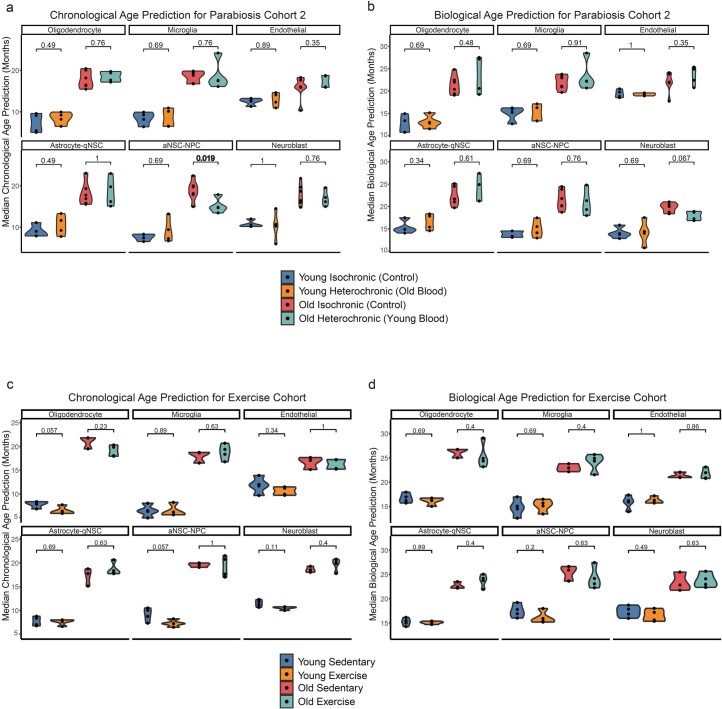
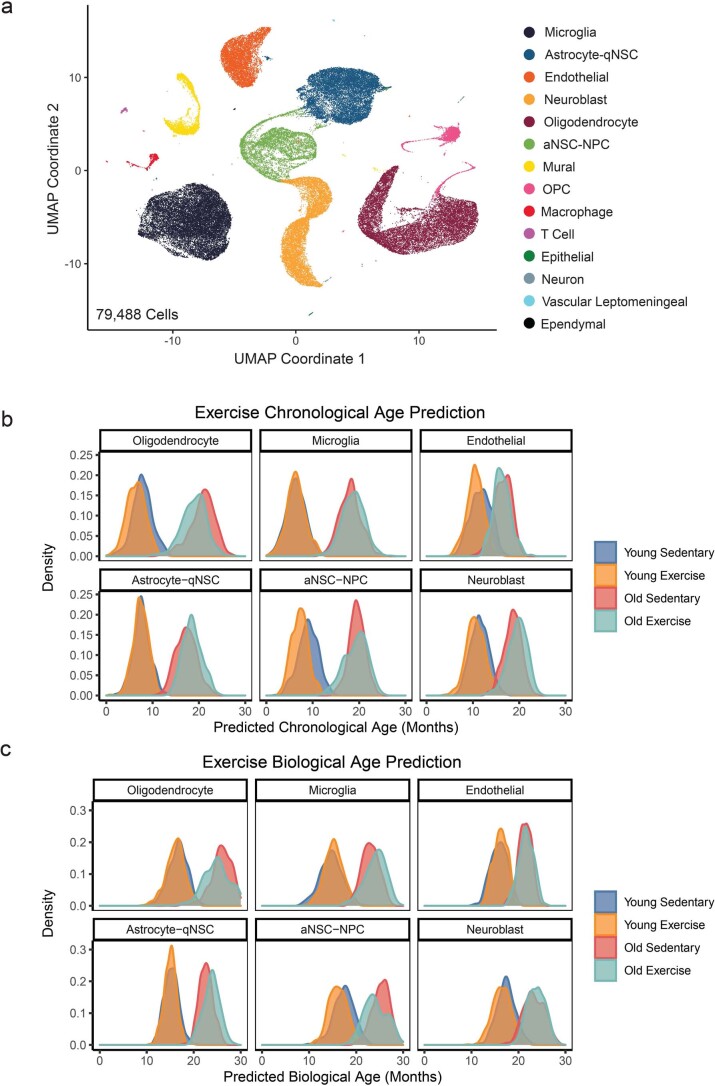
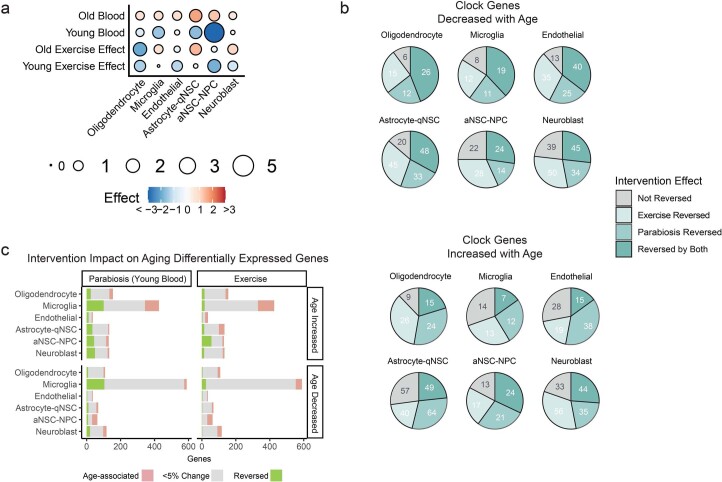
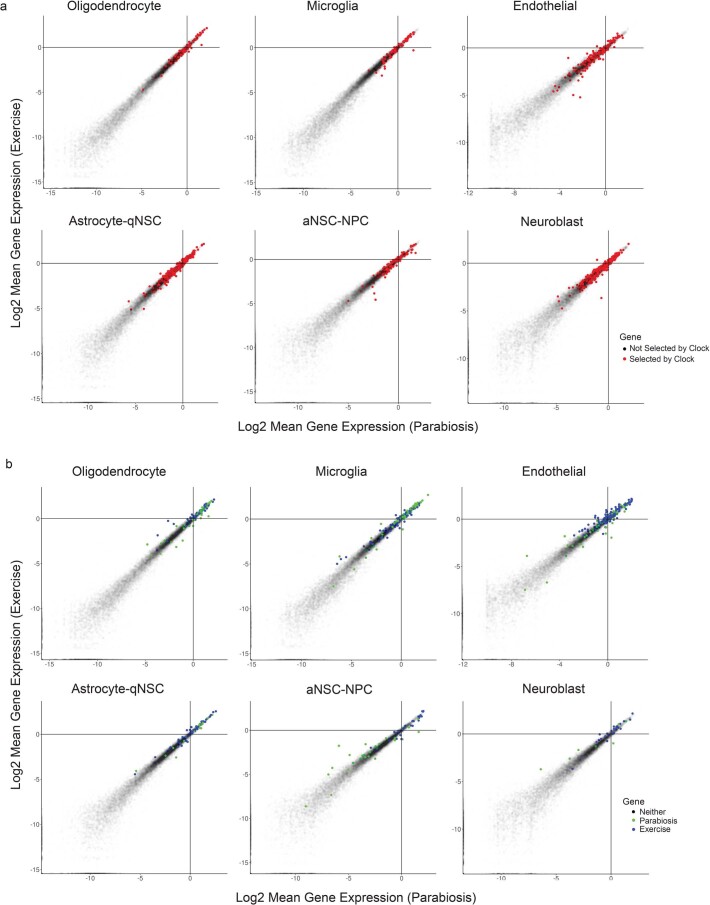
The diversity of cell types is a challenge for quantifying aging and its reversal. Here we develop 'aging clocks' based on single-cell transcriptomics to characterize cell-type-specific aging and rejuvenation. We generated single-cell transcriptomes from the subventricular zone neurogenic region of 28 mice, tiling ages from young to old. We trained single-cell-based regression models to predict chronological age and biological age (neural stem cell proliferation capacity). These aging clocks are generalizable to independent cohorts of mice, other regions of the brains, and other species. To determine if these aging clocks could quantify transcriptomic rejuvenation, we generated single-cell transcriptomic datasets of neurogenic regions for two interventions-heterochronic parabiosis and exercise. Aging clocks revealed that heterochronic parabiosis and exercise reverse transcriptomic aging in neurogenic regions, but in different ways. This study represents the first development of high-resolution aging clocks from single-cell transcriptomic data and demonstrates their application to quantify transcriptomic rejuvenation.


Conflict of interest statement

M.T.B. is a cofounder of Retro Biosciences. The remaining authors declare no competing interests.

Figures

Fig. 1
Fig. 1. Cell-type-specific transcriptomic aging clocks for neurogenic regions.
a, Training data for single-cell transcriptomic aging clocks. 10x Genomics single-cell transcriptomics on SVZ neurogenic regions from four independent cohorts of 4–8 male mice, aged 3.3 to 29 months (Supplementary Table 1). SVZ regions from the same cohort were multiplexed using LMO labeling (MULTI-seq). b, UMAP projection of 21,458 high-quality cells from SVZ single-cell transcriptomes across cohorts. Each dot represents the transcriptome of an individual cell with transcripts detected from at least 500 genes. c, Same as in b but colored by mouse age. Two pairs of mice had the same age, resulting in 26 age colors (28 mice). d, Same as in b but colored by the predicted cell cycle state based on Seurat’s CellCycleScoring function. e, Schematic depicting the generation of BootstrapCells for training chronological clocks. From each cell type and sample, 15 cells were sampled and combined to generate one BootstrapCell. This process was repeated 100 times per cell type and sample combination, to generate a training dataset that equally weighted each SVZ sample. f, SVZ proliferative fraction (cells predicted to be G2/M or S phase) as a function of chronological age. R represents Pearson’s correlation coefficient. The gray band corresponds to the 95% confidence interval. g, Schematic depicting the process of generating BootstrapCells for training biological age clocks. Biological age was defined as the SVZ proliferative fraction (f). h, Predicted biological age as a function of predicted chronological age. R represents Pearson’s correlation coefficient. Gray band corresponds to 95% confidence interval. i, Performance of BootstrapCell chronological age prediction across cell types. Density of BootstrapCell predictions is depicted in color and overlaid black dots represent the median prediction for each sample. Performance is based on cross-cohort validation. R values are Pearson’s correlation coefficients at the sample level. j, As in i but for BootstrapCell biological age score prediction across cell types. Biological age score is a linear transformation of the SVZ proliferative fraction. k, Overview of Pearson’s correlation coefficients and median absolute error (MAE) values for various methods of predicting chronological age across cell types. SingleCell uses bona fide single-cell transcriptomes with minimal processing as input to a lasso regression model. BootstrapCell uses the preprocessing method depicted in e and a lasso model. EnsembleCell involves repeatedly partitioning cells into groups of 15 cells and training an ensemble of elastic net models. Pseudobulk involves naïve pseudobulking all cells from the same cell type and sample and using a lasso regression model. Performance is based on cross-cohort validation. l, As in k but evaluating biological age prediction.
Fig. 2
Fig. 2. Generalization of aging clocks to independent datasets and other neurogenic regions.
a, External validation of BootstrapCell chronological age prediction models (chronological aging clocks) on single-cell transcriptomic data from young (blue) and old (orange) SVZ samples by Dulken et al.. Density plots show separated age prediction distributions, indicating ability to discriminate age. b, As in a but evaluating biological age prediction models (biological aging clocks). c, Density plots to assess the generalizability of chronological aging clocks (BootstrapCell) to another mouse neurogenic region using a dataset from Harris et al.. Transcriptomes of analogous cell types were collected from the dentate gyrus of the hippocampus (another neurogenic region) instead of the SVZ in mice of different ages. There were no microglia in the dataset at the 1-month time point. d, Density plots to assess the generalizability of biological aging clocks (BootstrapCell) to another mouse neurogenic region using a dataset from Harris et al. as in c.
Fig. 3
Fig. 3. Genes underlying the cell-type-specific chronological aging clocks.
a, Contribution of individual genes to the aNSC-NPC chronological aging clock (BootstrapCell). Donut plots, with sector size denoting gene weight in the model and color indicating sign of expression change with age. Total number of genes used by the clock is in the center. Positive coefficients (orange) indicate increased gene expression in older age. Negative coefficients (blue) indicate decreased gene expression in older age. For other chronological and biological aging clocks, see Extended Data Fig. 2a,b. All genes and coefficients are in Supplementary Table 3. b, UpSet plot illustrating the intersection of gene sets used by cell-type-specific chronological aging clocks. Genes present in four, five or six of the analyzed clocks are highlighted in green, yellow or red, respectively. For biological aging clocks, see Extended Data Fig. 2c. c, Bar plot comparing the impact and count of shared and specific genes within the aNSC-NPC chronological aging clock. Impact is the sum of the absolute value of the gene coefficients. Count is the number of genes in each category. For other chronological and biological aging clocks, see Extended Data Fig. 2d,e. d, Expression trajectories as a function of age of select clock-specific genes. Expression values are log-normalized counts per 10,000 transcripts. Bands correspond to 95% confidence intervals. e, Expression trajectories as a function of age of select shared genes across at least four cell-type-specific clocks. Bands correspond to 95% confidence intervals. f, Top enriched Gene Ontology (GO) biological process terms from GSEA of genes selected by chronological aging clocks. g, Assessment of the ability of cell-type-specific clocks to predict age given transcriptomes of different cell types. Size of dots corresponds to Pearson correlation with chronological age and color indicates MAE. Error substantially increases when testing on alternate cell types. For GO term analysis of cell-specific biological aging clocks, see Extended Data Fig. 2f.
Fig. 4
Fig. 4. Effect of heterochronic parabiosis on cell-type-specific aging clocks.
a, Schematic of parabiosis cohorts and corresponding UMAP projections from each cohort. Parabiosis cohort 1 dataset was generated with young (5 months) and old (26 months) male mice (number of mice indicated in parentheses); 11,771 high-quality transcriptomes were collected, using one SVZ sample per 10x lane. Parabiosis cohort 2 was generated with young (5 months) and old (21 months) male mice; 13,824 high-quality transcriptomes were collected, using LMOs to multiplex SVZ samples across three 10x lanes. UMAP projection and cell type clustering of SVZ single-cell transcriptomes in cohorts 1 and 2. Each dot represents the transcriptome of an individual cell. Colored by age and intervention (heterochronic parabiosis). For coloration by cell type, see Extended Data Fig. 6a. b, Density plots of the predicted chronological ages for aNSC-NPCs from cohort 1 and cohort 2. Green arrows illustrate the median shift in predicted age between old aNSC-NPCs exposed to young blood (old heterochronic) and old aNSC-NPCs exposed to old blood (old isochronic, control). Density plots for individual mice, and their cohorts of origin, are provided on the right. c, Summary of heterochronic parabiosis effects on chronological age scores across cell types. Effect sizes were calculated by taking the difference in median predicted ages between conditions. Blue color indicates a decrease in predicted chronological age (‘rejuvenation’). Red color indicates an increase in predicted chronological age (‘detrimental impact’). d, Density plots of the predicted biological age scores for neuroblasts from cohort 1 and cohort 2. Green arrows illustrate the median shift in predicted age between old neuroblasts exposed to young circulation (old heterochronic) compared to old neuroblasts exposed to old circulation (old isochronic, control). Density plots for individual mice, and their cohort of origin, are provided on the right. e, Summary of heterochronic parabiosis effects on biological age scores across cell types. Effect sizes are calculated by taking the difference in median predicted ages between conditions. Blue indicates a decrease in predicted chronological age (‘rejuvenation’). Red indicates an increase in predicted biological age. For statistical analysis at the mouse level, see Extended Data Fig. 7a.
Fig. 5
Fig. 5. Effect of exercise on cell-type-specific aging clocks.
a, Schematic of voluntary wheel running experiment and UMAP projection of single-cell transcriptomes. For the exercise cohort, 4 young (4.5 months) or 3–4 old (21.5 months) male mice were transferred into cages with either a freely spinning wheel or no wheel. Wheel rotations were tracked to verify that mice indeed exercised. After 5 weeks, SVZ niches were collected, so mice were ~6 months and 23 months at time of collection, and 15 lanes of 10x Genomics transcriptomics performed without sample multiplexing. UMAP projection and cell-type clustering of SVZ single-cell transcriptomes in the exercise cohort. Each dot represents the transcriptome of an individual cell. Colored by age and intervention (exercise) or by cell type (UMAP; Extended Data Fig. 8a). b, Density plots of predicted chronological ages of oligodendrocytes by age and exercise condition. Exercise consistently rejuvenated oligodendrocyte transcriptomes regardless of age. c, Summary of exercise effects on chronological age scores across cell types and ages. Effect sizes were calculated by taking the difference in median predicted ages between conditions. Blue indicates a decrease in predicted chronological age (‘rejuvenation’). Red indicates an increase in predicted chronological age (‘detrimental impact’). d, Density plots of aNSC-NPC predicted biological ages. Exercise rejuvenated aNSC-NPC transcriptomes of both young and old mice. e, Summary of exercise effects on biological age scores across cell types and ages. Effect sizes were calculated by taking the difference in median predicted ages between conditions. Blue indicates a decrease in predicted biological age (‘rejuvenation’). Red indicates an increase in predicted chronological age (‘detrimental impact’). For statistical analysis at the mouse level, see Extended Data Fig. 7b.
Fig. 6
Fig. 6. Comparison of exercise and parabiosis interventions on cell-type-specific aging clocks.
a, Bar plot comparing effects of different interventions. Bar represents the difference (in months) between predicted chronological ages between controls and intervention. Parabiosis cohorts 1 and 2 were averaged. b, Pie charts of the directional effect and overlap of intervention impact on aNSC-NPC chronological aging clock genes (BootstrapCell). Genes are called ‘reversed’ when the sign of the log fold change of gene expression in intervention versus control is opposite to the sign of the coefficient of the gene in the clock (indicated on top of the pie charts). Top GO biological process terms and representative genes are listed underneath. c, Venn diagram representing the overlap of DEGs in aNSC-NPCs between young and old mice (‘age’), old heterochronic mice and old isochronic mice (‘young blood’) and old exercised and old sedentary mice (‘exercise’). Differential expression thresholds required a minimum 1.1-fold expression change with a false discovery rate (FDR) < 0.1. For aging, mice were grouped as either young (<7 months) or old (>20 months). DEGs shared between age and young blood were interferon-stimulated genes. DEGs shared between age and exercise were genes involved in proliferation, metabolism and development. d, Violin and box plots of gene signatures (sum of normalized gene expression for all genes in the gene set) for ‘interferon-γ response’ and ‘negative regulation of neurogenesis’ for aNSC-NPCs in the parabiosis cohort 1 and cohort 2 combined. In the box plot, the line represents the median and the box represents the interquartile range. P values were obtained from the two-sided Wilcoxon rank-sum test (n = 668, 149 and 146 cells for ‘young isochronic’, ‘old isochronic’ and ‘old heterochronic’, respectively). e, As in d but for aNSC-NPCs in the exercise cohort (n = 2,243, 503 and 1,170 cells for ‘young sedentary’, ‘old sedentary’ and ‘old exercise’, respectively).
Fig. 7
Fig. 7. Predicting ‘rejuvenation intervention or control’ state on the transcriptomes from mice of different ages to assess intervention relevance to aging.
a, Schematic describing how to predict ‘rejuvenation intervention or control’ state on the transcriptomes from mice of different ages to assess intervention relevance to aging. b, Classification results based on logistic regression for the parabiosis intervention in aNSC-NPCs. Correlation between classification results, plotted as (log(p(control) / p(intervention))) and the actual chronological age of aNSC-NPC BootstrapCell transcriptomes. Old mice were more likely to be classified as ‘isochronic old control’, whereas young mice were more likely to be classified as ‘heterochronic old’, indicating that the gene signature that distinguishes exposure to young and old blood is relevant to aging. R is the Pearson correlation. Higher correlation indicates that the main intervention signature overlaps with and reverses age-related changes. c, Summary of correlations between intervention state prediction and chronological age across cell types and interventions, with a separate classifier built for each. The exercise classifiers were built to distinguish old sedentary from old exercised transcriptomes for each cell type. The lower correlation between intervention state predictions and age for the exercise samples implies that the signatures that distinguish exercised and sedentary mice are less related to aging than those derived from parabiosis intervention classifiers.
Extended Data Fig. 1
Extended Data Fig. 1. Characteristics of the SVZ single-cell transcriptomic data and generalization performance of cell-type-specific aging clocks to humans and generalization of the framework to other cell types and tissues.
a, Lipid-modified oligonucleotide cell barcodes detected from 8 SVZ samples multiplexed in one 10x lane. b, Same as in (a) but visualized using tSNE. Samples 5 and 6 were from mice of the same age (and colored in the same color in Fig. 1c). c, Heatmap of single cell gene expression for top 5 cell type markers used for annotation of cell type clusters. Colored bar on top indicates the various cell type clusters. d, Overview of Pearson correlation coefficients (R) and median absolute error (MAE) values for tested methods of predicting chronological age across cell types from single-cell transcriptomic data, including both full distribution (Full) and median metrics only (Median). Performance is based on cross-cohort-validation. e, Correlation plot to assess the generalizability of chronological aging clocks (BoostrapCell) to a human dataset from Hodge et al. the single-nucleus RNA-seq dataset of the middle temporal gyrus of human patients of different ages (Hodge et al.). Density of BootstrapCell predictions is depicted in color and overlaid black dots represent the median prediction for each sample. R values are Pearson’s correlation coefficients at the sample level. Bands correspond to 95% confidence interval. f, Performance of chronological aging clocks (BootstrapCell) derived from the single cell RNA-seq multi-tissue atlas Tabula Muris Senis, 2020. Predicted chronological age of endothelial cells from limb muscle, mature natural killer (NK) T cells from spleen, and podocyte cells from kidney from aging clocks built on Tabula Muris Senis as a function of actual chronological age for several mice of different ages. Density of BootstrapCell predictions is depicted in color and overlaid black dots represent the median prediction for each sample. Performance is based on cross-mouse validation. R values are Pearson’s correlation coefficients at the sample level.
Extended Data Fig. 2
Extended Data Fig. 2. Genes that contribute to the chronological aging clocks and biological aging clocks.
a, Contribution of individual genes to the chronological aging clocks (BootstrapCell) (see Fig. 3a for aNSC-NPCs). Donut plots, with sector size denoting gene weight in the model and color indicating sign of expression change with age. Total number of genes used by the clock is provided in the center of each donut plot. Positive coefficients (orange) indicate increased gene expression is associated with older age. Negative coefficients (blue) indicate decreased gene expression is associated with older age. b, As in (a) but for biological aging clocks (BootstrapCell) and their coefficients. c, Upset plot illustrating the intersection of gene sets used by cell-type-specific biological aging clocks. No genes were used in all 6 biological aging clocks. d, Count and coefficient impact of shared and cell-type-specific clock genes for chronological aging clocks. Shared is defined as present in at least one of the other five clocks (see Fig. 3c for aNSC-NPCs). e, As in (d) but for biological aging clocks. f, Top enriched Gene Ontology Biological Process terms from gene set enrichment analysis of genes used in biological aging clocks. Shared genes (present in two or more clocks) are enriched for cytokine-mediated signaling pathway and cellular response to type I interferon. The aNSC-NPC biological aging clock genes are enriched for cell cycle pathways.
Extended Data Fig. 3
Extended Data Fig. 3. Variability and mean expression of genes in the chronological aging clocks.
a, Scatter plots of the log2 coefficient of variation (CV) of the normalized BootstrapCell gene expression as a function of the log2 mean normalized BootstrapCell gene expression for all identified genes in the six different cell types. Red dots correspond to genes that contribute to the chronological aging clocks for each cell type (selected by clock) and black dots correspond to genes that do not contribute to the chronological aging clocks (not selected by clock). b, As in (a) but for the fraction of cells with nonzero counts in the dataset as a function of the log2 coefficient of variation (CV) of the normalized gene expression.
Extended Data Fig. 4
Extended Data Fig. 4. Comparison of genes in cell-type-specific aging clocks and differentially expressed genes with age.
a, Volcano plots of negative log10 false discovery rate (FDR) from differential gene expression analysis using MAST for the young and old mouse groups. We defined ‘young’ as mice <7 months old and ‘old’ as mice >20 months old. Colored dots correspond to genes that contribute to the chronological aging clocks for each cell type (selected by clock) (orange representing genes with positive clock coefficients and blue representing genes with negative clock coefficients) and gray dots correspond to that do not contribute to the chronological aging clocks (not selected by clock). b, As in (a) but for the biological aging clocks.
Extended Data Fig. 5
Extended Data Fig. 5. Gene detection rate in cell-type-specific aging clocks.
a, Unique genes detected in single cell transcriptomes from the subventricular zone as a function of gene detection rate. Red dots indicate unique genes detected at 2%, 20%, and 80% detection rates. b, Upset plots showing transcriptome overlaps between cell types at different levels of expression detection. Most genes are shared if a very low threshold of detection is used. Above 80% detection rate, transcriptomes are very cell type specific. However, the shared core of easily detected genes in transcriptomes (70 genes) is much larger than the shared core of genes selected by clocks (~1).
Extended Data Fig. 6
Extended Data Fig. 6. Application of cell-type-specific aging clocks to heterochronic parabiosis cohorts.
a, UMAP projection of single-cell transcriptomes labeled by cell type from both parabiosis cohorts. b, Scatter plot of log2 mean BootstrapCell expression of all genes in the parabiosis cohort 1 data compared to the same genes in the parabiosis cohort 2 data for aNSC-NPCs. Red dots correspond to genes that contribute to the aNSC-NPC chronological aging clock (selected by clock). Gray dots correspond to genes that do not contribute to the aNSC-NPC chronological aging clock (not selected by clock). c, Density plots for prediction of chronological age using chronological aging clocks for Parabiosis cohort 1 (BootstrapCell). d, Density plots for prediction of chronological age using chronological aging clocks for Parabiosis cohort 2 (BoostrapCell). e, Density plots for prediction of chronological age using chronological aging clocks for both cohorts separated by mouse (BootstrapCell). f, Density plots for prediction of biological age using biological aging clocks for Parabiosis cohort 1 (BootstrapCell). g, Density plots for prediction of biological age using biological aging clocks for Parabiosis cohort 2 (BoostrapCell). h, Density plots for prediction of biological age using biological aging clocks for both cohorts separated by mouse (BoostrapCell).
Extended Data Fig. 7
Extended Data Fig. 7. Statistical comparison of the rejuvenation effect size for heterochronic parabiosis and exercise at the mouse level.
a, Violin plots of the median predicted chronological ages for all mice in parabiosis cohort 2 (BootstrapCell). Each dot correspond to the median predicted chronological age of an individual mouse. P-values at the mouse level obtained from the two-sided Wilcoxon rank-sum test. b, As in (a) but for the median predicted biological ages. c, As in (a) but for the exercise cohort. d, As in (a) but for the median predicted biological age in the exercise cohort.
Extended Data Fig. 8
Extended Data Fig. 8. Application of cell-type-specific aging clocks to exercise cohort.
a, UMAP projection of single-cell transcriptomes labeled by cell type from the exercise intervention cohort. b, Density plots to predict chronological age using chronological aging clocks (BootstrapCell) for young and old, exercise and control samples. c, Density plots to predict biological age using biological aging clocks (BoostrapCell) for young and old, exercise and control samples.
Extended Data Fig. 9
Extended Data Fig. 9. Comparison of genes in cell-type-specific aging clocks impacted by heterochronic parabiosis and by exercise.
a, Dot plot summarizing and comparing intervention effects across cell types. Effect sizes for parabiosis were determined by averaging cohort 1 and cohort 2. Exposure to young blood via heterochronic parabiosis has a stronger rejuvenation effect than exercise, and the impact is strongest in aNSC-NPCs. b, Pie charts indicating the overlap and directional effects of different interventions on genes selected by chronological aging clocks (BootstrapCell). Top: selected clock genes increase with age: Bottom: selected clock genes decrease with age. c, Barplots showing the proportion of genes that are differentially expressed age which are reversed by intervention, cell type, and whether the genes increase or decrease with age (abs(ln(fold change)) > 0.1, or approximately greater than a 1.1 fold change with age, FDR < 0.1). Parabiosis is effective at shifting differentially expressed genes during aging towards a more young-associated expression levels (more green in ‘Parabiosis’ column). Reduction of expression of genes that increase with age is larger than the induction of expression of genes that decrease with age (more green in ‘Age Increased’ rows).
Extended Data Fig. 10
Extended Data Fig. 10. Comparison of mean expression of genes in the aging clocks and genes impacted by rejuvenation in the heterochronic parabiosis and exercise datasets.
a, Scatter plots of the log2 mean normalized BootstrapCell gene expression in the exercise single-cell data as a function of the log2 mean normalized BootstrapCell gene expression in the parabiosis (cohorts 1 and 2 combined) single-cell data for the six main cell types. Red dots correspond to genes that contribute to the chronological aging clocks (selected by clock) and gray dots correspond to genes that do not contribute to the chronological aging clocks (not selected by clock). Genes that contribute to the clock are both highly expressed in the parabiosis and exercise datasets. b, As in (a) but colored dots correspond to genes identified as differentially expressed by parabiosis (green) and exercise (blue). Gray dots correspond to genes that are affected neither by parabiosis nor by exercise (neither). Permissive 1.1-fold change and FDR < 0.1 cutoffs were applied in each of the 2 different conditions.

References

    1. Ocampo A, Reddy P, Belmonte JCI. Anti-aging strategies based on cellular reprogramming. Trends Mol. Med. 2016;22:725–738. doi: 10.1016/j.molmed.2016.06.005. - DOI - PubMed
    1. Pluvinage JV, Wyss-Coray T. Systemic factors as mediators of brain homeostasis, ageing and neurodegeneration. Nat. Rev. Neurosci. 2020;21:93–102. doi: 10.1038/s41583-019-0255-9. - DOI - PubMed
    1. Mahmoudi S, Xu L, Brunet A. Turning back time with emerging rejuvenation strategies. Nat. Cell Biol. 2019;21:32–43. doi: 10.1038/s41556-018-0206-0. - DOI - PMC - PubMed
    1. Rando TA, Chang HY. Aging, rejuvenation, and epigenetic reprogramming: resetting the aging clock. Cell. 2012;148:46–57. doi: 10.1016/j.cell.2012.01.003. - DOI - PMC - PubMed
    1. Green CL, Lamming DW, Fontana L. Molecular mechanisms of dietary restriction promoting health and longevity. Nat. Rev. Mol. Cell Biol. 2022;23:56–73. doi: 10.1038/s41580-021-00411-4. - DOI - PMC - PubMed

Publication types