Observational Study
. 2023 Jan;3(1):93-104.
doi: 10.1038/s43587-022-00328-3. Epub 2023 Jan 20.

Strong peak immunogenicity but rapid antibody waning following third vaccine dose in older residents of care homes

Collaborators, Affiliations
Observational Study

Strong peak immunogenicity but rapid antibody waning following third vaccine dose in older residents of care homes

Gokhan Tut et al. Nat Aging. 2023 Jan.

Abstract

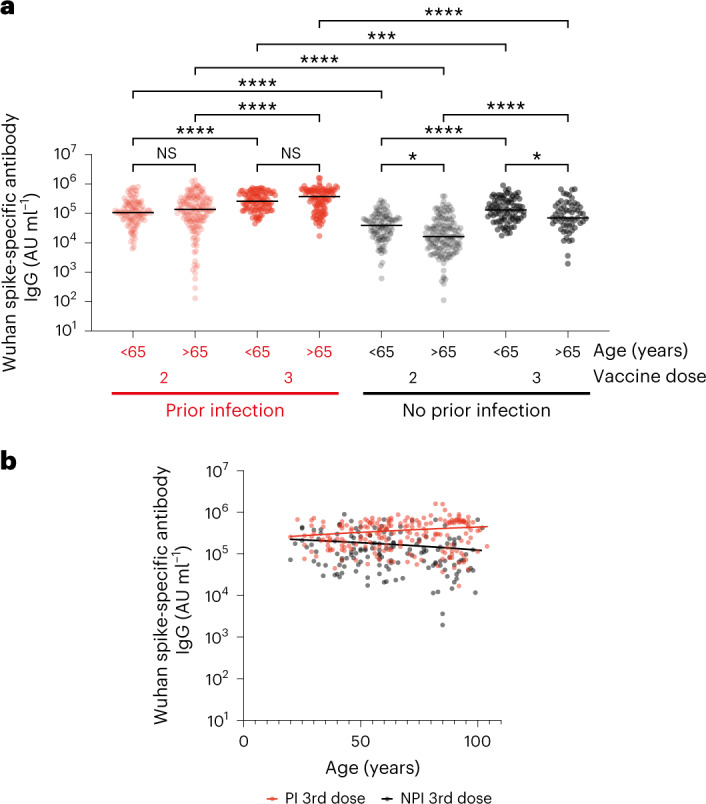
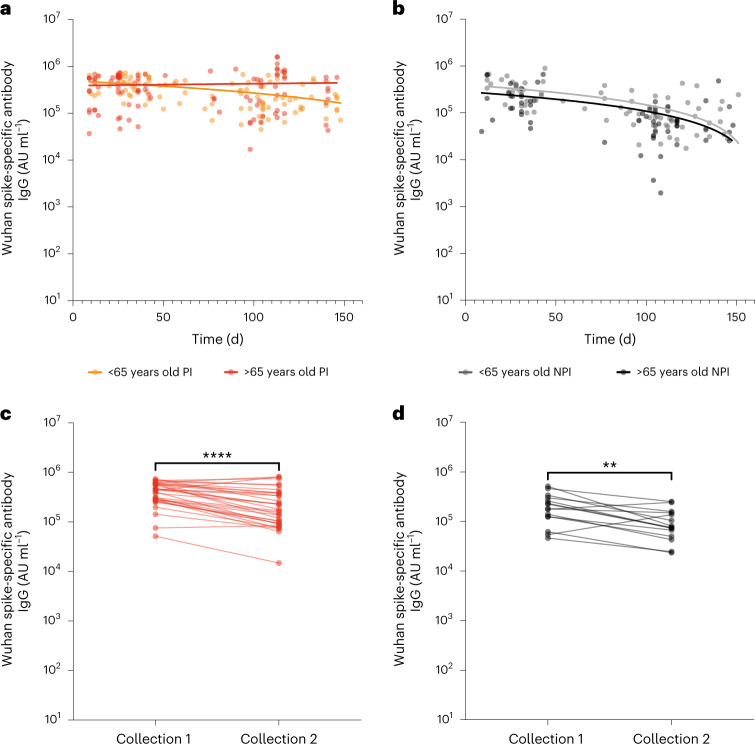
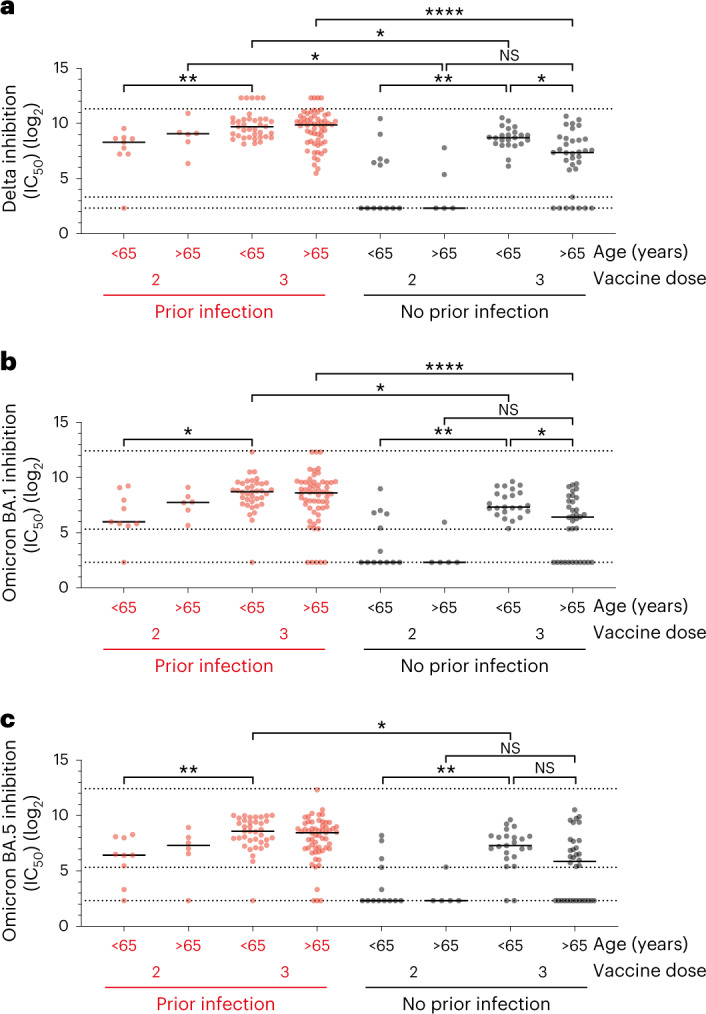
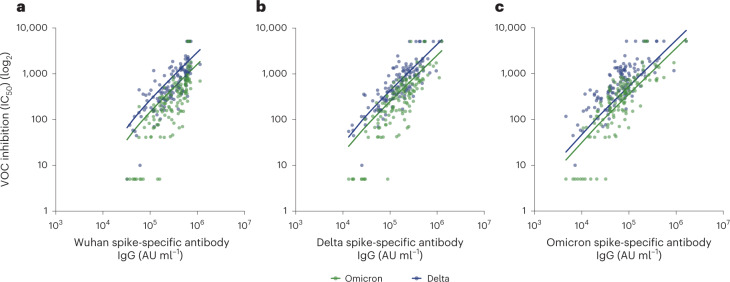
Third-dose coronavirus disease 2019 vaccines are being deployed widely but their efficacy has not been assessed adequately in vulnerable older people who exhibit suboptimal responses after primary vaccination series. This observational study, which was carried out by the VIVALDI study based in England, looked at spike-specific immune responses in 341 staff and residents in long-term care facilities who received an mRNA vaccine following dual primary series vaccination with BNT162b2 or ChAdOx1. Third-dose vaccination strongly increased antibody responses with preferential relative enhancement in older people and was required to elicit neutralization of Omicron. Cellular immune responses were also enhanced with strong cross-reactive recognition of Omicron. However, antibody titers fell 21-78% within 100 d after vaccine and 27% of participants developed a breakthrough Omicron infection. These findings reveal strong immunogenicity of a third vaccine in one of the most vulnerable population groups and endorse an approach for widespread delivery across this population. Ongoing assessment will be required to determine the stability of immune protection.


Conflict of interest statement

L.S. reports grants from the Department of Health and Social Care during the conduct of the study and is a member of the Social Care Working Group, which reports to the Scientific Advisory Group for Emergencies. A.H. is a member of the New and Emerging Respiratory Virus Threats Advisory Group at the Department of Health. The remaining authors declare no competing interests.

Figures

Fig. 1
Fig. 1. Spike-specific antibody responses are boosted after third vaccine.
a, Wuhan spike-specific antibody titer after 2 or 3 COVID-19 vaccine doses in relation to prior infection status and in staff or resident groups. Red dots indicate participants with prior natural infection and black dots indicate non-infected donors. Age is shown as <65 or >65 years and separates staff and residents. Kruskal–Wallis (uncorrected Dunn’s test), *P = 0.05, ****P < 0.0001, n = 863. The black line indicates the median antibody titer. b, Spike-specific antibody titer in relation to donor age. Red dots indicate participants with prior natural infection (PI; Spearman’s correlation r = 0.13, P = 0.053, n = 198) and black dots indicate those with no prior infection (NPI; two-tailed Spearman’s correlation r = −0.21, P = 0.01, n = 145). All fitted lines are linear regressions.
Fig. 2
Fig. 2. Spike-specific antibody responses show pronounced waning after third dose.
a, Spike-specific antibody titer in relation to the day after the third vaccine in donors with prior infection. Orange indicates staff (Spearman’s correlation r = −0.48, P < 0.0001, n = 97) and red indicates residents (two-tailed Spearman’s correlation r = 0.003, P = 0.97, n = 101). All fitted lines are linear regressions. b, Spike-specific antibody titers in relation to the day after the third vaccine in donors without prior infection. Gray indicates staff (Spearman’s correlation r = −0.63, P < 0.0001, n = 86) and black indicates residents (two-tailed Spearman’s correlation r = −0.50, P < 0.0001, n = 57). All fitted lines are linear regressions. c, Spike-specific antibody titer in individual paired samples at two time points following third vaccine dose in donors with prior infection. Two-tailed paired t-test P < 0.0001, n = 32. d, Spike-specific antibody titers in individual paired samples at two time points following third vaccine dose in donors without prior infection. Two-tailed paired t-test P < 0.0044, n = 15.
Fig. 3
Fig. 3. Third vaccine dose enhances neutralization of Delta and Omicron BA.1 and BA.5.
a, Antibody neutralization of Delta variant after third vaccine in relation to prior natural infection and age. Red dots indicate participants with prior natural infection and black dots indicate non-infected donors. Kruskal–Wallis (uncorrected Dunn’s test), *P = 0.015, **P = 0.003, ****P = 0.0001, n = 195. Black line indicates the median. No prior infection <65 versus >65 years old, Chi-squared test: Fisher’s exact, P = 1.000. Top and bottom dotted lines indicate the continuous region of the data obtained. Between middle and bottom regions is the weak inhibition region. b, Antibody neutralization of Omicron variant BA.1 after third vaccine in relation to prior natural infection and age. Red dots indicate participants with prior natural infection and black dots indicate non-infected donors. Kruskal–Wallis (uncorrected Dunn’s test), *P = 0.03, **P = 0.003, ****P = 0.0001, n = 195. Black line indicates the median. No prior infection <65 versus >65 years old, Chi-squared test: Fisher’s exact, P = 0.596. Top and bottom dotted lines indicate the continuous region of the data obtained. Between middle and bottom regions is the weak inhibition region. c, Antibody neutralization of Omicron variant BA.5 after third vaccine in relation to prior natural infection and age. Red dots indicate participants with prior natural infection and black dots indicate non-infected donors. Kruskal–Wallis (uncorrected Dunn’s test) *P = 0.01, **P = 0.004, n = 195. Black line indicates the median. No prior infection <65 versus >65 years old, Chi-squared test: Fisher’s exact, P = 0.46. Top and bottom dotted lines indicate the continuous region of the data obtained. Between middle and bottom regions is the weak inhibition region.
Fig. 4
Fig. 4. Spike-specific antibody binding to Wuhan spike protein correlates with variant neutralization.
a, Wuhan spike-specific antibody titers in relation to variant of concern (VOC) neutralization. Blue dots and line indicate Delta neutralization (two-tailed Spearman’s correlation r = 0.80, P < 0.0001, n = 133) and green dots and line indicate Omicron neutralization (two-tailed Spearman’s correlation r = 0.82, P < 0.0001, n = 133). All fitted lines are linear regressions. b, Delta spike-specific antibody titer in relation to VOC neutralization. Blue dots and line indicate Delta neutralization (two-tailed Spearman’s correlation r = 0.81, P < 0.0001, n = 133) and green dots and line indicate Omicron neutralization (two-tailed Spearman’s correlation r = 0.81, P < 0.0001, n = 133). All fitted lines are linear regressions. c, Omicron spike-specific antibody titer in relation to VOC neutralization. Blue dots and line indicate delta neutralization (two-tailed Spearman’s correlation r = 0.76, P < 0.0001, n = 133) and green dots and line indicate omicron neutralization (two-tailed Spearman’s correlation r = 0.80, P < 0.0001, n = 133). All fitted lines are linear regressions.
Fig. 5
Fig. 5. Spike-specific T cell responses are increased following third vaccination.
a, IFN-γ ELISpot response to spike peptide stimulation following second or third vaccine. Results are shown in relation to age (<65 and >65 years), prior natural infection (red) and no prior infection (black). Kruskal–Wallis (uncorrected Dunn’s test) *P = 0.01, **P = 0.009, ****P < 0.0001, n = 768. Black lines indicate the median. b, Paired IFN-γ ELISpot responses in individual donors following stimulation of PBMCs with peptides from Wuhan spike (black) and Omicron spike (green) in prior infected donors. Two-tailed paired t-test P = 0.34, NS, n = 57. c, Paired IFN-γ ELISpot responses in individual donors following stimulation of PBMCs with peptides from Wuhan spike (black) and Omicron spike (green) in infection-naive donors. Two-tailed paired t-test *P = 0.02, n = 57. d, IFN-γ ELISpot response to spike peptide stimulation in relation to the day after the third vaccine. Red indicates participants with prior natural infection (two-tailed Spearman’s correlation r = 0.04, P = 0.66, n = 145) and black indicates infection-naïve donors (two-tailed Spearman’s correlation r = −0.12, P = 0.22, n = 103).
Fig. 6
Fig. 6. Frequency and phenotype of spike-specific CD4+ T cells.
a, Frequency of spike-specific CD4+ T cells within the total CD4+ repertoire as detected by intracellular cytokine analysis and in relation to single or dual production of IL-2 or IFN-γ. The x axis indicates donor age (<65 or >65 years). Two-tailed Mann–Whitney, IFN-γ *P = 0.025, IL-2+IFN-γ+ *P = 0.017. b, Pattern of single or dual IL-2 and IFN-γ cytokine production in spike-specific CD4+ T cells in donors with prior infection (n = 13) or no prior infection (n = 9). (PI: IL-2, IFN-γ and IL-2+IFN-γ+ = 76%, 16% and 8%, versus NPI 86%, 10% and 4%, respectively). Two-tailed Chi-square P < 0.0001 PI versus NPI. c, Distribution of central memory (TCM), effector (TE) or TEMRA memory pools in spike-specific CD4+ T cells in donors with prior infection (n = 13) or no prior infection (n = 9). (PI, TCM, TE and TEMRA = 49%, 46% and 5%, versus NPI = 58%, 36% and 6%, respectively). Two-tailed Chi-square P = 0.36, PI versus NPI.
Fig. 7
Fig. 7. Peak antibody and cellular response after third vaccine do not correlate with protection against breakthrough.
a, Kaplan–Meier curve showing the probability of infection from third vaccine in recipients who had follow-up screening after vaccination. Follow-up time began 7 d after the third vaccine (n = 305, 81 positive PCR or LFD). The 95% confidence intervals (CIs) are shown in a lighter shade. b, Kaplan–Meier curve showing the probability of infection from third vaccine in recipients stratified by <65 and ≥65 years of age. Follow-up time began 7 d after the third vaccine (blue, <65 years, 54 positive test; green, ≥65 years, 27 positive test, n = 305, log-rank P = 0.099). The 95% CIs are shown in a lighter shade. c, Kaplan–Meier curve of the probability of infection in relation to spike-specific antibody response above predicted (green) or below predicted (red) median over the subsequent 120 d. Cox proportional hazards regression model: hazard ratio, 0.96 (95% CI 0.45–2.06, P = 0.93), n = 122 participants. d, Kaplan–Meier curve of the probability of infection in relation to spike-specific cellular response above (green) or below (red) predicted median over the subsequent 120 d. Cox proportional hazards regression model: hazard ratio, 0.81 (95% CI 0.37–1.74, P = 0.59), n = 122 participants.
Extended Data Fig. 1
Extended Data Fig. 1. Gating strategy.
Gating strategy showing detailing how spike specific CD4 cells were isolated and their memory phenotype as well as CD28/27 status was determined. This was carried out for both IFNy, IL-2 and double positive CD4 cells in response to spike peptide stimulation.

References

    1. Dutey-Magni PF, et al. COVID-19 infection and attributable mortality in UK care homes: cohort study using active surveillance and electronic records (March-June 2020) Age Ageing. 2021;50:1019–1028. doi: 10.1093/ageing/afab060. - DOI - PMC - PubMed
    1. Collier DA, et al. Age-related immune response heterogeneity to SARS-CoV-2 vaccine BNT162b2. Nature. 2021;596:417–422. doi: 10.1038/s41586-021-03739-1. - DOI - PMC - PubMed
    1. Shrotri, M. et al. Vaccine effectiveness of the first dose of ChAdOx1 nCoV-19 and BNT162b2 against SARS-CoV-2 infection in residents of long-term care facilities in England (VIVALDI): a prospective cohort study. Lancet Infect. Dis.21, 1529–1538 (2021). - PMC - PubMed
    1. Tut, G. et al. Reduced antibody and cellular immune responses following dual COVID-19 vaccination within infection-naïve residents of long-term care facilities. Lancet Healthy Longev.3, e461–e469 (2022). - PMC - PubMed
    1. Krutikov M, et al. Incidence of SARS-CoV-2 infection according to baseline antibody status in staff and residents of 100 long-term care facilities (VIVALDI): a prospective cohort study. Lancet Healthy Longev. 2021;2:e362–e370. doi: 10.1016/S2666-7568(21)00093-3. - DOI - PMC - PubMed

Publication types