. 2022 Dec;2(12):1176-1190.
doi: 10.1038/s43587-022-00312-x. Epub 2022 Dec 1.

Transcriptional memory of dFOXO activation in youth curtails later-life mortality through chromatin remodeling and Xbp1

Affiliations

Transcriptional memory of dFOXO activation in youth curtails later-life mortality through chromatin remodeling and Xbp1

Guillermo Martínez Corrales et al. Nat Aging. 2022 Dec.

Abstract

A transient, homeostatic transcriptional response can result in transcriptional memory, programming subsequent transcriptional outputs. Transcriptional memory has great but unappreciated potential to alter animal aging as animals encounter a multitude of diverse stimuli throughout their lifespan. Here we show that activating an evolutionarily conserved, longevity-promoting transcription factor, dFOXO, solely in early adulthood of female fruit flies is sufficient to improve their subsequent health and survival in midlife and late life. This youth-restricted dFOXO activation causes persistent changes to chromatin landscape in the fat body and requires chromatin remodelers such as the SWI/SNF and ISWI complexes to program health and longevity. Chromatin remodeling is accompanied by a long-lasting transcriptional program that is distinct from that observed during acute dFOXO activation and includes induction of Xbp1. We show that this later-life induction of Xbp1 is sufficient to curtail later-life mortality. Our study demonstrates that transcriptional memory can profoundly alter how animals age.


Conflict of interest statement

Competing interests

The authors declare no competing interests

Figures

Extended Data Fig. 1
Extended Data Fig. 1. Experimental setup – expression.
a Expression pattern of UAS-n8-GFP, driven with the S106 driver in 7 day-old female guts and fat bodies. All images were taken at exactly the same laser conditions under the confocal microscope, to allow the comparison of GFP levels between the two tissues. Scale bars are 50μm. b representative example of a S106 > n8-GFP fat body, induced or not with RU486, under different imaging conditions to (a), allowing a better view of GFP induction in fat body cells. Scale bars are 50μm. c Quantification of dfoxo mRNA levels in S106 alone and S106 UAS-dfoxo both uninduced. Boxplots – quantiles; whiskers – extremes; overlay – individual data points. N = 4, 3 (left to right), p = 1, unpaired two-sided t-test. d Uncropped images of the western-blot membranes shown in Fig.1c.
Extended Data Fig. 2
Extended Data Fig. 2. dfoxo-switch – additional lifespans, and climbing ability measurements.
a Driver-alone (S106) RU486-switch control lifespan. Control n = 150 dead/1 censored fly, switch n = 148 dead/0 censored flies, p = 0.69, log-rank test. b UAS-dfoxo alone RU486-switch control lifespan. Control n = 135 dead/2 censored flies, switch n = 136 dead/12 censored flies, p = 0.86, log-rank test. c Male driver-alone (S106) RU486- switch control lifespan. Control n = 126 dead/12 censored flies, RU486-switch n = 143 dead/6 censored flies, p = 0.49, log-rank test. d Male dfoxo-switch lifespan. Control n = 154 dead/6 censored flies, dfoxo-switch n = 142 dead/8 censored flies, p = 0.72, log-rank test. e TiGS>dfoxo-switch lifespan. Control n = 128 dead/3 censored flies, dfoxo-switch n = 141 dead/4 censored flies, p = 0.85, log-rank test. f S106>aopAct-switch lifespan. Control n = 145 dead/7 censored flies, aopAct-switch n = 147 dead/2 censored flies, p = 0.00274, log-rank test. g Experimental trials of the negative geotaxis assays of dfoxo-switch and control that were combined for the analysis presented in Fig. 1e. N = individual flies, boxplots – quantiles; whiskers – extremes; overlay – individual data points. Experiment 1: effect of dfoxo-switch p = 0.008, age p < 10–4, age-by-dfoxo-switch interaction p = 0.0008, mixed-effects LM. Experiment 2: effect of dfoxo-switch p > 0.05, age p < 10–4, age-by-dfoxo-switch interaction p = 0.033, mixed-effects LM. Experiment 3: effect of dfoxo-switch p > 0.05, age p < 10–4, age-by-dfoxo-switch interaction p = 0.07, mixed-effects LM. h Experimental trials of S106>dfoxo-switch lifespans used for the analyses presented in Fig 1f. Experimental trial 1: control n = 61 dead/0 censored flies, dfoxo-switch n = 76 dead/0 censored flies, p = 0.009, log-rank test. Experimental trial 2: shown in Fig. 1d. Experimental trial 3: control n = 145 dead/1 censored fly, dfoxo-switch n = 145 dead/1 censored fly, p = 1.72189 x 10⁻⁵, log-rank test. Experimental trial 4: control n = 125 dead/0 censored flies, dfoxo-switch n = 145 dead/2 censored flies, p = 6.05 x 10⁻⁹, log-rank test.
Extended Data Fig. 3
Extended Data Fig. 3. ATAC-Seq – additional information.
a Schematic distribution of the ATAC peaks on the four main Drosophila chromosomes. Additional peaks were detected on contigs and are not shown. b Violin plots showing the size of all ATAC peaks detected in the gut and fat body, and in the significantly differentially accessible peaks in the fat body. c Distribution of the distance of ATAC peaks from a transcriptional start site (TSS). Proportion of peaks in each distance category are presented from 5’ to 3’ relative to the TSS. d ATAC-qPCR of the levels of sequences near the MED1 locus where an ATAC-Seq peak opened by dfoxo-switch was detected, near Prosap where a peak unaltered by dfoxo-switch was detected, and Sox21b region which contained no peak in ATAC-Seq. Boxplots – quantiles; whiskers – extremes; overlay – individual data points. N = 3 biologically independent samples; effect of dfoxo-switch: MED1 p=0.00024, Prosap p=0.59, Sox21b p=0.76, pairwise comparisons with two-sided unpaired t-tests with pooled SD. e ATAC-qPCR signal intensity for regions near the Xbp1 locus within a peak detected by ATAC-Seq (3’end of the gene) or two regions within the promoter of Xbp1. The levels were normalized to Prosap. Boxplots – quantiles; whiskers – extremes; overlay – individual data points. N = 3 biologically independent samples, effect of region p = 0.0011, effect of dfoxo-switch p > 0.05, mixed effects LM.
Extended Data Fig. 4
Extended Data Fig. 4. dfoxo-switch dependence on chromatin remodelers – lifespan.
Lifespan curves of the switch in S106>dfoxo & RNAi (a) or S106>RNAi (b) with indicated RNAi lines. These were used to generate the analysis shown in Fig. 2e. P values are obtained comparing control vs RU486-switch conditions (after day 23, log-rank test). Detailed statistical analyses including number of flies per experiment are shown in Supplementary Data.
Extended Data Fig. 5
Extended Data Fig. 5. dfoxo-switch dependence on chromatin remodelers - climbing ability.
a Negative geotaxis assay of dfoxo-switch + mor RNAi at all ages, combining two independent trials. Effect of the switch p = 0.6, age p < 10–4, age-by-switch interaction p = 0.36, mixed-effects LM. b Negative geotaxis assay of dfoxo-switch + iswi RNAi at all ages. Effect of the switch p = 0.12, age p < 10–4, age-by-switch interaction p = 0.14, mixed-effects LM. c Negative geotaxis assay of mor RNAi switch at all ages. Effect of the switch p = 0.02, age p < 10–4, age-by-switch interaction p = 0.006, mixed-effects LM. d Negative geotaxis assays of iswi RNAi switch at all ages. Effect of the switch p = 0.62, age p < 10–4, age-by-switch interaction p = 0.49, mixed-effects LM. N – individual flies, boxplots – quantiles; whiskers – extremes; overlay – individual data points. The negative geotaxis assays of dfoxo-switch that were performed at the same time are shown in Extended Data Fig. 2g, experiments 2 and 3.
Extended Data Fig. 6
Extended Data Fig. 6. RNA-Seq – additional information.
a qPCR quantification of transcripts detected as differentially expressed in our RNA-Seq data (HDAC6, Pfk, Pepck1) in fat bodies after dfoxo-switch. Effect of dfoxo p = 0.0055, transcript p = 0.0386, and dfoxo-switch-by-transcript interactions p = 0.032, mixed effects LM. b qPCR quantifications of dfoxo-switch targets (MED1, HDAC6, Xbp1s, Pfrx) at week 7 in dfoxo-switch females. Effect of dfoxo-switch p = 0.0133, effect of transcript or dfoxo-switch-by-transcript interaction p > 0.05, mixed effects LM. N – biologically independent samples; boxplots – quantiles; whiskers – extremes; overlay – individual data points. c and d Overlaps of sets of differentially expressed genes between dfoxo-switch (red circles) and dfoxo-acute (grey circles) in the fat body and gut employing previously published gene lists. Overlap p-values from one-sided hypergeometric test. e Bar plot comparing the log2 fold change of the transcripts in common between the sets of genes differentially regulated by dfoxo-acute (meta analysis) and by dfoxo-switch. f qPCR quantifications of transcripts during acute induction of dfoxo in the fat body. HDAC6, Pfk, Xbp1s, Xbp1u were examined as they are all differentially expressed after dfoxo-switch in the fat body (RNA-Seq analysis and qPCR confirmation shown elsewhere). N – biologically independent samples; boxplots – quantiles; whiskers – extremes; overlay – individual data points. Effects of RU486, transcript or RU486-by-transcript interaction p > 0.05, mixed effects LM. g Activating/Repressing Function prediction in BETA applying one-tailed Kolmogorov-Smirnov test. Differentially accessible ATAC peaks explained transcriptional activation (p=2.97x10-46) and repression (p=0.028) after dfoxo-switch.
Extended Data Fig. 7
Extended Data Fig. 7. Additional GO terms enrichment analysis.
Top 5 GO terms and KEGG pathways for genes differentially expressed (DE) a exclusively after dfoxo-switch and b exclusively during dfoxo-acute induction in the fat body. Note that no significant GO enrichment was observed in the set of genes that are differentially expressed in both dfoxo-switch and dfoxo-acute.
Extended Data Fig. 8
Extended Data Fig. 8. Involvement of Xbp1 in the effects of dfoxo-switch – additional information.
a qPCR quantification of transcripts whose levels are increased after dfoxo-switch in fat bodies (Hsc70-4, Eip75b, kay) in female S106>Xbp1s fat bodies, with or without RU486 induction. Effect of RU486 p = 0.0088, effect of transcript or RU486-by-transcript interaction p > 0.05, mixed effects LM. b qPCR quantifications of the same transcripts in fat bodies after dfoxo-switch. Effect of RU486 p = 0.0001, effect of transcript or RU486- by-transcript interaction p > 0.05, mixed effects LM. N – biologically independent samples; boxplots – quantiles; whiskers – extremes; overlay – individual data points. c Survival of dfoxo-switch flies challenged with tunicamycin after 1 week of recovery (day 30; control n = 142 dead/0 censored, dfoxo-switch n = 129 dead/0 censored, p = 0.001, log-rank test). d Same for driver-alone (control n = 114 dead/0 censored, switch n = 131 dead/0 censored, p = 0.21, log-rank test). e Starvation assay of 30-day-old dfoxo-switch flies (control n = 142 dead/0 censored, dfoxo-switch n = 151 dead/0 censored, p = 0.67, log-rank test). f Same for driver-alone (control n = 149 dead/0 censored, switch n = 149 dead/0 censored, p = 0.07, log-rank test). g-j. Survival in the presence of tunicamycin a week after the switch in: S106>morRNAi (control n = 141 dead/1 censored, switch n = 154 dead/0 censored, p < 6x10⁻⁷, log-rank test), S106>iswiRNAi (control n = 146 dead/0 censored, switch n = 145 dead/0 censored, p = 0.60, log-rank test), S106>dfoxo morRNAi (control n = 140 dead/0 censored, switch n = 139 dead/0 censored, p < 8x10⁻⁷, log-rank test), S106>dfoxo iswiRNAi (control n = 153 dead/0 censored, switch n = 148 dead/0 censored, p = 0.079 log-rank test).
Extended Data Fig. 9
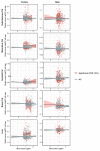
Extended Data Fig. 9. Age-related expression changes in the mouse – additional information.
Relationship between the expression changes triggered by dfoxo-switch in the fly fat body and the expression changes caused by ageing of their mouse orthologues (FDR 10%) in the functionally equivalent organs in the mouse. Points – genes; lines with shading – line of best fit and 95% CI; grey – those that are not significantly changed with age, red – those that are significantly changed with age. None of the organs show significant correlation between age-related change and dfoxo-switch change (p > 0.05, LM).
Fig. 1
Fig. 1. Transient expression of dfoxo in early adulthood extends subsequent lifespan.
a Experimental setup: 2-day-old S106>dfoxo females were placed on food containing RU486 to induce dfoxo expression until day 23 when they were placed back on food without RU486 (dfoxo-switch flies, red arrow). Their sisters were not fed RU486 at any time (grey arrow). b Western-blot quantifications of gut or fat body dFOXO during induction (day 7) and one week after (day 30). Boxplot – quantiles; whiskers – extremes; overlay – individual data points. N = 4 biologically independent samples; day 7: effect of RU486 p = 0.035, tissue p = 0.0018, RU486-by-tissue interaction p = 0.33; day 30: RU486 p = 0.169, tissue p = 0.048, interaction p = 0.13; linear model (LM). C Representative western blots against dFOXO and Actin. * non-specific binding by dFOXO antibody in fat body samples. FB – fat body, G – gut. Same-day samples on the same membrane, sequentially probed with anti-dFOXO and anti-Actin. Image source data – Extended data Fig. 1d. d dfoxo-switch lifespan. Control n = 139 dead/3 censored flies, dfoxo-switch n = 141 dead/4 censored flies, p = 2 × 10⁻¹⁰, log-rank test. e Height climbed by dfoxo-switch compared to control females, from day 23, pooled from three independent trials. Individual trials – Extended data Fig. 2g. N – individual flies; boxplots – quantiles; whiskers – extremes; overlay – individual data points. Effect of dfoxo-switch p = 0.5648, age p < 10–4, age-by-dfoxo-switch interaction p = 0.0118, mixed-effects LM. f Hazard ratios (HRs) – points, and 95% confidence intervals (CI) – whiskers, from a mixed-effects Cox Proportional Hazards (CPH) model on the combined events (985 dead, 9 censored) from four independent trials. Individual trials – Extended data Fig. 2h. HRs < 1 indicate switched flies exhibit lower risk of death compared to uninduced controls. Detailed statistical analyses for b and f are shown in Supplementary Data.
Fig. 2
Fig. 2. dfoxo-switch induces persistent changes in chromatin structure and requires chromatin remodellers for longevity.
a tSNE plots generated from the intensities of all detected ATAC peaks in foxo-switch and control fat bodies and guts, after variance stabilizing transformation (VST). b Venn diagram showing overlap between fat body ATAC peaks with significantly altered accessibility after dfoxo-switch (81 peaks) and previously described dFOXO-bound ChIP peaks (1361 peaks, p = 0.008, one-sided permutation test). c Δdfoxo S106>dfoxo switch lifespans. Control n = 139 dead/4 censored flies, dfoxo-switch n = 136 dead/9 censored flies, p = 1.95 × 10⁻¹⁹, log-rank test. d Proportion of histone modification ChIP datasets deposited in ChIP-atlas, classified as underpinning gene activation, repression, or other, for the datasets where the ChIP peaks significantly overlap (10% FDR) our ATAC peaks that show differential accessibility caused by dfoxo-switch (right bar; 89 marking activation, 22 repression and 8 other) or those for which this overlap is not significant (left bar; 702 marking activation, 545 repression and 98 other), p = 5.893 × 10⁻⁶, Pearson's Chi–squared test. See also Supplementary Data. e HRs – points, and 95% CIs – whiskers, indicate the relative risk of death in switched flies compared to their uninduced sisters after day 23 and were determined for dfoxo-switch when dfoxo is induced in the presence of RNAi constructs targeting the indicated genes (right) or the same RNAi constructs transiently expressed on their own (left). HRs < 1 indicate a lower risk of death compared to uninduced controls, HRs > 1, the opposite. P value for HRs being significantly different from 1, CPH models. Grey vertical area highlights the results for mor, osa and iswi. Individual lifespans and demographic details - Extended data Fig. 4 and Supplementary Data.
Fig. 3
Fig. 3. A unique transcriptional programme is triggered in the fat body by dfoxo- switch
a Volcano plots showing the effect of dfoxo-switch on transcripts in the fat body and the gut with differentially expressed genes (FDR 10%) shown in red. b Overlaps of differentially expressed genes between the effects of dfoxo-switch and acute dfoxo induction in the fat body and gut. Differential expression in dfoxo-acute set is based on a meta-analysis of two previously described datasets that profiled the transcriptome during dFOXO induction (essentially day 7). Overlap p-values from one-sided hypergeometric test. c Heatmaps of dfoxo-switch gene – dfoxo-switch peak pairs assigned with BETA. The left shows ATAC-seq and the right RNA-seq signal intensities (after VST and scaling to the control condition for each peak/gene). Each column is a biologically independent sample. Genes down-regulated in RNA-Seq are presented at the bottom.
Fig. 4
Fig. 4. dfoxo-switch flies exhibit a distinct metabolic profile.
a. Top 5 GO terms and KEGG pathways for all the genes differentially expressed after dfoxo-switch in the fat body. See Supplementary Data. b Relative changes in metabolites comparing females after dfoxo-switch with their controls. Identified metabolites are labelled and marked in red. See Supplementary Data. c Metabolic map highlighting the enzymes with significant changes in mRNA levels after dfoxo-switch (red lines) and significantly altered, identified metabolites (grey and red dots). The pathways in which both differentially expressed genes and altered metabolites are involved are annotated. d Pfk-reverse switch lifespan. S106>Pfk females were fed food containing RU486 chronically or from day 23 (reverse switch). Control n = 127 dead/10 censored flies, Pfk-reverse switch n = 119 dead/3 censored flies, p = 0.03 vs control, log-rank test, Pfk-chronic n= 127 dead/10 censored flies p = 0.007 vs control, log-rank test. e Pepck1-reverse switch lifespan. S106>Pepck1 females were fed food containing RU486 chronically or from day 23 (reverse switch). Control n = 141 dead/5 censored flies, Pepck1-reverse switch n = 115 dead/5 censored flies, p = 0.97 vs control, log-rank test, Pepck1-chronic n= 91 dead/4 censored flies p = 0.46 vs control, log-rank test.
Fig. 5
Fig. 5. Xbp1 activation accounts for longevity resulting from dfoxo-switch.
a The three top-ranked motifs identified as enriched within the promoters of genes differentially expressed after dfoxo-switch in the fat body. Underlined – ACGT core sequence bound by Xbp1; NES – Normalised Enrichment Score. b qPCR quantifications of Xbp1s and Xbp1u transcripts in dfoxo-switched fat bodies at day 30. N – biologically independent samples; boxplots – quantiles; whiskers – extremes; overlay – individual data points. Effect of dfoxo-switch p < 7×10⁻⁴, effects of transcript or dfoxo-switch-by-transcript interaction p > 0.05, mixed effects LM. xc Overlap of differentially expressed genes between dfoxo-switch in the fat body and Xbp1 mutant larvae. Overlap p-value from one-sided hypergeometric test. d HRs - points, and 95% CI – whiskers, from CHP models showing the relative risk of death during tunicamycin feeding initiated after a week of recovery from dfoxo-switch or dfoxo-switch co-induced with RNAi against mor or iswi. HR < 1 indicates a lower risk of death compared to uninduced controls. P value from CPH models. See Extended data Fig. 7g-j. e qPCR quantifications of Xbp1s and Xbp1u in fat bodies a week after dfoxo-switch or dfoxo-switch performed together with induction of mor or iswi RNAi. N – biologically independent samples; boxplots – quantiles; whiskers – extremes; overlay – individual data points. Effect of dfoxo-switch p = 0.035, dfoxo + iswiRNAi-switch p>0.05, dfoxo + morRNAi-switch p < 4×10⁻⁴; effects of transcript or switch-by-transcript interaction p > 0.05; mixed effects LMs. f Lifespans of S106>Xbp1RA females fed food containing RU486 chronically or from day 23 (reverse switch). Control n = 105 dead/1 censored flies; Xbp1RA-reverse switch n = 106 dead/1 censored flies p = 0.021 vs control, log-rank test; Xbp1RA-chronic n = 138 dead/2 censored flies p = 0.0265 vs control, log-rank test. g Lifespans of S106>Xbp1S females. Control n = 145 dead/3 censored flies; Xbp1S-reverse switch n = 143 dead/0 censored flies, p = 6.03 × 10⁻⁵ vs control, log-rank test; Xbp1S-chronic n = 154 dead/0 censored flies p = 0.0001 vs control, log-rank test.
Fig. 6
Fig. 6. dfoxo-switch counteracts age-related transcriptional dysregulation.
a Relationship between log2Fold Change (FC) in gene expression caused by ageing and dfoxo-switch in Drosophila fat body, for genes differentially regulated by both dfoxo-switch and age. β = -8.23, p < 2.2 x10⁻¹⁶, LM. b Relationship between FC in gene expression caused by ageing and xbp1 null mutant (xbp1-/-), for genes differentially regulated by both xbp1-/- and age. β = -8.64, p = 0.00589, LM. Points – individual genes; line – line of best fit, shaded – 95% CI for the line. c Overlaps of mouse orthologues of genes differentially expressed after dfoxo-switch in flies and genes differentially expressed with age in the mouse. Grey – mouse genes that show age-related expression changes, red – mouse orthologues of fly genes that are differentially expressed after dfoxo-swich in the fat body. P-values from one-sided hypergeometric tests.

References

    1. Spitz F, Furlong EE. Transcription factors: from enhancer binding to developmental control. Nature reviews genetics. 2012;13:613–626. - PubMed
    1. Lasko P. Patterning the Drosophila embryo: A paradigm for RNA-based developmental genetic regulation. Wiley Interdisciplinary Reviews: RNA. 2020;11:e1610. - PMC - PubMed
    1. Webb AE, Brunet A. FOXO transcription factors: key regulators of cellular quality control. Trends in biochemical sciences. 2014;39:159–169. - PMC - PubMed
    1. Latchman DS. Transcription factors: an overview. The international journal of biochemistry & cell biology. 1997;29:1305–1312. - PubMed
    1. D’Urso A, Brickner JH. Epigenetic transcriptional memory. Current genetics. 2017;63:435–439. - PMC - PubMed

Publication types

LinkOut - more resources