. 2022 Dec;2(12):1145-1158.
doi: 10.1038/s43587-022-00308-7. Epub 2022 Dec 1.

Sexual identity of enterocytes regulates autophagy to determine intestinal health, lifespan and responses to rapamycin

Affiliations

Sexual identity of enterocytes regulates autophagy to determine intestinal health, lifespan and responses to rapamycin

Jennifer C Regan et al. Nat Aging. 2022 Dec.

Abstract

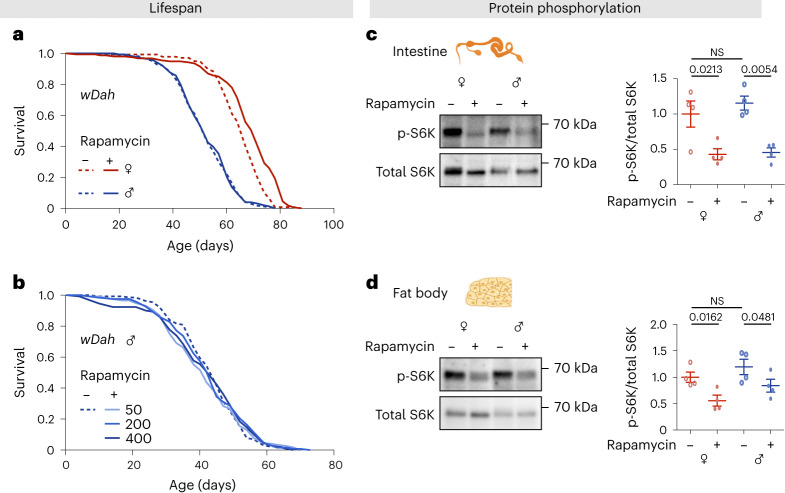
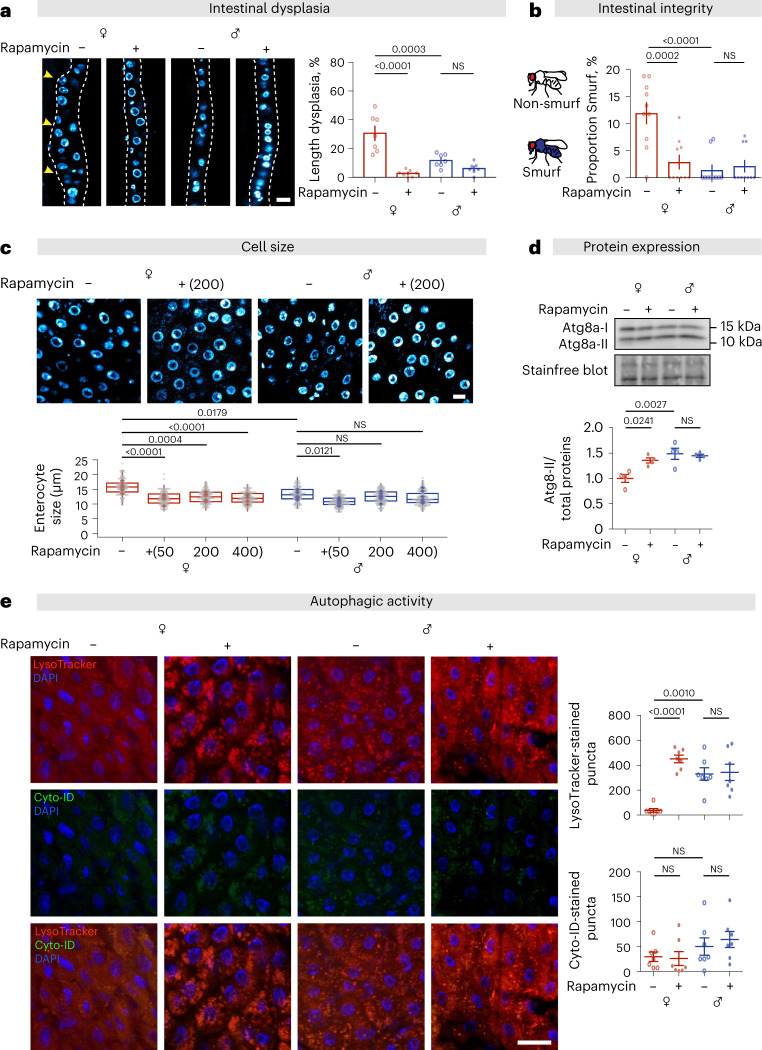
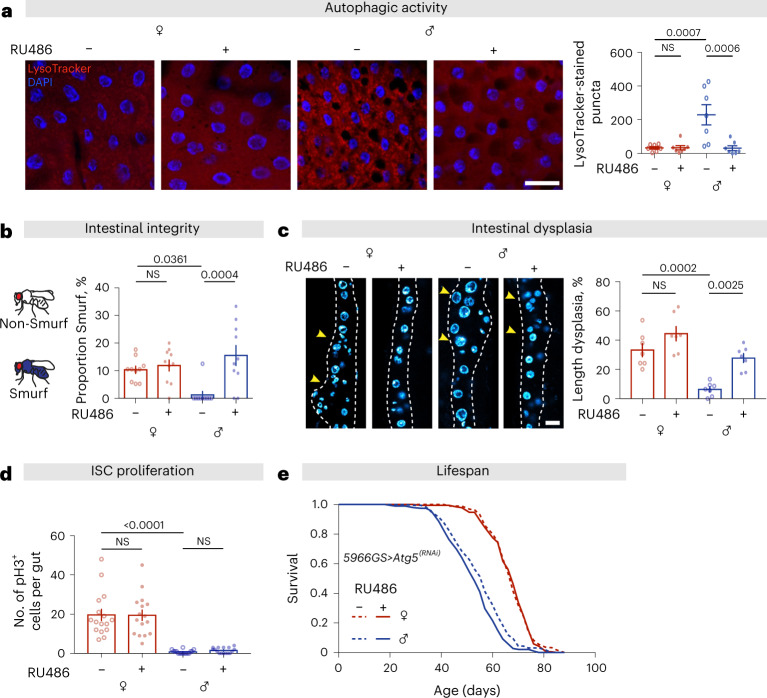
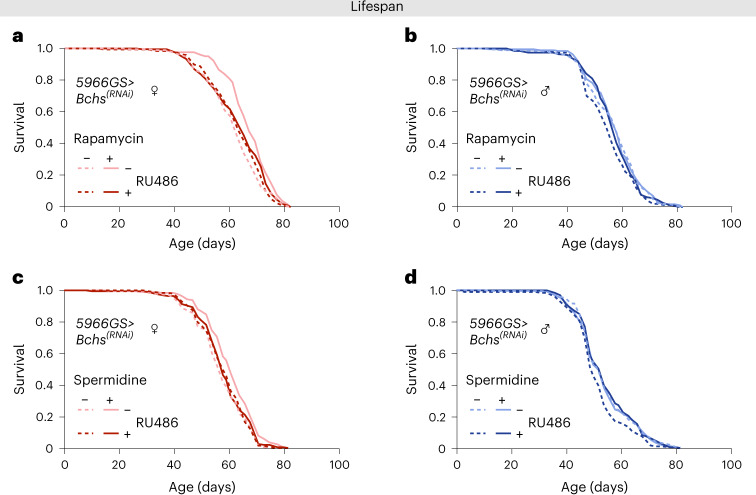
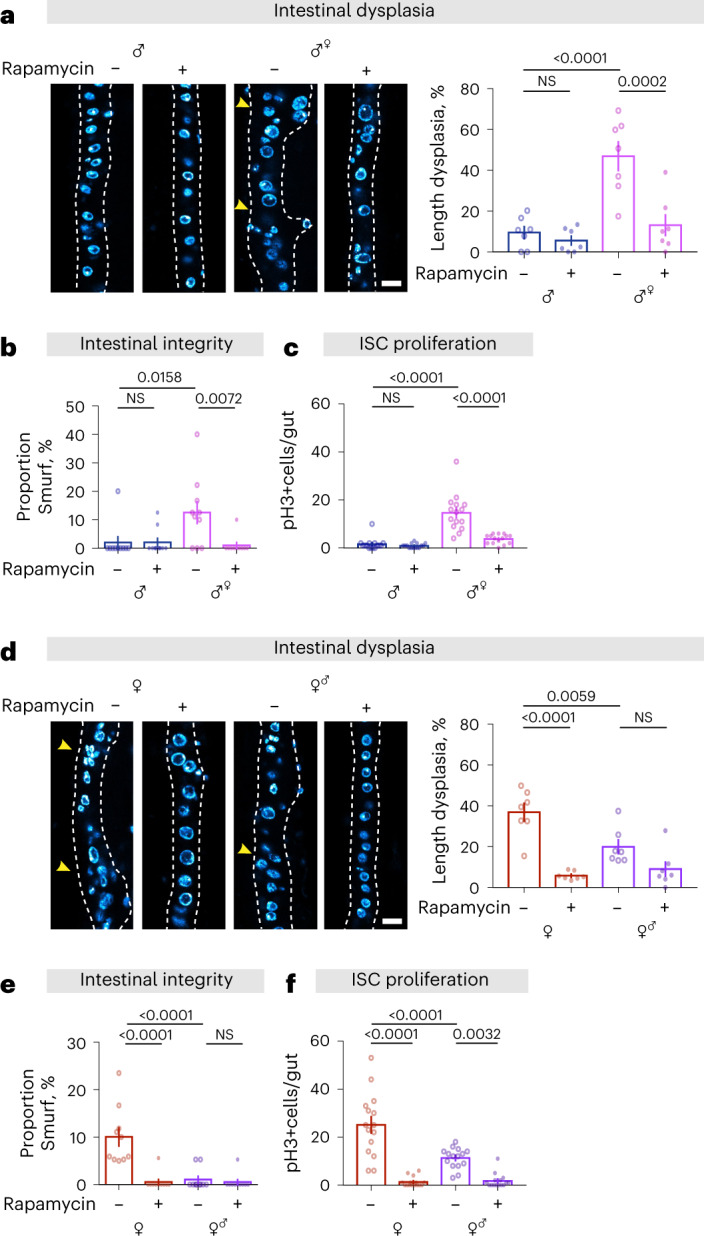
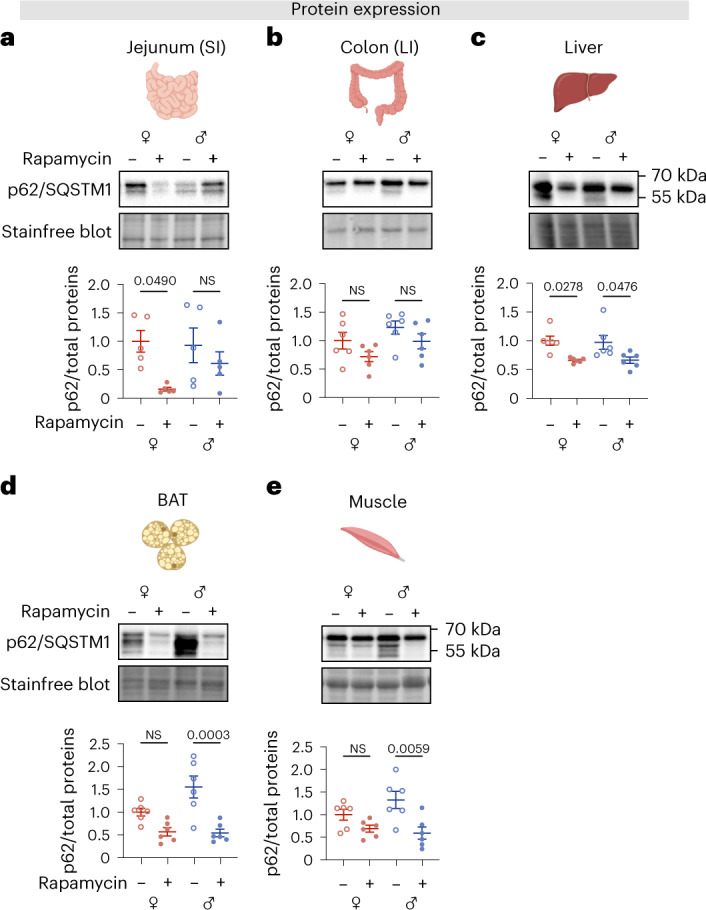
Pharmacological attenuation of mTOR presents a promising route for delay of age-related disease. Here we show that treatment of Drosophila with the mTOR inhibitor rapamycin extends lifespan in females, but not in males. Female-specific, age-related gut pathology is markedly slowed by rapamycin treatment, mediated by increased autophagy. Treatment increases enterocyte autophagy in females, via the H3/H4 histone-Bchs axis, whereas males show high basal levels of enterocyte autophagy that are not increased by rapamycin feeding. Enterocyte sexual identity, determined by transformerFemale expression, dictates sexually dimorphic cell size, H3/H4-Bchs expression, basal rates of autophagy, fecundity, intestinal homeostasis and lifespan extension in response to rapamycin. Dimorphism in autophagy is conserved in mice, where intestine, brown adipose tissue and muscle exhibit sex differences in autophagy and response to rapamycin. This study highlights tissue sex as a determining factor in the regulation of metabolic processes by mTOR and the efficacy of mTOR-targeted, anti-aging drug treatments.


Conflict of interest statement

The authors declare no competing interests.

Figures

Fig. 1
Fig. 1. Rapamycin treatment extends lifespan in wDah females only but reduces phosphorylation of S6K in both sexes.
a, Adult-onset rapamycin treatment (200 µM) extended the lifespan of wDah females, but not males (log-rank test, females P = 2.1E-06, males P = 0.77, n = 143–171 flies per condition). See also Supplementary Table 1. b, Adult-onset rapamycin treatment at three concentration (50, 200 and 400 µM) did not extend the lifespan of wDah males (log-rank test, 50 µM P = 0.60, 200 µM P = 0.75, 400 µM P = 1, n = 118–131 flies per condition). See also Supplementary Table 2. c,d, The level of p-S6K in the intestine and the fat body was substantially reduced by rapamycin treatment (200 µM) in both females and males at 10 days of age (n = 4 biological replicates of 10 intestines per replicate, two-way analysis of variance (ANOVA), interaction P > 0.05; post-hoc test). Data are presented as mean values ± standard error of the mean (s.e.m.). NS, not significant. Source data
Fig. 2
Fig. 2. Rapamycin treatment reduces age-related gut pathology and enterocyte size and elevates autophagy and barrier integrity in wDah females, but not in males.
a, Females showed greater age-related dysplasia in aged guts, which was attenuated by rapamycin treatment (200 µM), at 50 days of age (scale bar = 15 µm; n = 7 intestines, two-way ANOVA, interaction ***P < 0.001; post-hoc test). b, A higher number of female flies suffered barrier function decline (Smurf phenotype) than did males, and showed increased barrier function in response to rapamycin (200 µM), at 60 days of age (bar charts show n = 10 biological replicates of 10–19 flies per replicate, two-way ANOVA, interaction P < 0.001; post-hoc test). c, Cell size of enterocytes in females was larger than in males, and reduced to the same size as in males in response to rapamycin treatment (50, 200 and 400 µM), at 10 days of age (scale bar = 10 µm; n = 6–8 intestines, n = 10–20 enterocytes per intestine; circles indicate individual values, and diamonds represent the average value per intestine; linear mixed model, interaction P < 0.01; post-hoc test). d, The expression of Atg8a-II in the gut of females was lower than in males, and rapamycin treatment (200 µM) increased it to a similar level as in males, at 10 days of age (n = 4 biological replicates of 10 intestines per replicate, two-way ANOVA, interaction P < 0.01; post-hoc test). e, The number of LysoTracker-stained puncta in the gut of females was lower than in males, and rapamycin (200 µM) increased it to the level measured in males. Neither sex nor rapamycin had an effect on the number of Cyto-ID-stained puncta in the intestine, at 10 days of age (scale bar = 20 µm; n = 7 intestines per condition; n = 2-3 pictures per intestine; data points represent the average value per intestine; linear mixed model, interaction LysoTracker-stained puncta, P < 0.001, Cyto-ID-stained puncta, P > 0.05; post-hoc test). Data are presented as mean values ± s.e.m. For box-and-whiskers plot (c), median, 25th and 75th percentiles, and Tukey whiskers are indicated. Source data
Fig. 3
Fig. 3. Autophagy in gut enterocytes regulates gut pathologies and lifespan.
a, Adult-onset knockdown of Atg5 in adult ECs (5966GS > Atg5[RNAi]) did not affect the number of LysoTracker-stained puncta in the gut of females, but decreased it in the gut of males to the level observed in females, at 20 days of age (scale bar = 20 µm; n = 7 intestines per condition; n = 2–3 pictures per intestine, data points represent the average value per intestine; linear mixed model, interaction P < 0.01; post-hoc test). b, Females had higher gut leakiness (number of Smurfs) than males, and adult-onset knockdown of Atg5 in adult ECs in males significantly increased it, to the level observed in females, at 60 days of age (bar charts show n = 10 biological replicates of 8–20 flies per replicate, two-way ANOVA, interaction P < 0.01; post-hoc test). c, Adult-onset knockdown of Atg5 in adult ECs did not affect the level of dysplasia in the gut of females, but increased it in the gut of males to the level observed in females, at 50 days of age (scale bar = 15 µm; n = 7 intestines, two-way ANOVA, interaction P > 0.05; post-hoc test). d, Adult-onset knockdown of Atg5 in adult ECs did not change the number of pH3+ cells in either females or males, at 20 days of age (n = 16 intestines, two-way ANOVA, interaction P > 0.05; post-hoc test). e, Adult-onset knockdown of Atg5 in adult ECs shortened lifespan of males, but not females (log-rank test, females P = 0.80, males P = 4.5 × 10⁻³, n = 199 flies per condition). See also Supplementary Table 4. Data are presented as mean values ± s.e.m. Source data
Fig. 4
Fig. 4. Bchs is a required target for autophagy activation, lifespan extension and intestinal homeostasis from the mTORC1–histone axis.
a, Knockdown of Bchs in ECs of adult females had no effect on lifespan, but it abolished the increase in lifespan in response to rapamycin (long-rank test, control versus RU486 P = 0.40, rapamycin versus rapamycin+RU486 P = 0.0065, n = 198–199 flies per condition). b, Knockdown of Bchs in ECs of adult males shortened lifespan (long-rank test, control versus RU486 P = 0.0095, n = 198-200 flies per condition). c, Knockdown of Bchs in ECs of adult females had no effect on lifespan but abolished the increase in lifespan in response to spermidine (long-rank test, control versus RU486 P = 0.54, spermidine versus spermidine + RU486 P = 0.012, n = 198–199 flies per condition). d, Knockdown of Bchs in enterocytes of adult males shortened lifespan (long-rank test, control versus RU486 P = 0.023, n = 199 flies per condition). See also Supplementary Tables 5 and 6. Source data
Fig. 5
Fig. 5. Cell-autonomous sexual identity in enterocytes dictates the levels of autophagy, histones and Bchs expressions in response to rapamycin treatment.
a, Feminization of male guts by expression of traF in ECs reduced the number of LysoTracker-stained puncta in the gut, and it restored the response to rapamycin treatment (200 µM) at 10 days of age (control male mexG4 > + vs feminized male mexG4 > traF; scale bar = 20 µm; n = 7 intestines per condition; n = 2–3 pictures per intestine, data points represent the average value per intestine; linear mixed model, interaction P < 0.05; post-hoc test). b, Masculinization of female guts by knockdown of traF in ECs increased the number of LysoTracker-stained puncta in the gut, and abolished the response to rapamycin treatment (200 µM), at 10 days of age (control female mexG4 > + vs masculinized female mexG4 > traF [RNAi]; scale bar = 20 µm; n = 7 intestines per condition; n = 2–3 pictures per intestine, data points represent the average value per intestine; linear mixed model, interaction P < 0.05; post-hoc test). c, Expression of histones H3 and H4 in the gut of feminized males was lower than in males, and rapamycin treatment (200 µM) increased it to the level in males, at 10 days of age (n = 3–4 biological replicates of 10 intestines per replicate, two-way ANOVA, H3 and H4, interaction P < 0.05; post-hoc test). d, Expression of Bchs in the gut of feminized males did not significantly lower than in males, whereas rapamycin treatment (200 µM) increased it to the level in males, at 10 days of age (n = 4 biological replicates of 10 intestines per replicate, two-way ANOVA, interaction P < 0.05; post-hoc test). e,f, Expression of histones H3, H4 and Bchs in the gut of masculinized females did not differ significantly from that in females, and we did not detect an increase upon rapamycin treatment (200 µM), at 10 days of age (n = 4 biological replicates of 10 intestines per replicate, two-way ANOVA, H3 and H4, interaction P > 0.05; Bchs, interaction P < 0.05; post-hoc test). Data are presented as mean values ± s.e.m. Source data
Fig. 6
Fig. 6. Cell-autonomous sexual identity in enterocytes mediates age-related gut pathology, barrier function and ISC mitoses in response to rapamycin treatment.
a, Feminization of male guts by expression of traF in ECs increased intestinal dysplasia, which was attenuated by rapamycin treatment (200 µM), at 50 days of age (control male mexG4 > + vs feminized male mexG4 > traF; scale bar = 15 µm; n = 7 intestines per condition; two-way ANOVA, interaction P < 0.01; post-hoc test). b, Feminization of male guts by expression of traF in ECs increased gut leakiness (number of Smurfs), which was attenuated by rapamycin treatment (200 µM), at 60 days of age. Bar charts show with n = 10 biological replicates of 6–12 flies per replicate (two-way ANOVA, interaction P < 0.05; post-hoc test). c, Feminization of male guts by expression of traF in ECs increased the number of pH3+ cells, which was attenuated by rapamycin treatment (200 µM), at 20 days of age (n = 15 intestines per condition; two-way ANOVA, interaction P < 0.001; post-hoc test). d, Masculinization of female guts by knockdown of traF in ECs decreased intestinal dysplasia, with no further decrease when combined with rapamycin treatment (200 µM), at 50 days of age (control female mexG4 > + vs masculinized female mexG4 > traF [RNAi]; scale bar = 15 µm; n = 7 intestines per condition; two-way ANOVA, interaction P < 0.01; post-hoc test). e, Masculinization of female guts by knockdown of traF in ECs decreased gut leakiness, which was not further decreased by the combination of rapamycin treatment (200 µM), at 60 days of age. Bar charts show with n = 10 biological replicates of 1,520 flies per replicate (two-way ANOVA, interaction P < 0.001; post-hoc test). f, Masculinization of female guts by knockdown of traF in ECs decreased the number of pH3+ cells, which was further decreased by combination with rapamycin treatment (200 µM), at 20 days of age (n = 15 intestines per condition; two-way ANOVA, interaction P < 0.001; post-hoc test). Data are presented as mean values ± s.e.m. Source data
Fig. 7
Fig. 7. Cell-autonomous sexual identity in enterocytes influences fertility, and it mediates extension of lifespan in response to rapamycin treatment.
ac, Feminization of male guts by expression of traF in ECs did not significantly affect the number of progeny, whereas masculinization of female guts by knock-down of traF in ECs reduced the number of progeny (control male mexG4 > + vs feminized male mexG4 > traF, control female mexG4 > + vs masculinized female mexG4 > traF [RNAi]; n = 10 biological replicates of 3 males and 3 females per replicate; two-tailed Student’s t-test, NS P > 0.05, *P < 0.05 (a); or two-way ANOVA, treatment P > 0.05 (b); two-way ANOVA, treatment P < 0.01 (c). d, Feminization of male guts by expression of traF in ECs extended lifespan in response to rapamycin treatment (200 µM) (log-rank test, P = 1.55 × 10⁻⁶, mexG4 > traF control versus mexG4 > traF Rapamycin, n = 198–199 flies per condition). See also Supplementary Table 7. e, Masculinization of female guts by knock-down of traF in ECs extended lifespan, which was not further extend by rapamycin treatment (200 µM) (log-rank test, P = 1.56 × 10⁻⁹ mexG4 > + control versus mexG4 > traF [RNAi] control, n = 199 flies per condition). See also Supplementary Table 8. Data are presented as mean values ± s.e.m. Source data
Fig. 8
Fig. 8. Sex differences in basal autophagy levels and responses to rapamycin are detected in mouse tissues.
ae, The expression of p62/SQSTM1 in the jejunum (small intestine (SI)), colon (large intestine (LI)), liver, BAT and muscle of female and male mice. a, Rapamycin induced a significant reduction of p62/SQSTM1 protein level in jejunums in females that was not detected in males (n = 5 biological replicates of one mouse per replicate, two-way ANOVA, treatment P < 0.05, sex P = 0.37, interaction P = 0.23, post-hoc test). b, Higher basal level of p62/SQSTM1 in males detected by two-way ANOVA, whereas rapamycin induced similar reductions in p62/SQSTM1 in the two sexes (n = 6 biological replicates of one mouse per replicate, two-way ANOVA, treatment P < 0.05, sex P < 0.05, interaction P = 0.81, post-hoc test). c, Rapamycin markedly reduced p62/SQSTM1 protein level in the liver of both sexes (n = 6 biological replicates of one mouse per replicate, two-way ANOVA, treatment P < 0.001, sex P = 0.87, interaction P = 0.86, post-hoc test). d,e, Rapamycin significantly reduced p62/SQSTM1 protein level in the BAT and muscle of males (n = 6 biological replicates of one mouse per replicate, two-way ANOVA, BAT: treatment P < 0.0001, sex P = 0.08, interaction P = 0.05, post-hoc test; muscle: treatment P < 0.01, sex P = 0.41, interaction P = 0.14, post-hoc test). All mice were sacrificed and tissues were collected at 12 months of age. Data are presented as mean values ± s.e.m. Source data
Extended Data Fig. 1
Extended Data Fig. 1. Rapamycin treatment extends lifespan in wDah females.
Adult-onset rapamycin treatment in all three tested concentration (50, 200 and 400 µM) extended the median lifespan of wDah females. (log-rank test, 50 µM p = 9.0E-08, 200 µM p = 1.2E-03, 400 µM p = 0.04, n = 118-150 flies per condition). See also Supplementary Table 2. Source data
Extended Data Fig. 2
Extended Data Fig. 2. Rapamycin treatment extends lifespan in Dah and DGRP females only.
a, Adult-onset rapamycin treatment (200 µM) extended the lifespan of Dah females but not males (log-rank test, females p = 0.039, males p = 0.73, n = 188-201 flies per condition). b, Adult-onset rapamycin treatment (200 µM) extended the lifespan of females but not males of an outbred, genetically heterogenous fly line (DGRP-OX) (log-rank test, females p = 0.010, males p = 0.23, n = 181-189 flies per condition). See also Supplementary Table 3. Source data
Extended Data Fig. 3
Extended Data Fig. 3. Rapamycin treatment reduces phosphorylation of S6K in both sexes.
a,b, The level of phospho-S6K in the intestine and the fat body was substantially reduced by rapamycin treatment (200 µM) both in females and males, at 45 days of age (n = 4 biological replicates of 10 intestines per replicate, two-way ANOVA, interaction p > 0.05; post-hoc test). Data are presented as mean values  ± s.e.m. Source data
Extended Data Fig. 4
Extended Data Fig. 4. Rapamycin treatment reduces ISC mitoses in wDah females but not in males.
a,b, Rapamycin treatment (200 µM) reduced the number of pH3 + cells in females, to a similar level as in untreated males, while it did not affect the number of pH3 + cells in males, (a) at 10 days of age, and (b) at 50 days of age (10 days n = 15-24 intestines, 50 days n = 10-12 intestines, two-way ANOVA, interaction 10 days p < 0.001, 50 days p < 0.01; post-hoc test). Data are presented as mean values ± s.e.m. Source data
Extended Data Fig. 5
Extended Data Fig. 5. The microbiome does not change upon treatment with rapamycin.
a, Bacterial load in intestines of wDah flies changed with age and sex, but was not affected by rapamycin treatment (200 µM) (n = 4 biological replicates of 10 intestines per replicate, three-way ANOVA, age p < 0.001, sexes p < 0.001, treatment p > 0.05). Data are presented as mean values ± s.e.m. b, Bacterial composition in intestines of wDah flies changed with age and sex, but was not affected by rapamycin treatment (200 µM). (n = 4 biological replicates of 10 intestines per replicate, PERMANOVA (the number of permutations = 999), treatment p > 0.05). Source data
Extended Data Fig. 6
Extended Data Fig. 6. Rapamycin treatment increases expression of histone H3, histone H4 and Bchs in intestines of females but not in males.
a, The expression of histones H3 and H4 in intestines of wDah females was lower than in males, and rapamycin treatment (200 µM) increased it, at 10 days of age (n = 4 biological replicates of 10 intestines per replicate, two-way ANOVA, H3, interaction p < 0.05, H4, interaction p < 0.001; post-hoc test). b, The expression of Bchs in intestines of wDah females was lower than in males, and rapamycin treatment (200 µM) increased it, at 10 days of age (n = 4 biological replicates of 10 intestines per replicate, two-way ANOVA, interaction p > 0.05; post-hoc test). Data are presented as mean values ± s.e.m. Source data
Extended Data Fig. 7
Extended Data Fig. 7. Expression of traF is necessary but not sufficient for the larger enterocyte size in female intestines.
a, Expression of traF in ECs in males did not affect cell size, neither did treatment with rapamycin (200 µM), at 20 days of age (control male mexG4 > + vs feminised male mexG4 > traF; scale bar = 10 µm; n = 6-8 intestines, n = 20-25 enterocytes per intestine, circles indicate individual values and diamonds represent the average value per intestine; linear mixed model, interaction p > 0.05; post-hoc test). b, Knock-down of traF in ECs in females reduced the size of enterocytes to the level of rapamycin-treated females, which was not further reduced by rapamycin treatment (200 µM), at 20 days of age (control female mexG4 > + vs masculinized female mexG4 > traF [RNAi]; scale bar = 10 µm; n = 6-8 intestines, n = 17-23 enterocytes per intestine, circles indicate individual values and diamonds represent the average value per intestine; linear mixed model, interaction p < 0.01; post-hoc test). For box-and-whiskers plots, Median, 25th and 75th percentiles, and Tukey whiskers are indicated. Source data
Extended Data Fig. 8
Extended Data Fig. 8. Over-expression of histones in enterocytes reduces fertility.
a-c, Over-expression of Histones H3/H4 in adult ECs in females (5966GS > H3/H4) reduced the number of progeny, both in flies fed control food (1x SYA) and those fed food with a doubled yeast content (2x SYA) (n = 10 biological replicates of 3 males and 3 females per replicate, (a) students t test, *p < 0.05; (b,c) two-way ANOVA, treatment p < 0.001). Data are presented as mean values ± s.e.m. Source data
Extended Data Fig. 9
Extended Data Fig. 9. Dimorphic responses to rapamycin in mice tissues.
a-c, The expression of p62/SQSTM1 in the heart, kidney, and spleen of female and male mice (n = 6 biological replicates of one mouse per replicate, two-way ANOVA, Heart: treatment p < 0.01, sex p = 0.64, interaction p = 0.74, post-hoc test; Kidney: treatment p < 0.05, sex p = 0.91, interaction p = 0.25, post-hoc test; Spleen: treatment p = 0.13, sex p = 0.66, interaction p = 0.57, post-hoc test). All mice were sacrificed and tissues were collected at 12 months of age. Data are presented as mean values ± s.e.m. Source data

Similar articles

Cited by

References

    1. Xirocostas ZA, Everingham SE, Moles AT. The sex with the reduced sex chromosome dies earlier: a comparison across the tree of life. Biol. Lett. 2020;16:20190867. doi: 10.1098/rsbl.2019.0867. - DOI - PMC - PubMed
    1. Lemaitre JF, et al. Sex differences in adult lifespan and aging rates of mortality across wild mammals. PNAS. 2020;117:8546–8553. doi: 10.1073/pnas.1911999117. - DOI - PMC - PubMed
    1. Austad SN. Why women live longer than men: sex differences in longevity. Gend. Med. 2006;3:79–92. doi: 10.1016/S1550-8579(06)80198-1. - DOI - PubMed
    1. Hagg, S. & Jylhava, J. Sex differences in biological aging with a focus on human studies. eLife10, 10.7554/eLife.63425 (2021). - PMC - PubMed
    1. Mauvais-Jarvis F, Arnold AP, Reue K. A guide for the design of pre-clinical studies on sex differences in metabolism. Cell Metab. 2017;25:1216–1230. doi: 10.1016/j.cmet.2017.04.033. - DOI - PMC - PubMed

Publication types

LinkOut - more resources