. 2023 Apr 28;23(1):782.
doi: 10.1186/s12889-023-15649-0.

Assessing the accuracy of California county level COVID-19 hospitalization forecasts to inform public policy decision making

Affiliations

Assessing the accuracy of California county level COVID-19 hospitalization forecasts to inform public policy decision making

Lauren A White et al. BMC Public Health. .

Abstract

Background: The COVID-19 pandemic has highlighted the role of infectious disease forecasting in informing public policy. However, significant barriers remain for effectively linking infectious disease forecasts to public health decision making, including a lack of model validation. Forecasting model performance and accuracy should be evaluated retrospectively to understand under which conditions models were reliable and could be improved in the future.

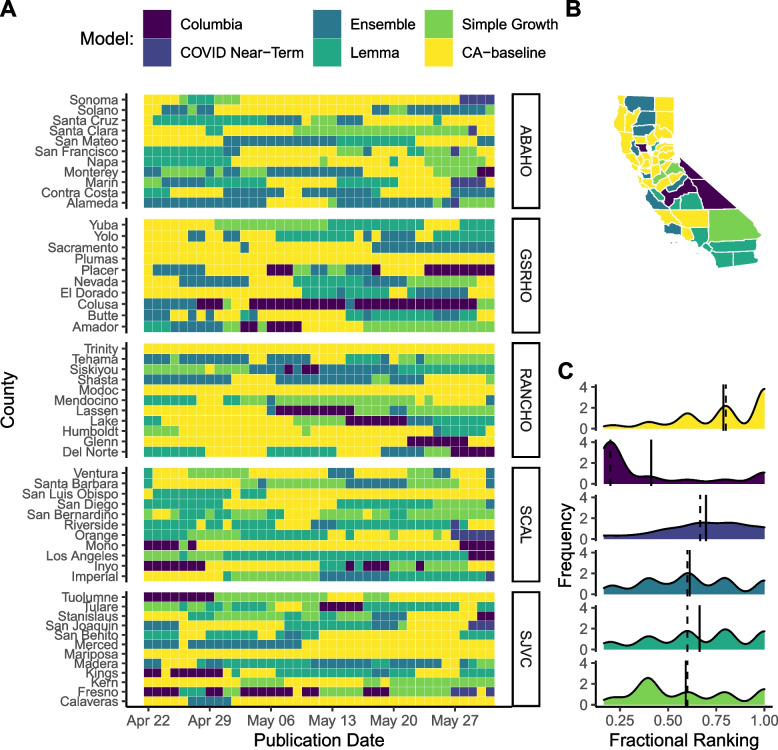
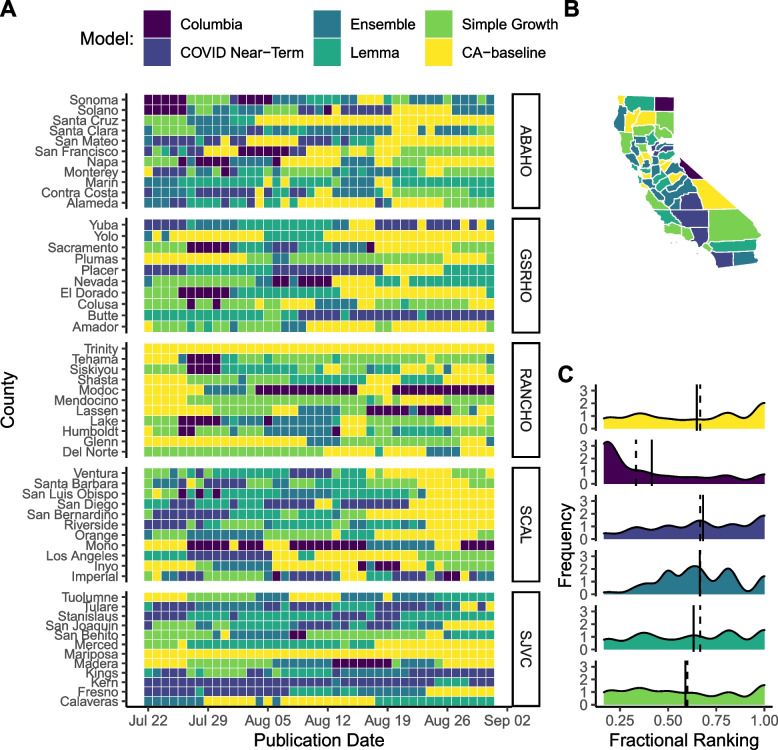
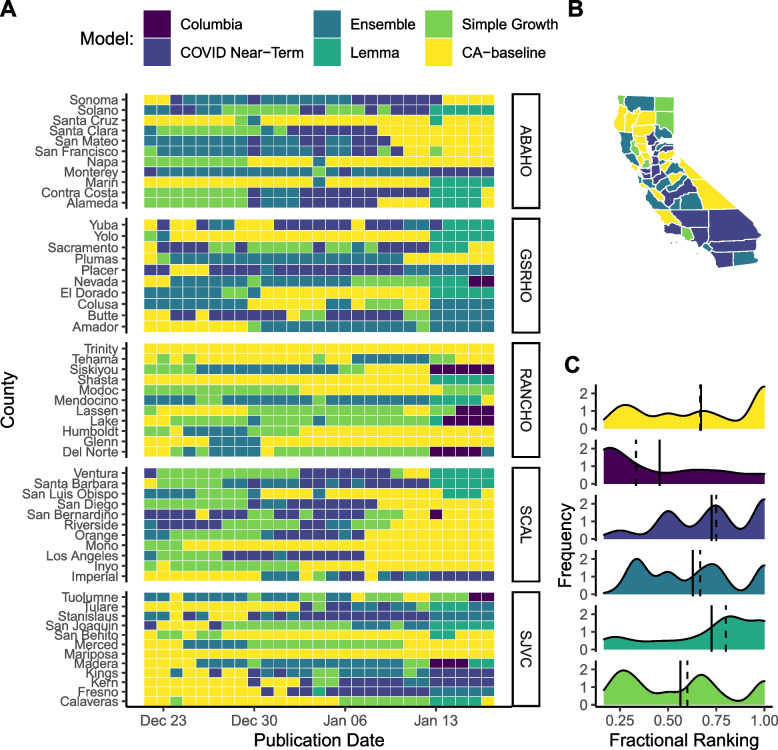
Methods: Using archived forecasts from the California Department of Public Health's California COVID Assessment Tool ( https://calcat.covid19.ca.gov/cacovidmodels/ ), we compared how well different forecasting models predicted COVID-19 hospitalization census across California counties and regions during periods of Alpha, Delta, and Omicron variant predominance.

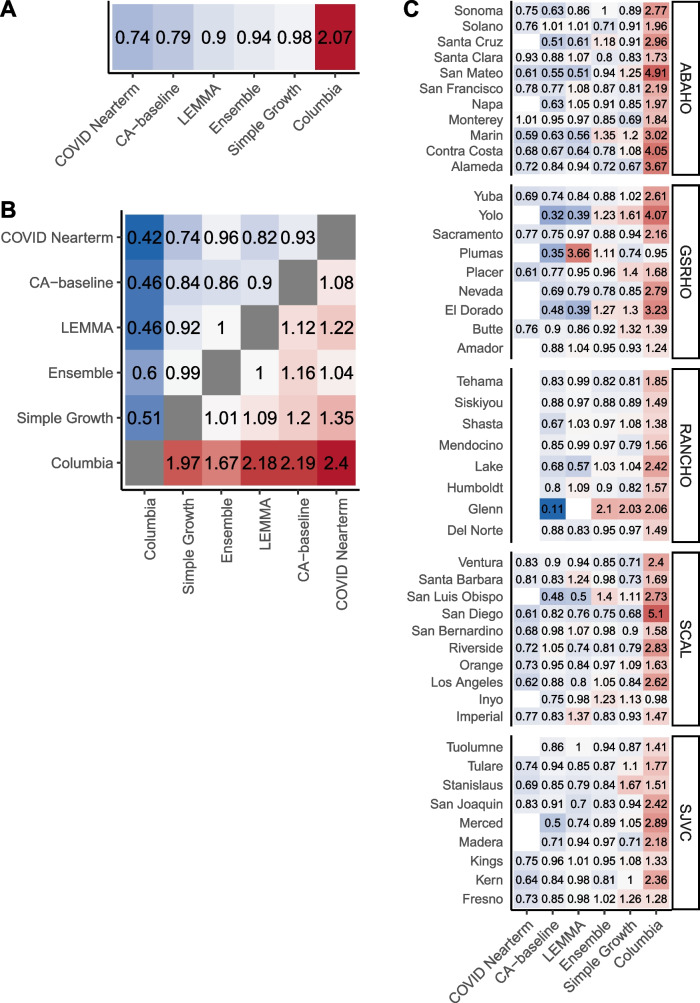
Results: Based on mean absolute error estimates, forecasting models had variable performance across counties and through time. When accounting for model availability across counties and dates, some individual models performed consistently better than the ensemble model, but model rankings still differed across counties. Local transmission trends, variant prevalence, and county population size were informative predictors for determining which model performed best for a given county based on a random forest classification analysis. Overall, the ensemble model performed worse in less populous counties, in part because of fewer model contributors in these locations.

Conclusions: Ensemble model predictions could be improved by incorporating geographic heterogeneity in model coverage and performance. Consistency in model reporting and improved model validation can strengthen the role of infectious disease forecasting in real-time public health decision making.

Keywords: COVID-19; Forecasting; Infectious disease modeling; Model evaluation; Public health.


Conflict of interest statement

The authors declare no competing interests.

Figures

Fig. 1
Fig. 1
Time courses of (A) California COVID-19 hospitalization census, B variant prevalence, C statewide R-effective estimate, and D California health officer regions. The period displayed for panels A-C corresponds to the complete period of analysis February 1, 2021-February 1, 2022 used for the pairwise tournament and random forest analyses. Shaded regions for panels A:C correspond to the dates of analysis for the three variant predominant periods: Alpha, Delta, and Omicron
Fig. 2
Fig. 2
Forecasting accuracy results at the county level during the Alpha wave in California as measured by mean absolute error (MAE). A Heat map of the best daily performing model for a given prediction date as measured by 14-day MAE. Each cell in the heat map corresponds to a normalized MAE calculated for the day that a model forecast was published. Counties are grouped into panels by California health officer regions. B A summary map of California where the color of the county corresponds to the model with the highest sum of the standardized rank score for that period (Σsrm,i,j). Note that by using the summation of the standardized ranking score, models are penalized for lack of participation. C A density distribution of the standardized rank score (srm,i,j) that depicts the median (dashed) and mean (solid) as vertical lines for each model distribution. A standardized rank score of one indicates that a model came in first relative to other participating models for a given date and location, values closer to zero indicate that a model had a lower ranking compared to other participating models, and a value of zero corresponds to no participation
Fig. 3
Fig. 3
Forecasting accuracy results at the county level during the Delta wave in California as measured by mean absolute error (MAE). A Heat map of the best daily performing model for a given prediction date as measured by 14-day MAE. Each cell in the heat map corresponds to a standardized MAE calculated for the day that a model forecast was published. Counties are grouped into panels by California health officer regions. B A summary map of California where the color of the county corresponds to the model with the highest sum of the standardized rank score for that period (Σsrm,i,j). Note that by using the summation of the standardized ranking score models are penalized for lack of participation. C A density distribution of the standardized rank score (srm,i,j) that depicts the median (dashed) and mean (solid) as vertical lines for each model distribution. A standardized rank score of one indicates that a model came in first relative to other participating models for a given date and location, values closer to zero indicate that a model had a lower ranking compared to other participating models, and a value of zero corresponds to no participation
Fig. 4
Fig. 4
Forecasting accuracy results at the county level during the Omicron wave in California as measured by mean absolute error (MAE). A Heat map of the best daily performing model for a given prediction date as measured by 14-day MAE. Each cell in the heat map corresponds to a standardized MAE calculated for the day that a model forecast was published. Counties are grouped into panels by California health officer regions. B A summary map of California where the color of the county corresponds to the model with the highest sum of the standardized rank score for that period (Σsrm,i,j). Note that by using the summation of the standardized ranking score models are penalized for lack of participation. C A density distribution of the standardized rank score (srm,i,j) that depicts the median (dashed) and mean (solid) as vertical lines for each model distribution. A standardized rank score of one indicates that a model came in first relative to other participating models for a given date and location, values closer to zero indicate that a model had a lower ranking compared to other participating models, and a value of zero corresponds to no participation
Fig. 5
Fig. 5
Pairwise tournament median rankings of models for the whole analysis period for 14-day MAE. A Overall median rankings (θm) across all locations and observation dates. B Median pairwise rankings (θm,m) comparing each model m relative to every other model m’. The grid is symmetrical, so the ratio of model m: model m’ is the inverse score of the ratio of model m’: model m. C Overall median rankings for all available observation dates disaggregated by county

References

    1. Bertozzi AL, Franco E, Mohler G, Short MB, Sledge D. The challenges of modeling and forecasting the spread of COVID-19. Proc Natl Acad Sci. 2020;117(29):16732–16738. doi: 10.1073/pnas.2006520117. - DOI - PMC - PubMed
    1. Lutz CS, Huynh MP, Schroeder M, Anyatonwu S, Dahlgren FS, Danyluk G, et al. Applying infectious disease forecasting to public health: a path forward using influenza forecasting examples. BMC Public Health. 2019;19(1):1659. doi: 10.1186/s12889-019-7966-8. - DOI - PMC - PubMed
    1. Doms C, Kramer SC, Shaman J. Assessing the Use of Influenza Forecasts and Epidemiological Modeling in Public Health Decision Making in the United States. Sci Rep. 2018;8(1):12406. doi: 10.1038/s41598-018-30378-w. - DOI - PMC - PubMed
    1. California Department of Public Health . California COVID Assessment Tool. 2022.
    1. California Department of Public Health . Blueprint for a Safer Economy. 2021.

Publication types

Supplementary concepts