. 2023 Apr 28;42(1):106.
doi: 10.1186/s13046-023-02655-8.

Bispecific T cell-engager targeting oncofetal chondroitin sulfate induces complete tumor regression and protective immune memory in mice

Affiliations

Bispecific T cell-engager targeting oncofetal chondroitin sulfate induces complete tumor regression and protective immune memory in mice

Nanna Skeltved et al. J Exp Clin Cancer Res. .

Abstract

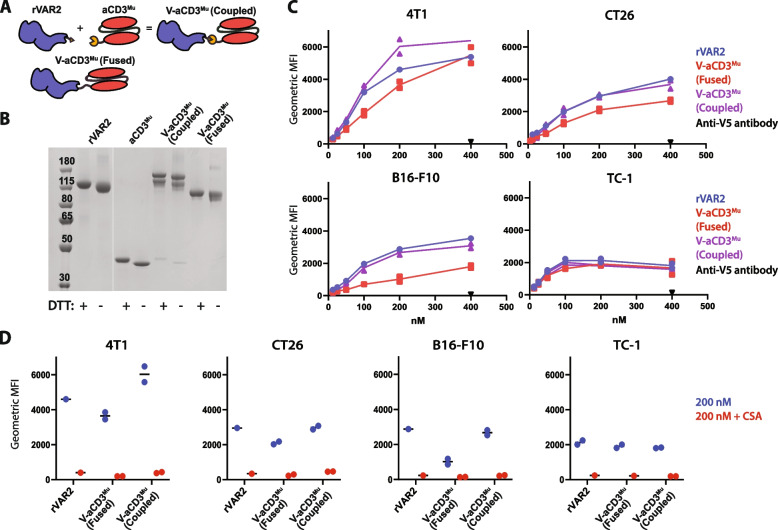
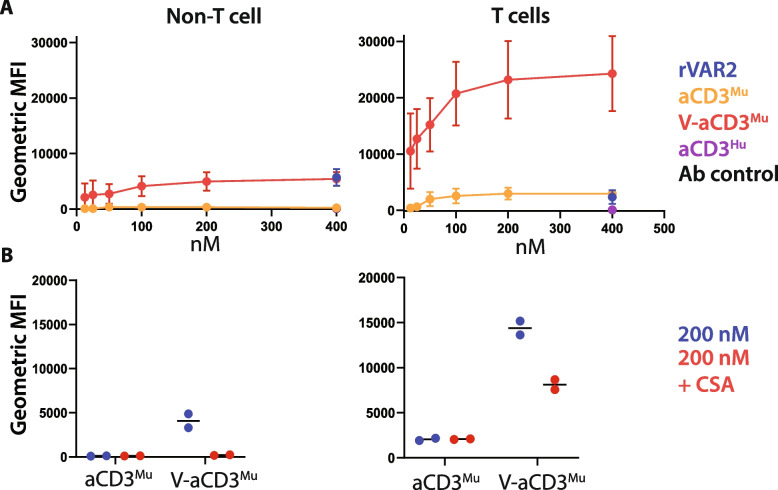
Background: The malaria protein VAR2CSA binds oncofetal chondroitin sulfate (ofCS), a unique chondroitin sulfate, expressed on almost all mammalian cancer cells. Previously, we produced a bispecific construct targeting ofCS and human T cells based on VAR2CSA and anti-CD3 (V-aCD3Hu). V-aCD3Hu showed efficacy against xenografted tumors in immunocompromised mice injected with human immune cells at the tumor site. However, the complex effects potentially exerted by the immune system as a result of the treatment cannot occur in mice without an immune system. Here we investigate the efficacy of V-aCD3Mu as a monotherapy and combined with immune checkpoint inhibitors in mice with a fully functional immune system.

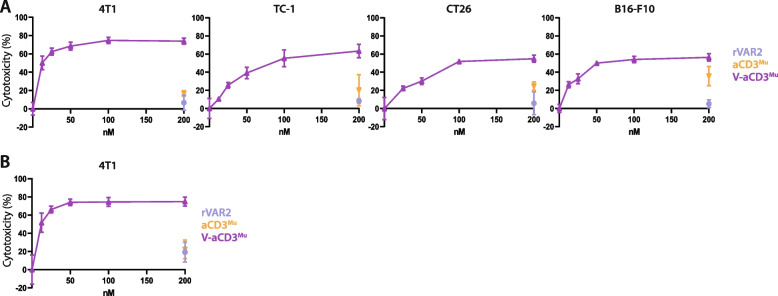
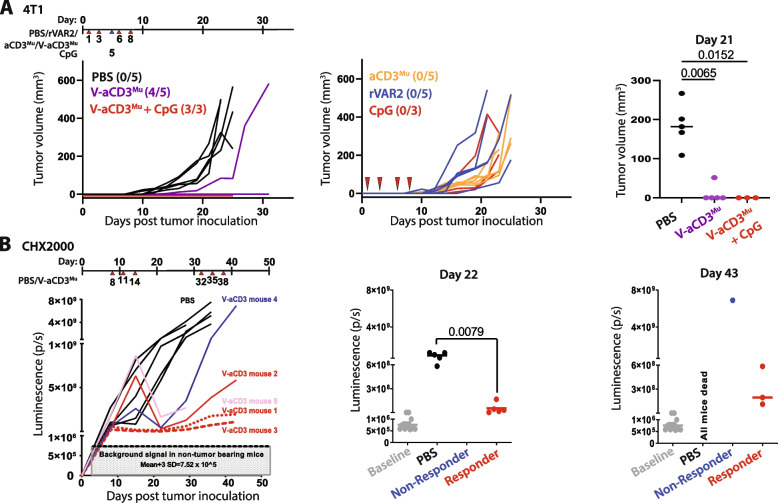
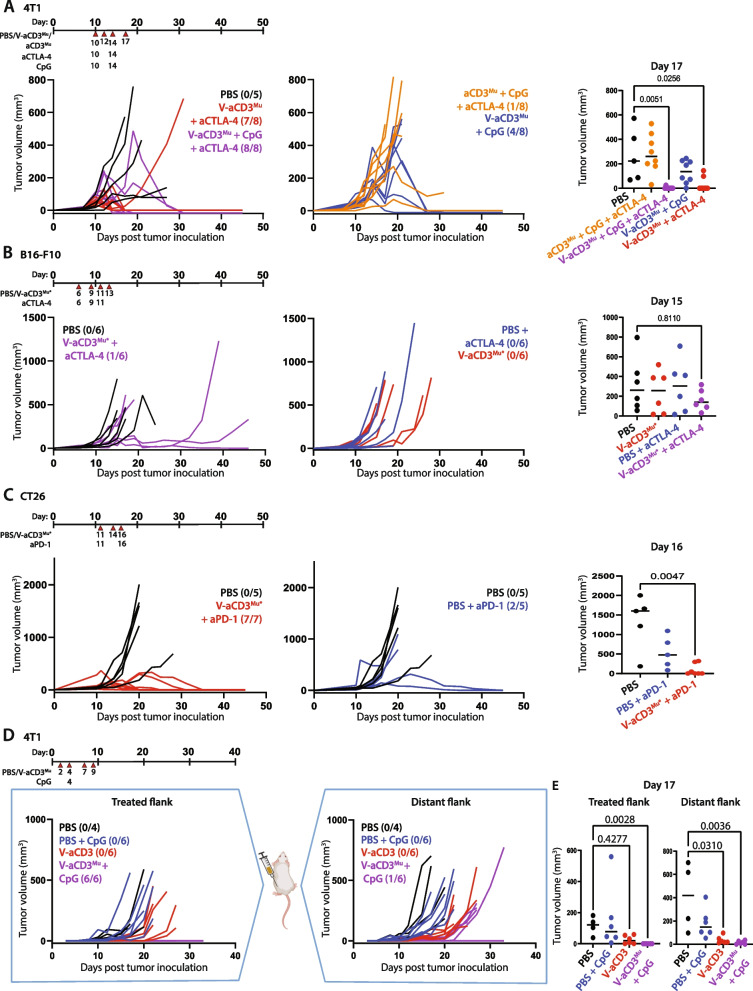
Methods: We produced a bispecific construct consisting of a recombinant version of VAR2CSA coupled to an anti-murine CD3 single-chain variable fragment. Flow cytometry and ELISA were used to check cell binding capabilities and the therapeutic effect was evaluated in vitro in a killing assay. The in vivo efficacy of V-aCD3Mu was then investigated in mice with a functional immune system and established or primary syngeneic tumors in the immunologically "cold" 4T1 mammary carcinoma, B16-F10 malignant melanoma, the pancreatic KPC mouse model, and in the immunologically "hot" CT26 colon carcinoma model.

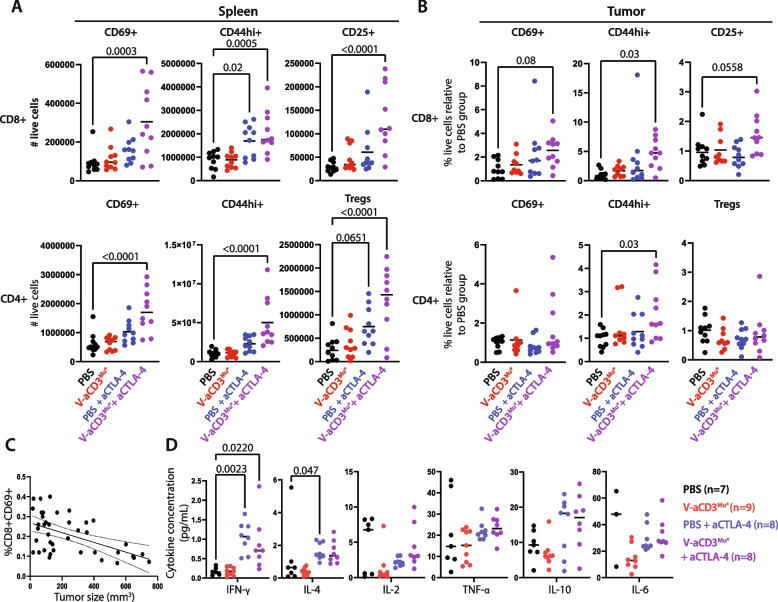
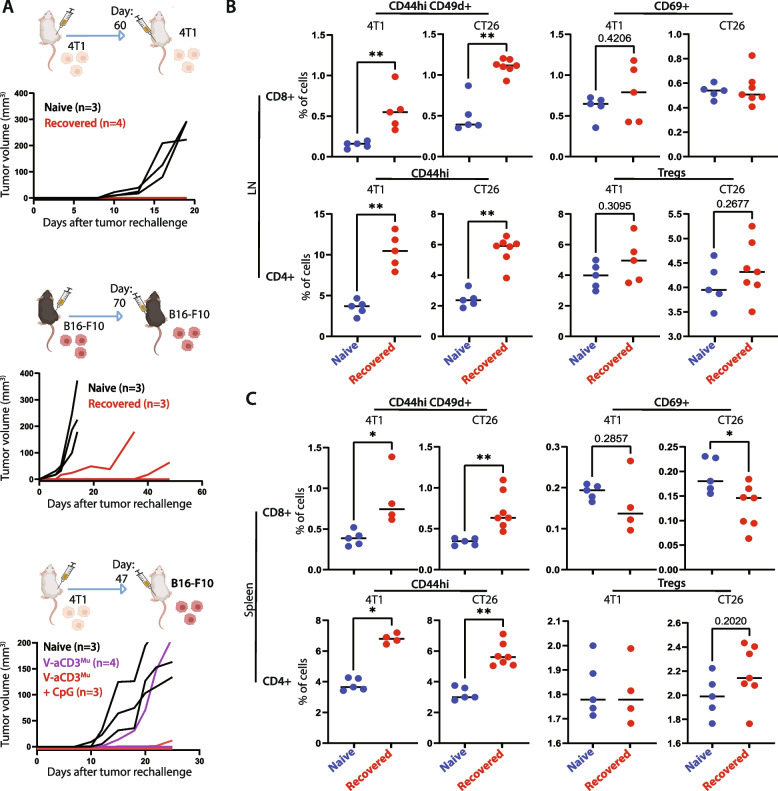
Results: V-aCD3Mu had efficacy as a monotherapy, and the combined treatment of V-aCD3Mu and an immune checkpoint inhibitor showed enhanced effects resulting in the complete elimination of solid tumors in the 4T1, B16-F10, and CT26 models. This anti-tumor effect was abscopal and accompanied by a systemic increase in memory and activated cytotoxic and helper T cells. The combined treatment also led to a higher percentage of memory T cells in the tumor without an increase in regulatory T cells. In addition, we observed partial protection against re-challenge in a melanoma model and full protection in a breast cancer model.

Conclusions: Our findings suggest that V-aCD3Mu combined with an immune checkpoint inhibitor renders immunologically "cold" tumors "hot" and results in tumor elimination. Taken together, these data provide proof of concept for the further clinical development of V-aCD3 as a broad cancer therapy in combination with an immune checkpoint inhibitor.

Keywords: Bispecific antibodies; Cancer; Checkpoint inhibitor; Immunotherapy; T cell memory; T cells therapy; Targeted therapy; VAR2CSA.


Conflict of interest statement

TGT, MD, AS, and MoAN have shares in VAR2 Pharmaceuticals which owns the rights to use rVAR2 for diagnosing and treating cancer. MiAN, TG, and SC are partly employed in VAR2 Pharmaceuticals. All other authors declare no conflicts of interest.

Figures

Fig. 1
Fig. 1
rVAR2 coupled to aCD3Mu retains cancer cell binding. A Schematic figure of rVAR2 and aCD3Mu conjugated through the SpyTag/SpyCatcher system into one protein (V-aCD3Mu (coupled)) very similar to the genetically fused V-aCD3Mu. B SDS-PAGE of rVAR2, aCD3Mu, V-aCD3Mu (coupled), and V-aCD3Mu (fused). C Flow cytometry showing binding of rVAR2, V-aCD3Mu (coupled), and V-aCD3Mu (fused) to the indicated cancer cell lines, including the detection antibody anti-V5 as a control. D Flow cytometry showing binding of 200 nM of indicated protein with and without soluble chondroitin sulfate A (CSA) added in excess. Each dot represents one data point. TC-1 binding of V-aCD3Mu (coupled) and V-aCD3Mu (fused) were evaluated in individual experiments and values were normalized relative to rVAR2 binding ((V-aCD3Mu (coupled)/rVAR2_1) * VAR2_2). Data are representative of either two (B16-F10 and TC-1) or four (4T1 and CT26) individual experiments
Fig. 2
Fig. 2
aCD3Mu retains T cell binding when linked to rVAR2. A Flow cytometry on protein binding to non-T cells (CD4-CD8-) and T cells (CD4 + /CD8 + /CD4 + CD8 +) from splenocytes and white blood cells. An anti-human anti-CD3 (aCD3Hu) and an antibody control (anti-CD8, anti-CD4, and the secondary antibody anti-penta-HIS) were included as controls. Means and standard deviations are displayed. B CSA inhibition of protein binding to non-T cell splenocytes/white blood cells (left panel) and T cells (right panel). Each dot represents one data point. Data in this figure is compiled from three separate experiments. Note that the fluorescent signals cannot be directly compared as V-aCD3Mu has two penta-HIS tags while aCD3Mu, rVAR2, and aCD3Hu only have one
Fig. 3
Fig. 3
V-aCD3Mu mediates in vitro killing of cancer cells. A Killing assays with preactivated splenocytes added in an E:T ratio of 10:1 to either 4T1, CT26, B16-F10, or TC-1 cells together with V-aCD3Mu in a twofold titration series from 200 nM and rVAR2 and aCD3Mu at 200 nM concentrations. B Killing assay with isolated T cells as effector cells. The killing assay was performed as described above using 4T1 cells. Cytotoxicity data represents data from four (4T1), two (CT26), or one (B16-F10, TC-1) experiments
Fig. 4
Fig. 4
V-aCD3Mu promotes tumor regression and prevents growth of non-established tumors. A 4T1 tumors were peritumorally treated on day 1, 3, 6, and 8 after cancer cell inoculation (indicated by red arrows),before the tumors were established. The mice were treated with either PBS (number of mice (n) = 5), rVAR2 (n = 5), aCD3Mu (n = 5), CpG (n = 3), V-aCD3Mu (n = 5), or V-aCD3Mu + CpG (n = 3). CpG was only administered on day 5 (indicated by a blue arrow).Numbers in parentheses indicate the number of tumor-free animals out of all animals in the group. B Quantification of bioluminescence in vivo imaging of C57BL/6 mice following orthotopic implantation of 5 × 104 Luciferase+ primary pancreatic cancer cells (CHX2000) derived from KPC mice (LSL-KrasG12D/+; p53f/f; Pdx1-Cre). The mice received intratumoral injections of V-aCD3Mu (n = 5) or PBS (n = 5) on day 8, 11, 14, 32, 35, and 38. Tumor volumes of treatment versus control group were compared using the Mann–Whitney test. (Left) Tumor growth in individual mice. Baseline luminescence levels of non-tumor-bearing mice are indicated. (Right) Quantification on day 22 and day 43 displays responders and non-responders. On day 22 all mice in the treatment group are responders
Fig. 5
Fig. 5
V-aCD3Mu in combination with ICIs eliminates solid tumors in different cancer models. A Established 4T1 tumors were treated with either PBS (n = 5), CpG + aCTLA-4 + aCD3Mu (n = 8), V-aCD3Mu + aCTLA-4 (n = 8), V-aCD3Mu + CpG (n = 8), or V-aCD3Mu + aCTLA-4 + CpG (n = 8) on day 10 (tumor average = 50–100 mm3), 12, 14, and 17 as illustrated on the treatment timeline. B Established B16-F10 SQ tumors in the left lower quadrant of the abdomen were treated with either PBS (n = 6), PBS + aCTLA-4 (n = 6), V-aCD3Mu* (n = 6), or V-aCD3Mu* + aCTLA-4 (n = 6) on day 6 (tumor average = 11 mm3), 9, 11, and 13. C Established CT26 SQ tumors were treated when they were 106 mm3 on average with either PBS (n = 5), PBS + aPD-1 (n = 5), or V-aCD3Mu* + aPD-1 (n = 7) on day 11, 14, and 16, with no aPD-1 given on day 14. D Tumor measurements of BALB/c mice inoculated with 4T1 cancer cells in both the left and the right flank. On day 2, 4, 7, and 9, V-aCD3Mu or PBS was injected into the right flank of the mice. CpG was administered mixed in with the treatment on day 4. E Tumor measurements of the treated and untreated flanks on day 17 after tumor injection. Numbers in parentheses indicate the number of tumor-free mice or tumor-free flank out of all animals in one group. Tumor volumes were compared to the PBS group using the Kruskal–Wallis test followed by Dunn’s post hoc test
Fig. 6
Fig. 6
Combination of V-aCD3Mu and ICI leads to increased levels of activated and memory T cells. Data are from flow cytometry on 40 C57BL/6 mice with B16-F10 tumors which were sacrificed on day 14 after tumor injection. The mice received either PBS, V-aCD3Mu*, PBS + aCTLA-4, or V-aCD3Mu* + aCTLA-4 on day 6, 9, 11, and 13 after cancer cell injection in two separate experiments with 20 mice in each. A Flow cytometry showing total number of splenic CD8 + and CD4 + T cells that were CD69 + , CD44hi, or CD25 + (CD25 + FoxP3 + for Tregs). B Relative change in % of CD8 + and CD4 + tumor-infiltrating T cells (CD69 + /CD44hi/CD25 + /CD25 + FoxP3 +) in comparison to the PBS group. The mean is displayed. C Correlation between tumor size and the percentage of CD8 + CD69 + cells of all live single cells from the spleen evaluated by simple linear regression (p = 0.0003). D Cytokine concentrations from serum measured in an MSD V-plex assay. Statistics from A and B are done using one-way ANOVA with Dunnett’s post hoc test for comparison of treatment groups to PBS group. Statistics from (D) are performed using the Kruskal–Wallis test followed by Dunn’s post hoc test
Fig. 7
Fig. 7
Recovered mice reject tumor in rechallenge experiment. A Left/middle: Tumor measurements of tumor-ablating BALB/c (white) and C57BL/6 (black) mice rechallenged with the same number of 4T1 or B16-F10 cancer cells, respectively, on either day 60 or 70 after the first tumor injection. Right: Tumor measurements of 4T1 tumor-ablating mice rechallenged with B16-F10 cancer cells on day 47 after the first tumor injection. Naïve mice were included in all rechallenges as controls for tumor take. B + C Flow cytometry on cell populations from spleens and LNs from either naïve mice (blue), or mice that had recovered from 4T1 or CT26 cancer (red). The percentage of cells represents the percentage of live cells within the lymphocyte gate. Differences between cell fractions in naive and survivor mice were evaluated using the Mann–Whitney test. *p < 0.05, **p < 0.01, ***p < 0.001, ****p < 0.0001

References

    1. Offner S, Hofmeister R, Romaniuk A, Kufer P, Baeuerle PA. Induction of regular cytolytic T cell synapses by bispecific single-chain antibody constructs on MHC class I-negative tumor cells. Mol Immunol. 2006;43:763–771. doi: 10.1016/j.molimm.2005.03.007. - DOI - PubMed
    1. Brinkmann U, Kontermann RE. The making of bispecific antibodies. MAbs. 2017;9:182–212. doi: 10.1080/19420862.2016.1268307. - DOI - PMC - PubMed
    1. Middelburg J, Kemper K, Engelberts P, Labrijn AF, Schuurman J, Van Hall T. Overcoming challenges for CD3-bispecific antibody therapy in solid tumors. Cancers (Basel) 2021;13:1–25. doi: 10.3390/cancers13020287. - DOI - PMC - PubMed
    1. Labrijn AF, Janmaat ML, Reichert JM, Parren PWHI. Bispecific antibodies: a mechanistic review of the pipeline. Nat Rev Drug Discov. 2019;18:585–608. doi: 10.1038/s41573-019-0028-1. - DOI - PubMed
    1. Baeuerle PA, Reinhardt C. Bispecific T-cell engaging antibodies for cancer therapy. Cancer Res. 2009;69:4941–4944. doi: 10.1158/0008-5472.CAN-09-0547. - DOI - PubMed

Substances