. 2023 Jun 22;114(4):436-443.
doi: 10.1093/jhered/esad025.

Reference genome of the black rail, Laterallus jamaicensis

Affiliations

Reference genome of the black rail, Laterallus jamaicensis

Laurie A Hall et al. J Hered. .

Erratum in

Abstract

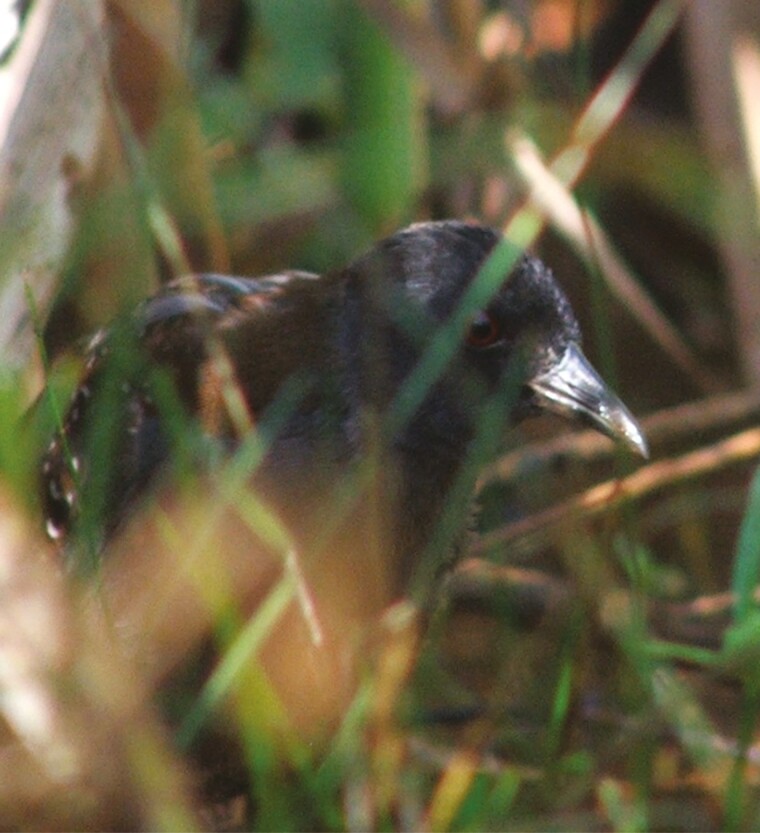
The black rail, Laterallus jamaicensis, is one of the most secretive and poorly understood birds in the Americas. Two of its five subspecies breed in North America: the Eastern black rail (L. j. jamaicensis), found primarily in the southern and mid-Atlantic states, and the California black rail (L. j. coturniculus), inhabiting California and Arizona, are recognized across the highly disjunct distribution. Population declines, due primarily to wetland loss and degradation, have resulted in conservation status listings for both subspecies. To help advance understanding of the phylogeography, biology, and ecology of this elusive species, we report the first reference genome assembly for the black rail, produced as part of the California Conservation Genomics Project (CCGP). We produced a de novo genome assembly using Pacific Biosciences HiFi long reads and Hi-C chromatin-proximity sequencing technology with an estimated sequencing error rate of 0.182%. The assembly consists of 964 scaffolds spanning 1.39 Gb, with a contig N50 of 7.4 Mb, scaffold N50 of 21.4 Mb, largest contig of 44.8 Mb, and largest scaffold of 101.2 Mb. The assembly has a high BUSCO completeness score of 96.8% and represents the first genome assembly available for the genus Laterallus. This genome assembly can help resolve questions about the complex evolutionary history of rails, assess black rail vagility and population connectivity, estimate effective population sizes, and evaluate the potential of rails for adaptive evolution in the face of growing threats from climate change, habitat loss and fragmentation, and disease.

Keywords: CCGP; California Conservation Genomics Project; Gruiformes; Rallidae; conservation genetics.


Figures

Fig. 1.
Fig. 1.
Photo of a California black rail (Laterallus jamaicensis coturniculus). Credit: Orien Richmond.
Fig. 2.
Fig. 2.
Visual overview of genome assembly metrics. (A) K-mer spectrum generated from PacBio HiFi data without adapters using GenomeScope2.0. The bimodal pattern observed corresponds to a diploid genome. K-mers covered at lower coverage and lower frequency correspond to differences between haplotypes, whereas the higher coverage and higher frequency k-mers correspond to the similarities between haplotypes. (B) BlobToolKit Snail plot showing a graphical representation of the quality metrics presented in Table 2 for the black rail primary assembly (bLatJam1.0.p). The plot circle represents the full size of the assembly. From the inside-out, the central plot covers length-related metrics. The red line represents the size of the longest scaffold; all other scaffolds are arranged in size-order moving clockwise around the plot and drawn in gray starting from the outside of the central plot. Dark and light orange arcs show the scaffold N50 and scaffold N90 values. The central light gray spiral shows the cumulative scaffold count with a white line at each order of magnitude. White regions in this area reflect the proportion of Ns in the assembly; the dark versus light blue area around it shows mean, maximum, and minimum GC versus AT content at 0.1% intervals. Omni-C contact maps for the primary (C) and alternate (D) genome assembly generated with PretextSnapshot. Omni-C contact maps translate proximity of genomic regions in 3D space to contiguous linear organization. Each cell in the contact map corresponds to sequencing data supporting the linkage (or join) between two of such regions. Black lines differentiate scaffolds.

References

    1. Abdennur N, Mirny LA.. Cooler: scalable storage for Hi-C data and other genomically labeled arrays. Bioinformatics. 2020:36(1):311–316. doi:10.1093/bioinformatics/btz540 - DOI - PMC - PubMed
    1. Allio R, Schomaker-Bastos A, Romiguier J, Prosdocimi F, Nabholz B, Delsuc F.. MitoFinder: Efficient automated large-scale extraction of mitogenomic data in target enrichment phylogenomics. Mol Ecol Resour. 2020:20(4):892–905. doi:10.1111/1755-0998.13160 - DOI - PMC - PubMed
    1. Beissinger SR, Peterson SM, Hall LA, Van Schmidt ND, Tecklin J, Risk BB, Kilpatrick AM.. Stability of patch-turnover relationships under equilibrium and non-equilibrium metapopulation dynamics driven by biogeography. Ecol Lett 2022:25:2372–2383. - PMC - PubMed
    1. Benham PM, Cicero C, Escalona M, Beraut E, Marimuthu MPA, Nguyen O, Nachman MW, Bowie RCK.. A highly contiguous genome assembly for the California quail (Callipepla californica). J Hered. 2023:esad008. doi:10.1093/jhered/esad008 - DOI - PMC - PubMed
    1. Camacho C, Coulouris G, Avagyan V, Ma N, Papadopoulos J, Bealer K, Madden TL.. BLAST+: architecture and applications. BMC Bioinf. 2009:10:421 - PMC - PubMed

Publication types