. 2023 May 30;42(5):112451.
doi: 10.1016/j.celrep.2023.112451. Epub 2023 Apr 27.

Temporal and spatial staging of lung alveolar regeneration is determined by the grainyhead transcription factor Tfcp2l1

Affiliations

Temporal and spatial staging of lung alveolar regeneration is determined by the grainyhead transcription factor Tfcp2l1

Fabian L Cardenas-Diaz et al. Cell Rep. .

Abstract

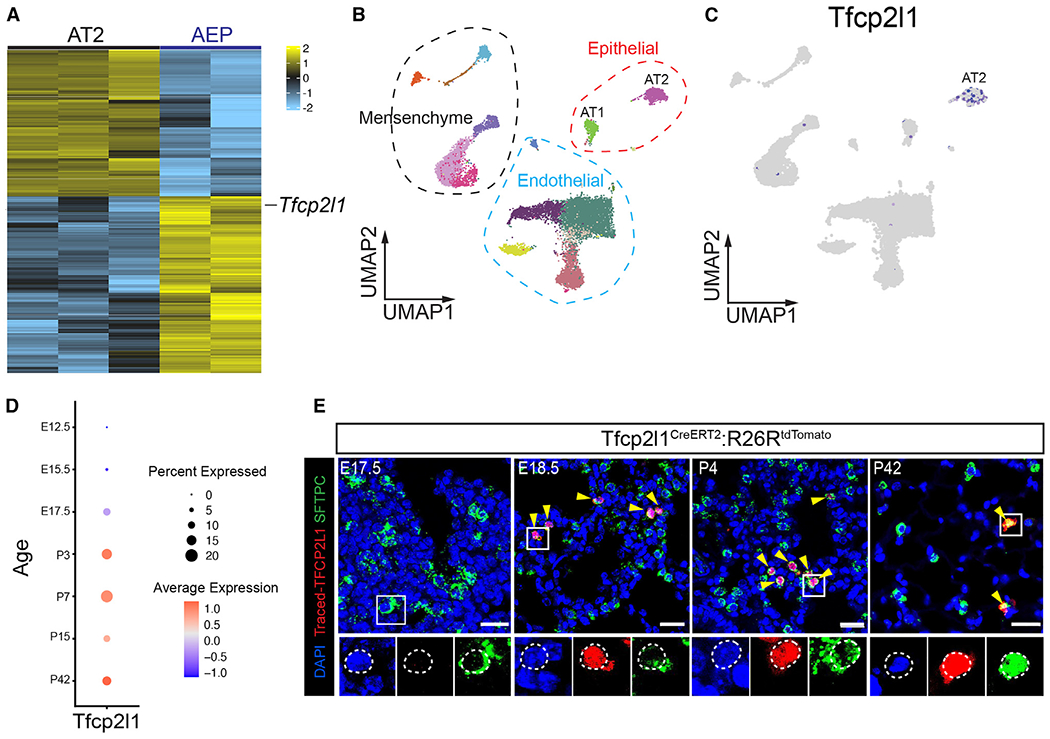
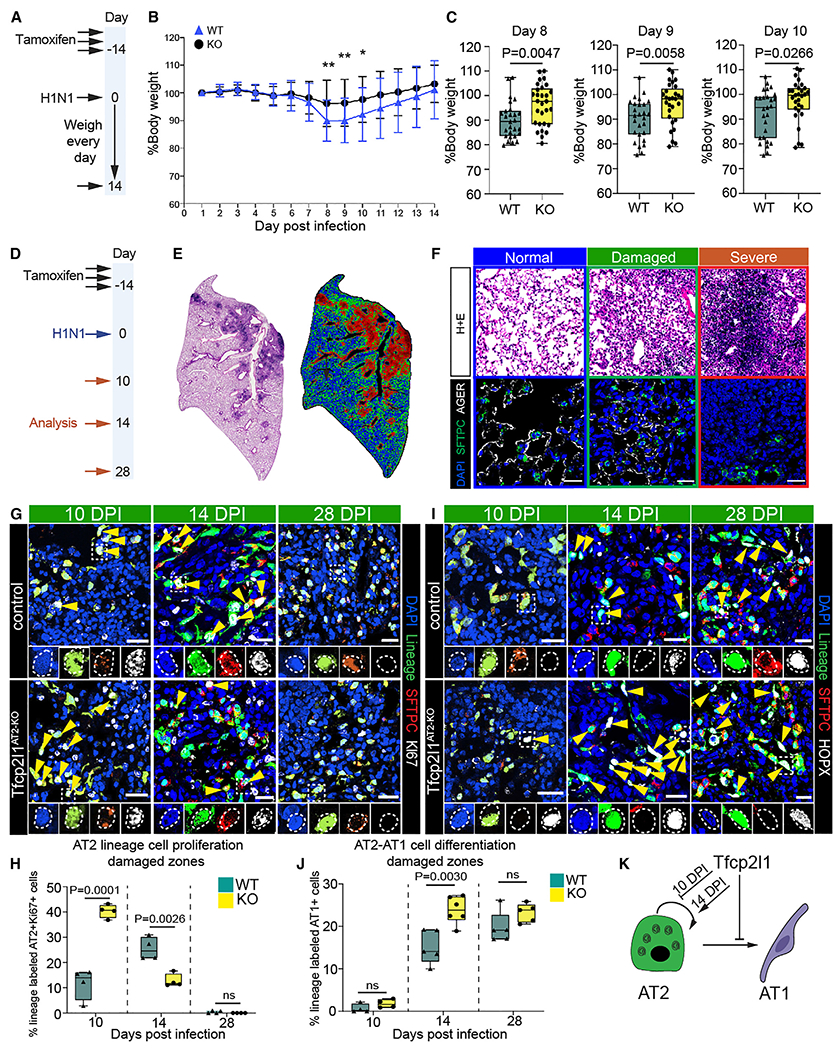
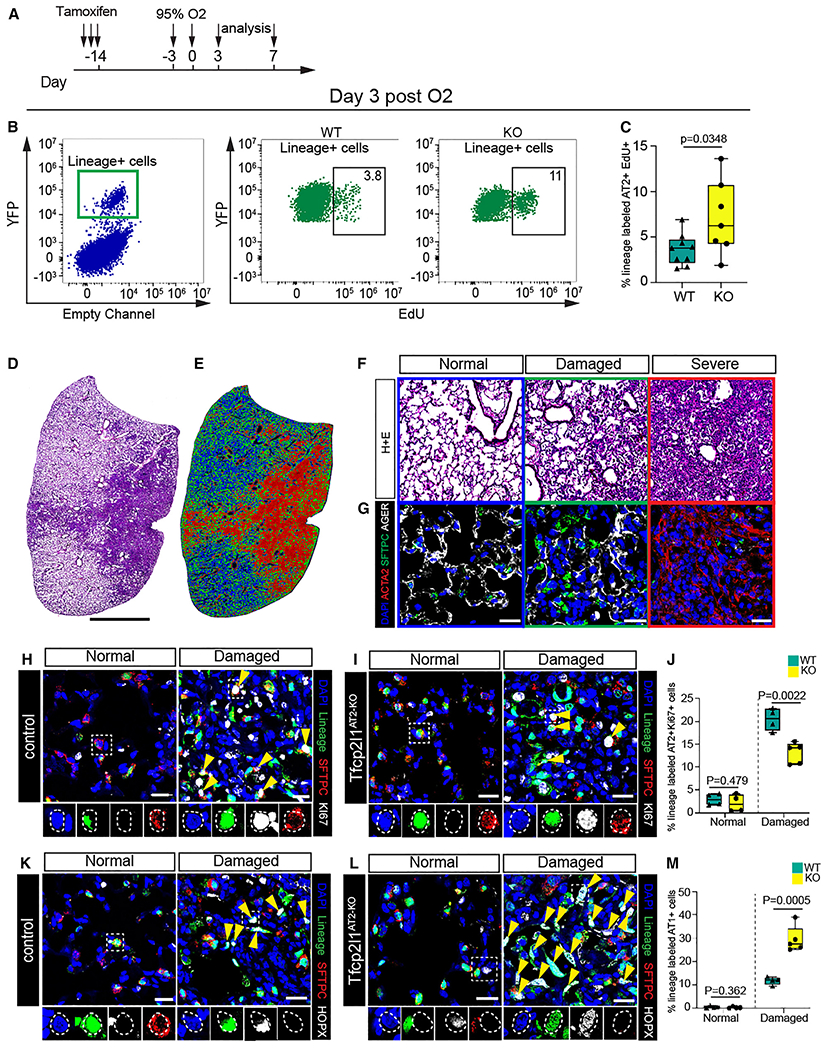
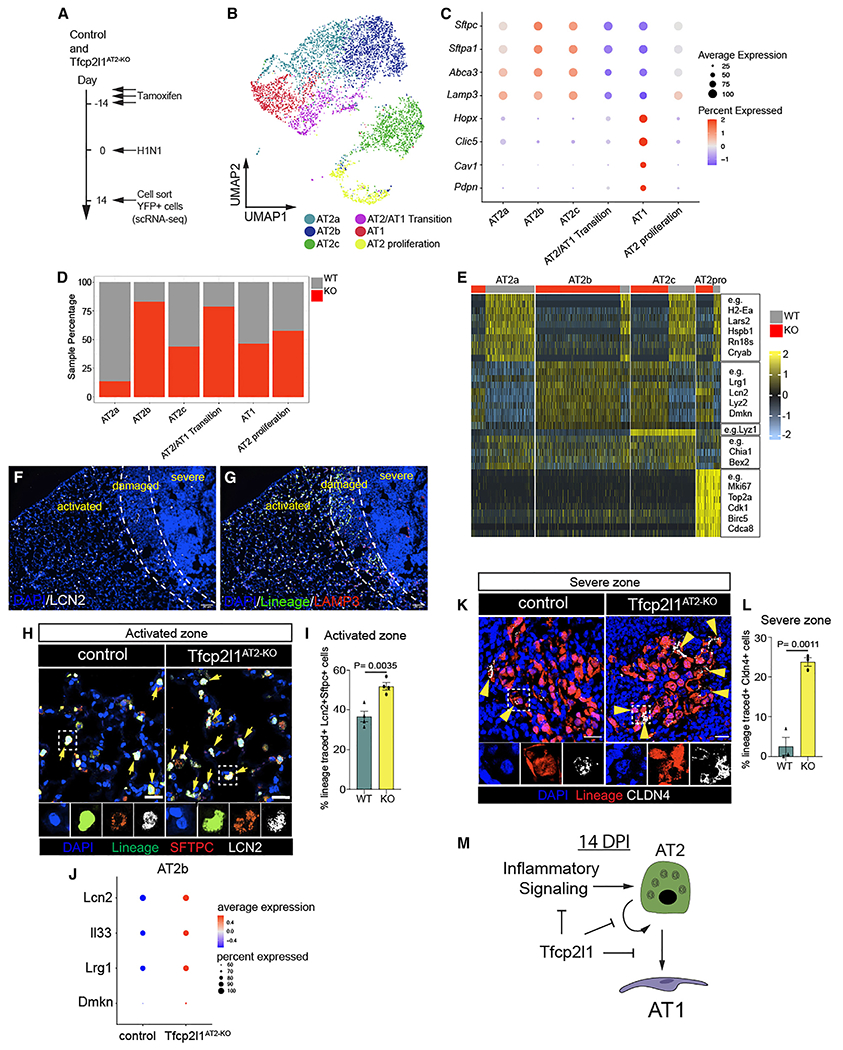
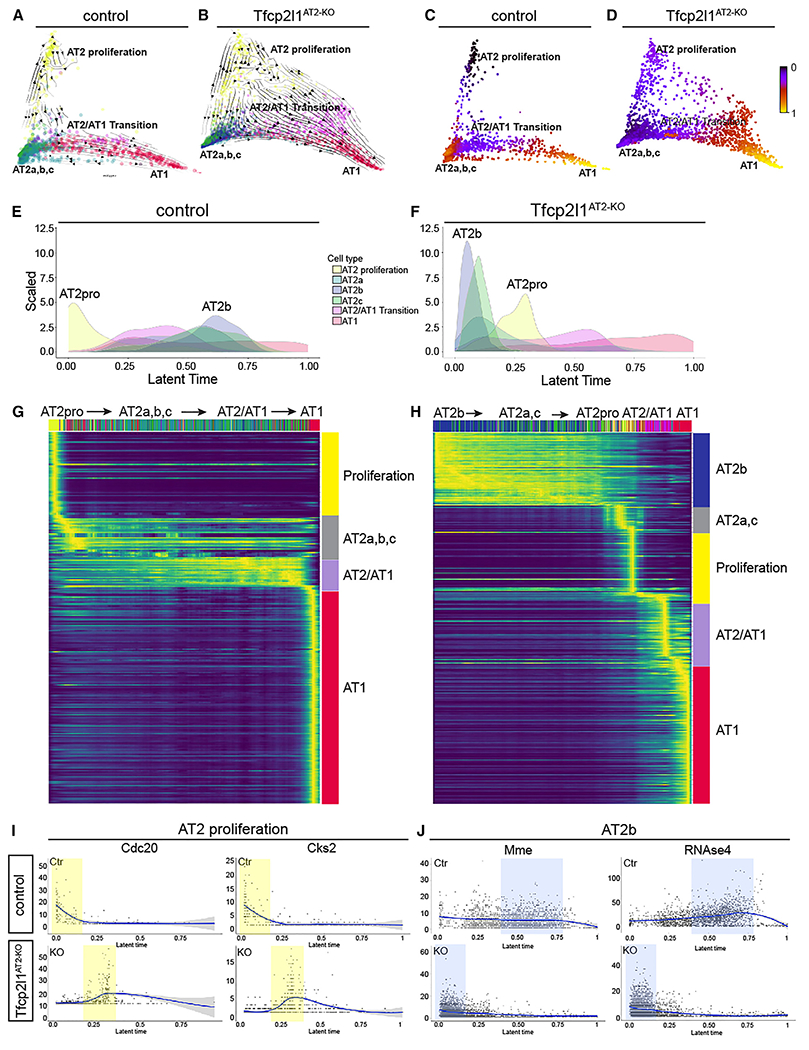
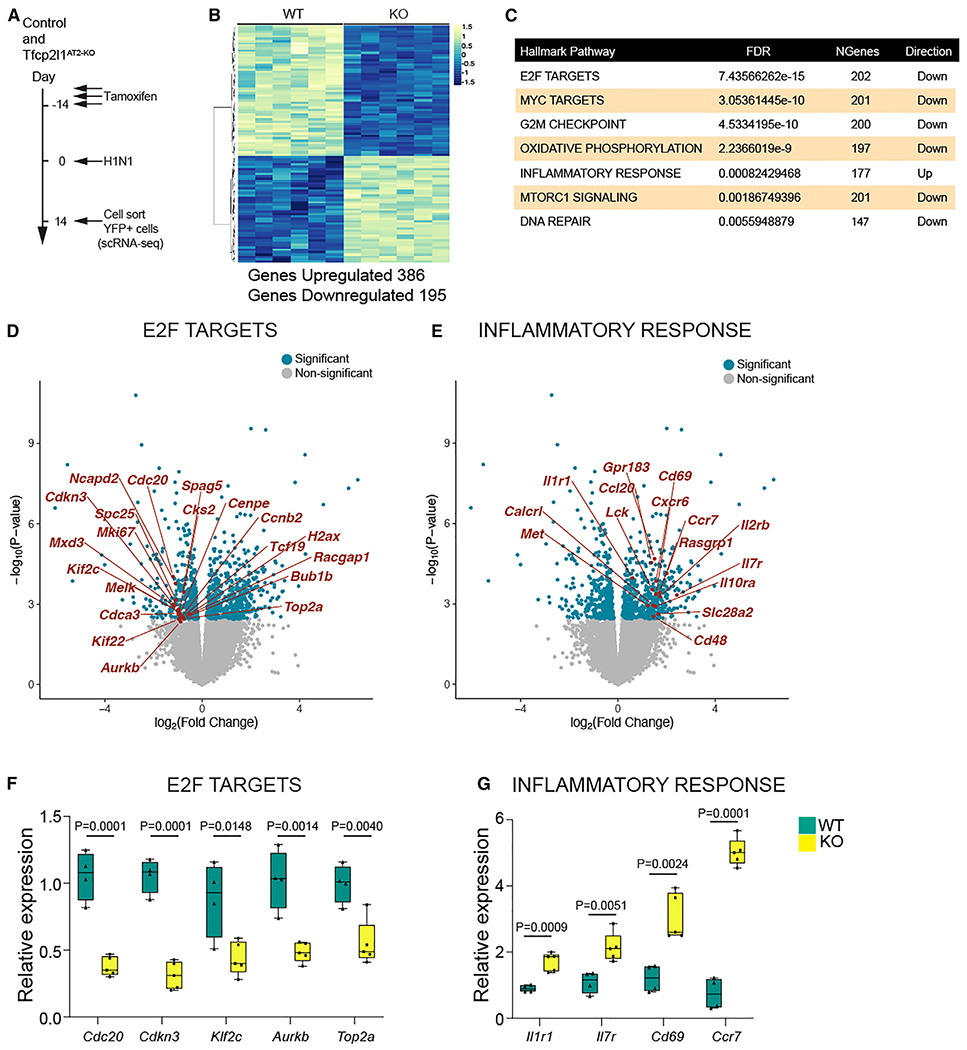
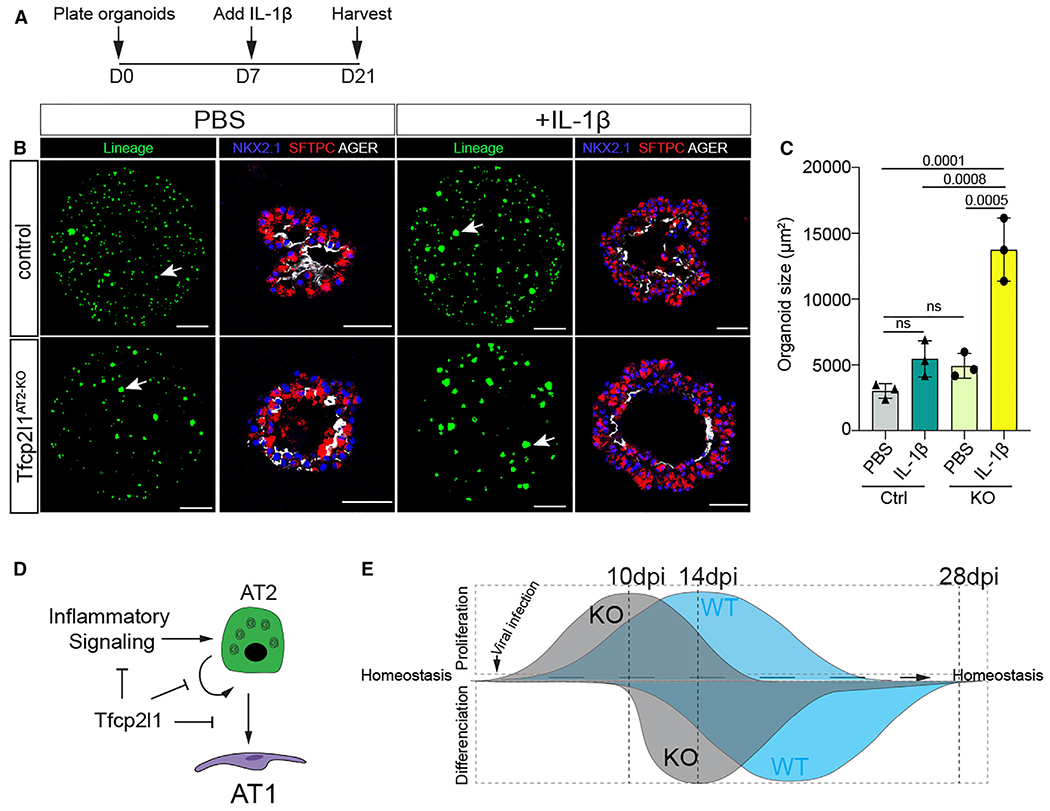
Alveolar epithelial type 2 (AT2) cells harbor the facultative progenitor capacity in the lung alveolus to drive regeneration after lung injury. Using single-cell transcriptomics, software-guided segmentation of tissue damage, and in vivo mouse lineage tracing, we identified the grainyhead transcription factor cellular promoter 2-like 1 (Tfcp2l1) as a regulator of this regenerative process. Tfcp2l1 loss in adult AT2 cells inhibits self-renewal and enhances AT2-AT1 differentiation during tissue regeneration. Conversely, Tfcp2l1 blunts the proliferative response to inflammatory signaling during the early acute injury phase. Tfcp2l1 temporally regulates AT2 self-renewal and differentiation in alveolar regions undergoing active regeneration. Single-cell transcriptomics and lineage tracing reveal that Tfcp2l1 regulates cell fate dynamics across the AT2-AT1 differentiation and restricts the inflammatory program in murine AT2 cells. Organoid modeling shows that Tfcp2l1 regulation of interleukin-1 (IL-1) receptor expression controlled these cell fate dynamics. These findings highlight the critical role Tfcp2l1 plays in balancing epithelial cell self-renewal and differentiation during alveolar regeneration.

Keywords: CP: Stem cell research; Tfcp2l1; alveolar type 2 cell; hyperoxia; inflammatory signaling; influenza; lung injury; lung regeneration; single-cell transcriptomics.


Conflict of interest statement

Declaration of interests The authors declare no competing interests.

Figures

Figure 1.
Figure 1.. Tfcp2l1 is expressed in AT2 cells in the lungs
(A) RNA-seq heatmap plot showing differentially expressed genes between the AT2 and AEP cell population. (B and C) scRNA-seq uniform manifold approximation and projection (UMAP) plot of adult mouse lung with clustering and cell type distribution showing Tfcp2l1 expression in AT2 cells of the mouse lung. (D) Dot plot visualization derived from developmental time series of scRNA-seq data, showing Tfcp2l1 expression during mouse lung development. (E) Time-specific lineage tracing using Tfcp2l1CreERT2:R26RtdTomato mice, showing that Tfcp2l1 expression is initiated by approximately E18.5 and is restricted to surfactant protein C (Sftpc)+ AT2 cells. Yellow arrowheads highlight lineage Tfcp2l1+/Sftpc+ cells. (Scale bars, 20 μm).
Figure 2.
Figure 2.. Tfcp2l1 regulates AT2 self-renewal and AT1 cell differentiation kinetics during influenza-induced lung regeneration
(A) Experimental plan showing tamoxifen treatment and influenza infection and timing to record loss weight. (B) Percentage of body weight for 14 days post influenza infection. (C) Body weight quantification from days 8–10. n = 27 control mice and 29 mutant mice. (D) Experimental schematic showing tamoxifen treatment, influenza infection, and the timing to examine mouse lungs. (E) Left: H&E stain 14 days post infection (dpi). Right: cluster injury zone map generated from the H&E picture. (F) Top row: H&E pictures representing the injury zones found at 14 dpi. Colors outlining each box represent different injury zones (blue, normal; green, damaged; red, severe; scale bars, 100 μm). Bottom row: IHC pictures for SFTPC, AGER, and DAPI in the three different injury zones (scale bars, 20 μm). (G) Immunohistochemistry (IHC) for the AT2 cell lineage markers enhanced yellow fluorescent protein (EYFP), SFTPC, and Ki67 in damaged zones 10, 14, and 28 dpi with highlighted areas to show co-staining of markers (scale bars, 20μm). (H) Quantification of lineage-traced proliferative AT2 cells in damaged injury zones 10, 14, and 28 dpi. (I) IHC for the AT2 cell lineage markers EYFP, SFTPC, and HOPX in damaged zones 10, 14, and 28 dpi (with highlighted areas to show co-staining of markers and yellow arrowheads indicating AT1 cell-derived AT2 cells (scale bars, 20 μm). (J) Quantification of AT1 cell-derived AT2 cells in damaged injury zones 10, 14, and 28 dpi. (K) Summary diagram showing that Tfcp2l1 represses AT2 self-renewal and AT1 cell differentiation. All quantification data are represented as mean ± SEM. Two-tailed t test p values are shown; n = 4–5 mice per group.
Figure 3.
Figure 3.. Tfcp2l1 regulates AT2 cell-mediated alveolar regeneration in a spatial and temporal manner
(A) Experimental schematic showing tamoxifen treatment and exposure to hyperoxia with different timing for analysis. (B) Flow cytometry quantification of EdU and lineage-traced EYFP cells on day 3 post hyperoxia exposure. (C) Quantification of lineage-traced EYFP and EdU+ cells on day 3 post hyperoxia exposure (n = 7–9 mice per group). (D and E) Left: H&E stain 7 days post hyperoxia exposure. Right: cluster injury zone map generated from the H&E picture. (F) H&E pictures; each box panel is a representative picture of the injury zones found 7 days post hyperoxia exposure. Colors in each boxed represent different injury zones (blue, normal; green, damaged; red, severe). (G) IHC pictures for SFTPC, AGER, and smooth muscle alpha-actin (αSMA) in the three different injury zones (scale bars, 20 μm). (H and I) IHC for the AT2 cell lineage markers EYFP, SFTPC, and Ki67 in normal and damaged injury zones 7 days post hyperoxia exposure of control and Tfcp2l1AT2-KO mutants, with dashed white boxes and yellow arrowheads highlighting proliferative lineage-traced AT2 cells (scale bars, 20 μm). (J) Quantification of lineage-traced proliferative AT2 cells in different injury zones 7 days post hyperoxia exposure. (K and L) IHC for the AT2 cell lineage markers EYFP, SFTPC, and HOPX in normal and damaged zones 7 days post hyperoxia exposure of control and Tfcp2l1AT2-KO mutants, with dashed white boxes and yellow arrowheads highlighting AT1 cells derived from AT2 cells (scale bars, 20 μm). (M) Quantification of AT1 cell-derived AT2 cells in normal and damaged injury zones 7 days post hyperoxia exposure. All quantification data are represented as mean ± SEM. Two-tailed t test p values are shown; n = 4–5 mice per group.
Figure 4.
Figure 4.. Loss of Tfcp2l1 leads to altered AT2 cell transcriptional states and increased traffic across the AT2-AT1 differentiation axis
(A) Experimental schematic showing tamoxifen treatment, influenza infection, and the timing to sort lineage-traced EYFP cells to generate single-cell RNA sequencing (scRNA-seq) libraries from control and Tfcp2l1AT2-KO mice. (B) Merged scRNA-seq data, showing a UMAP plot of control and Tfcp2l1AT2-KO mice 14 dpi. (C) Dot plot graph from merged scRNA-seq data with AT1 and AT2 canonical markers by cell clusters. (D) Cell percentage distribution per cell cluster. (E) Heatmap plot showing differentially expressed genes per cell cluster. (F) IHC for LCN2 across the different zones of injury and regeneration 14 dpi. (G) IHC for the AT2 cell lineage markers EYFP, LAMP3, and LCN2 in activated zones 14 dpi. (H) IHC at high magnification of EYFP, LAMP3, and LCN2 in activated zones of control and Tfcp2l1AT2-KO mice at 14 dpi (scale bars, 20 μm). (I) Quantification of LCN2+ AT2 cells in activated injury zones 14 dpi. (J) AT2b cell cluster dot plot displaying Lcn2, Il33, Lrg1, and Dmkn expression between control and Tfcp2l1AT2-KO mice. (K) IHC for the AT2 cell lineage marker EYFP and CLDN4 in severe zones 14 dpi; white boxes indicate magnified areas, and yellow arrowheads indicate CLDN4+ cells in lineage-traced cells (scale bars, 20 μm). (L) Quantification CLDN4+ lineage-traced cells in severe injury zones 14 dpi. (M) Summary diagram showing that Tfcp2l1 represses inflammatory signaling, AT2 self-renewal, and AT1 cell differentiation. All quantification data are represented as mean ± SEM. Two-tailed t tests, not significant; p ≤ 0.05; n = 3–5 mice per group.
Figure 5.
Figure 5.. Loss of Tfcp2l1 disrupts stage-specific transcriptional dynamics during AT2 cell regeneration
(A and B) scVelo directionality overlaid onto DM reduction of control and Tfcp2l1AT2-KO data 14 dpi. (C and D) Latent time data inferred from scVelo mapped on the DM as a spectrum of transcriptional changes from a prime or 0 state (blue) to an end state (yellow) in control and Tfcp2l1AT2-KO mutants. Of note, control and Tfcp2l1AT2-KO mutant trajectories end in the AT1 state. (E and F) Density histograms displaying the distribution of AT2 cell states based on latent time of lineage-traced control and Tfcp2l1AT2-KO AT2 cells. (G and H) Gene expression dynamics resolved along latent time, showing AT2 cell state changes in lineage-traced control and Tfcp2l1AT2-KO AT2 cells. (I and J) Expression dynamics of example driver genes along latent time (I) Cdc20 and Cks2, control (top), and Tfcp2l1AT2-KO (bottom). (J) Mme and RNAse4 control (top) and Tfcp2l1AT2-KO (bottom). The proliferation state is shaded in yellow, and the AT2b state is shaded in blue.
Figure 6.
Figure 6.. Deep transcriptome analysis of lineage-traced Tfcp2l1-deficient AT2 cells reveals enhanced sensitivity to the post-injury inflammatory milieu
(A) Experimental schematic showing tamoxifen treatment, influenza infection, and the timing to sort lineage-traced EYFP cells to generate bulk RNA-seq libraries from control and Tfcp2l1AT2-KO mice. (B) Differential expression heatmap comparing control and Tfcp2l1AT2-KO mutants (n = 6). (C) Hallmark database gene set enrichment analysis of differentially expressed genes between control and Tfcp2l1AT2-KO mice 14 dpi. (D and E) Volcano plots from RNA-seq data control and Tfcp2l1AT2-KO mice 14 dpi, with dark blue dots indicating statistically significant different genes between control and Tfcp2l1AT2-KO in the E2F and inflammatory response categories (adjusted p < 0.05). An example gene in each category is highlighted in red. (F and G) qPCR gene expression validation of a subset of differentially expressed genes in the E2F and inflammatory response categories (control, n = 4; Tfcp2l1AT2-KO, n = 5).
Figure 7.
Figure 7.. Tfcp2l1 restrains the AT2 cell response to IL-1 signaling
(A) Experimental schematic showing the days for cytokine treatments and duration of organoid culture. (B) Organoids treated with PBS or IL-1b as noted. Lineage-marked cells are from native EYFP fluorescence, and IHC on sections for SFTPC and AGER expression reveals AT2 and AT1 cells, respectively (lineage panel bar graph, 1,000 μm; IHC bar graph, 50 μm). (C) Quantification of organoid size after 21 days in culture, comparing PBS and IL-1β in control and Tfcp2l1AT2-KO. (D) Summary diagram showing that Tfcp2l1 represses AT2 cell proliferation and inflammatory signaling. (E) Left: Tfcp2l1 is enriched in AT2 cells. The lack of Tfcp2l1 transient increases cell proliferation during lung regeneration. Right: Tfcp2l1 maintains AT2 cell identity and reduces AT2-AT1 cell differentiation. All data quantification data are represented as mean ± SEM. two-way ANOVA, Tukey test, and not significant; p ≤ 0.05, n = 3 mice per group.

References

    1. Torres Acosta MA, and Singer BD (2020). Pathogenesis of COVID-19-induced ARDS: implications for an ageing population. Eur. Respir. J 56, 2002049. 10.1183/13993003.02049-2020. - DOI - PMC - PubMed
    1. Flerlage T, Boyd DF, Meliopoulos V, Thomas PG, and Schultz-Cherry S (2021). Influenza virus and SARS-CoV-2: pathogenesis and host responses in the respiratory tract. Nat. Rev. Microbiol 19, 425–441. 10.1038/s41579-021-00542-7. - DOI - PMC - PubMed
    1. Boyd DF, Allen EK, Randolph AG, Guo XZJ, Weng Y, Sanders CJ, Bajracharya R, Lee NK, Guy CS, Vogel P, et al. (2020). Exuberant fibroblast activity compromises lung function via ADAMTS4. Nature 587, 466–471. 10.1038/s41586-020-2877-5. - DOI - PMC - PubMed
    1. Basil MC, Katzen J, Engler AE, Guo M, Herriges MJ, Kathiriya JJ, Windmueller R, Ysasi AB, Zacharias WJ, Chapman HA, et al. (2020). The cellular and physiological basis for lung repair and regeneration: past, present, and future. Cell Stem Cell 26, 482–502. 10.1016/j.stem.2020.03.009. - DOI - PMC - PubMed
    1. Hogan BLM, Barkauskas CE, Chapman HA, Epstein JA, Jain R, Hsia CCW, Niklason L, Calle E, Le A, Randell SH, et al. (2014). Repair and regeneration of the respiratory system: complexity, plasticity, and mechanisms of lung stem cell function. Cell Stem Cell 15, 123–138. 10.1016/j.stem.2014.07.012. - DOI - PMC - PubMed

Publication types

Substances