. 2023 Aug 2;35(8):2972-2996.
doi: 10.1093/plcell/koad119.

SALT OVERLY SENSITIVE2 stabilizes phytochrome-interacting factors PIF4 and PIF5 to promote Arabidopsis shade avoidance

Affiliations

SALT OVERLY SENSITIVE2 stabilizes phytochrome-interacting factors PIF4 and PIF5 to promote Arabidopsis shade avoidance

Run Han et al. Plant Cell. .

Abstract

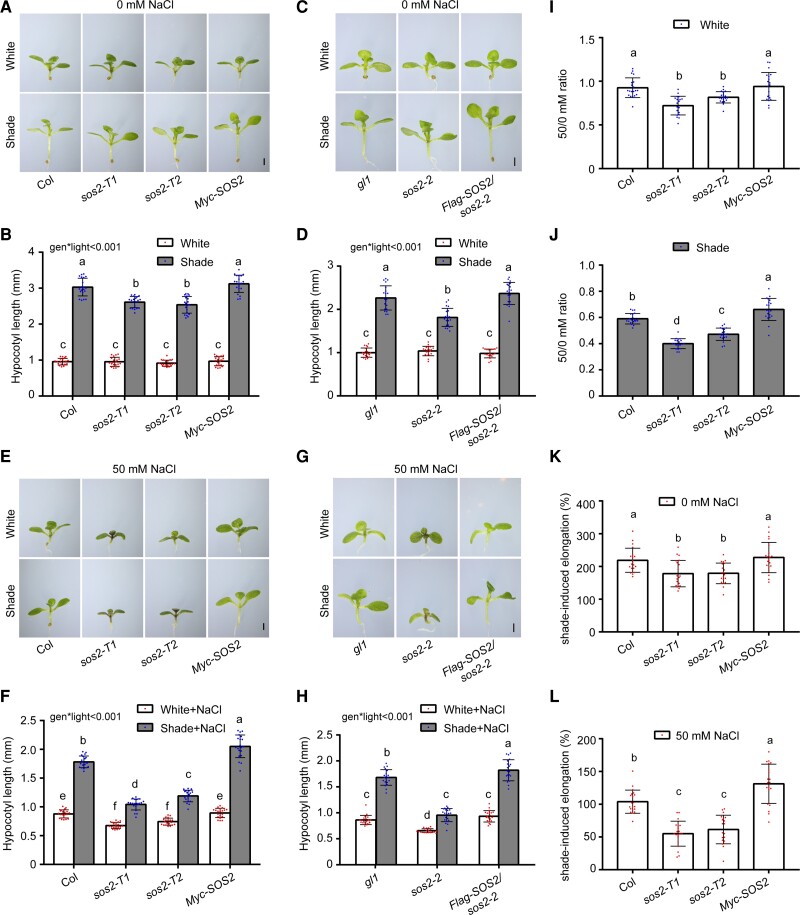
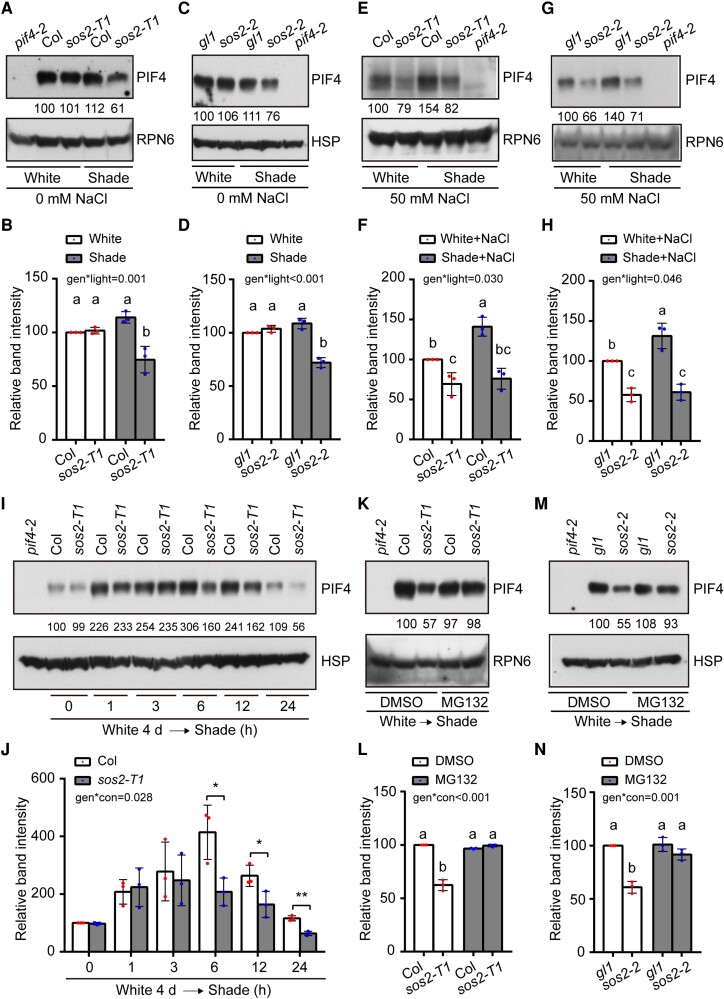
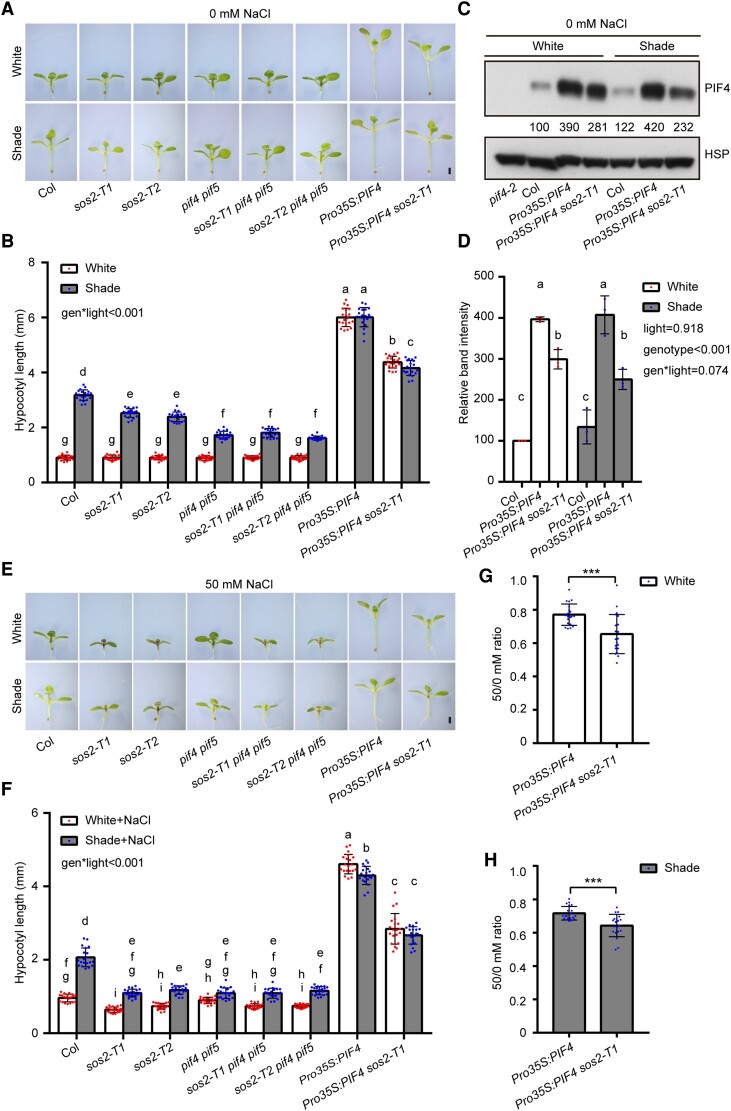
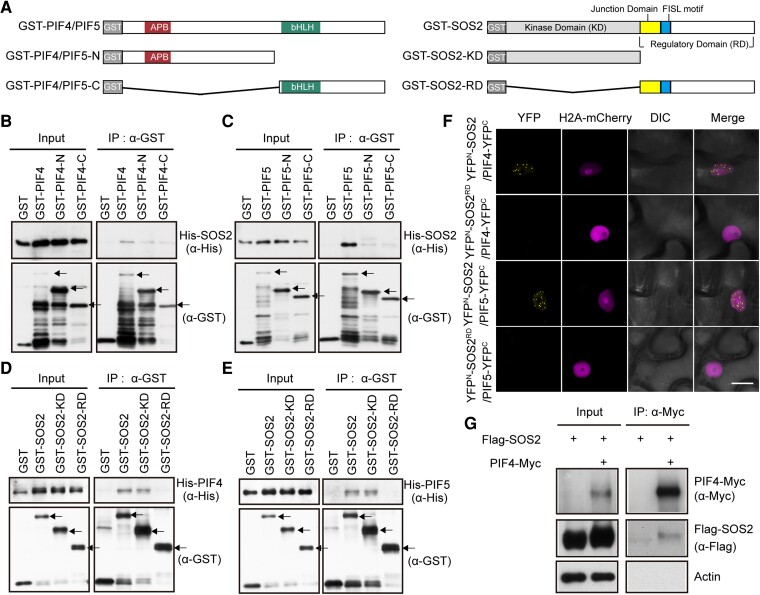
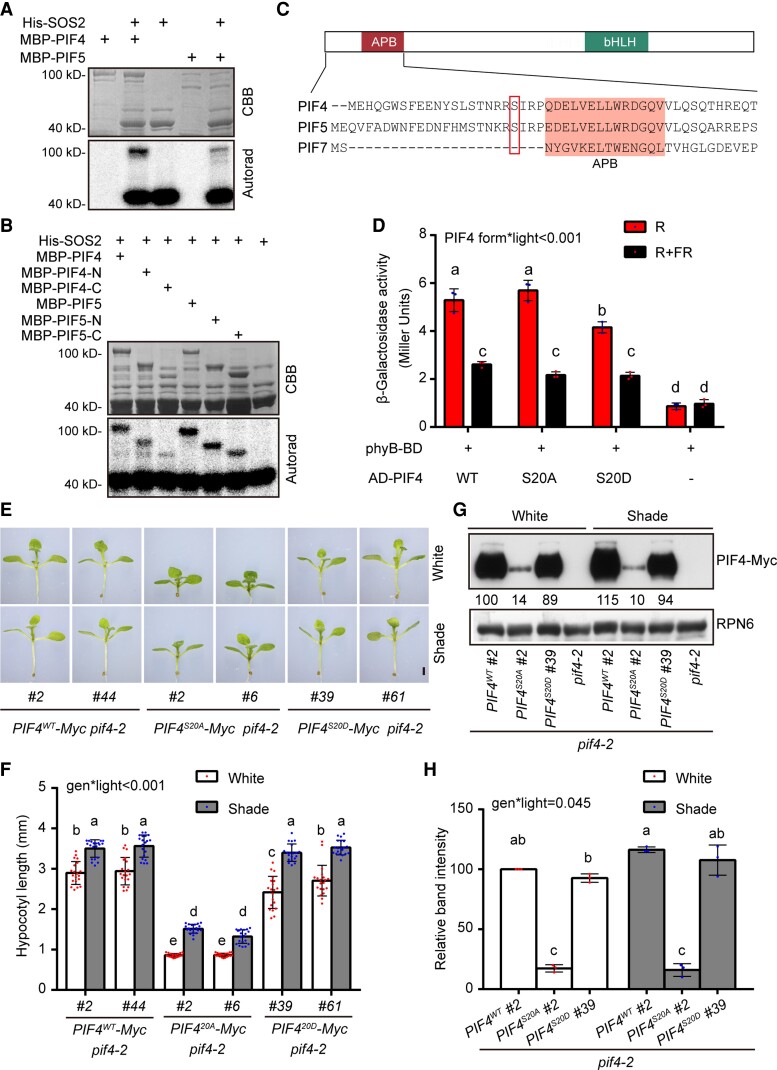
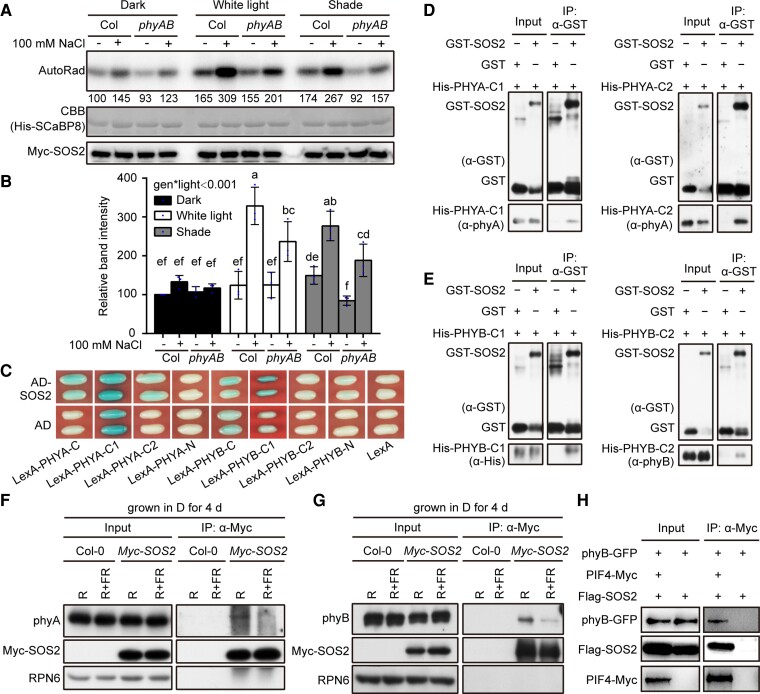
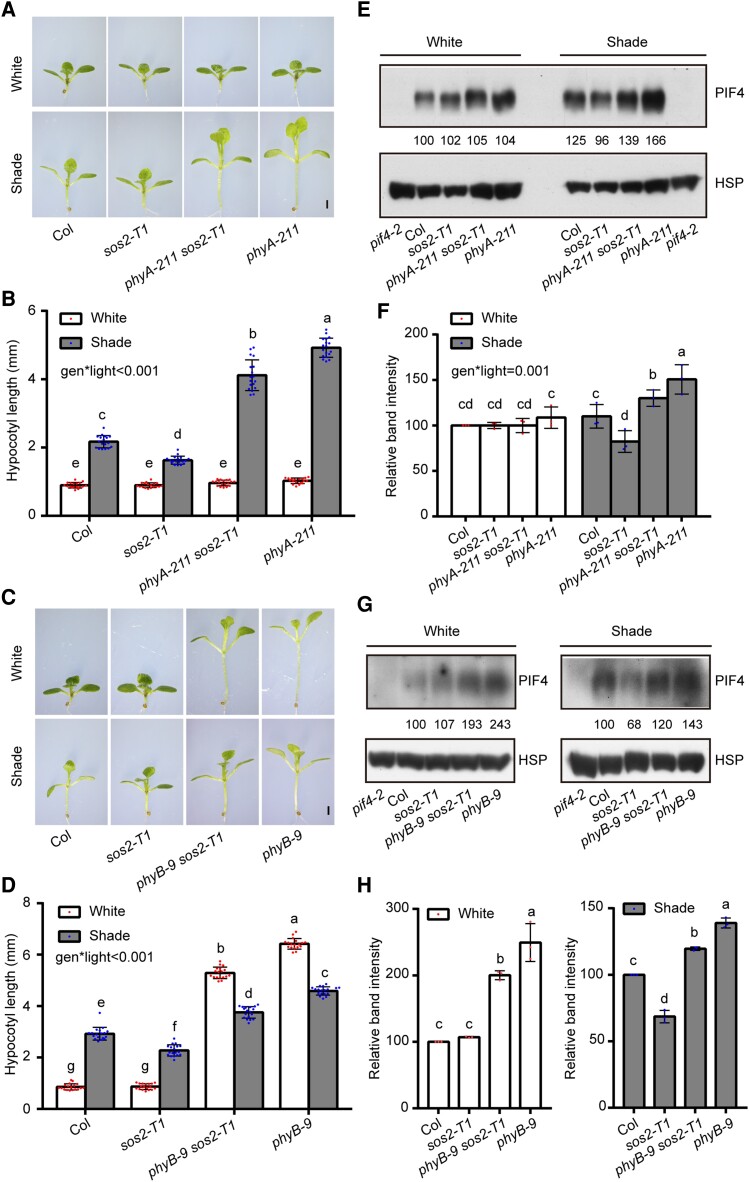
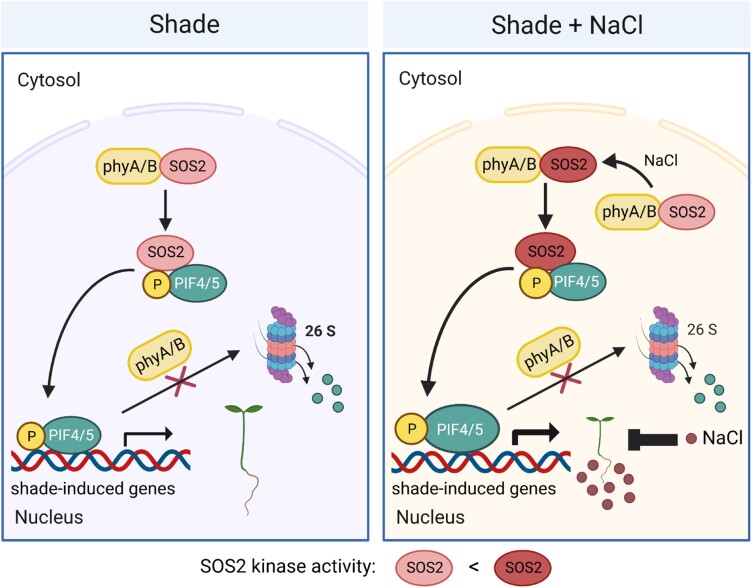
Sun-loving plants trigger the shade avoidance syndrome (SAS) to compete against their neighbors for sunlight. Phytochromes are plant red (R) and far-red (FR) light photoreceptors that play a major role in perceiving the shading signals and triggering SAS. Shade induces a reduction in the level of active phytochrome B (phyB), thus increasing the abundance of PHYTOCHROME-INTERACTING FACTORS (PIFs), a group of growth-promoting transcription factors. However, whether other factors are involved in modulating PIF activity in the shade remains largely obscure. Here, we show that SALT OVERLY SENSITIVE2 (SOS2), a protein kinase essential for salt tolerance, positively regulates SAS in Arabidopsis thaliana. SOS2 directly phosphorylates PIF4 and PIF5 at a serine residue close to their conserved motif for binding to active phyB. This phosphorylation thus decreases their interaction with phyB and posttranslationally promotes PIF4 and PIF5 protein accumulation. Notably, the role of SOS2 in regulating PIF4 and PIF5 protein abundance and SAS is more prominent under salt stress. Moreover, phyA and phyB physically interact with SOS2 and promote SOS2 kinase activity in the light. Collectively, our study uncovers an unexpected role of salt-activated SOS2 in promoting SAS by modulating the phyB-PIF module, providing insight into the coordinated response of plants to salt stress and shade.


Conflict of interest statement

Conflict of interest statement. The authors declare no conflict of interests.

Figures

Figure 1.
Figure 1.
SOS2 positively regulates SAS in Arabidopsis. A and B) Phenotypes A) and hypocotyl lengths B) of Col, sos2-T1, sos2-T2, and Pro35S:Myc-SOS2 seedlings grown under simulated W light or shade (R/FR, 0.4). C and D) Phenotypes C) and hypocotyl lengths D) of gl1, sos2-2 (in gl1 background), and Pro35S:Flag-SOS2 sos2-2 seedlings grown under simulated W light or shade (R/FR, 0.4). E and F) Phenotypes E) and hypocotyl lengths F) of Col, sos2-T1, sos2-T2, and Pro35S:Myc-SOS2 seedlings grown under simulated W light or shade (R/FR, 0.4) with 50 mm NaCl treatment. G and H) Phenotypes G) and hypocotyl lengths H) of gl1, sos2-2 (in gl1 background), and Pro35S:Flag-SOS2 sos2-2 seedlings grown under simulated W light or shade (R/FR, 0.4) with 50 mm NaCl treatment. I and J) The ratios of hypocotyl lengths for the indicated seedlings grown on 50 mm NaCl versus 0 mm NaCl under simulated W light I) or shade (R/FR, 0.4) J). Error bars represent Sd from 20 seedlings. Different letters represent significant differences determined by 1-way ANOVA with Tukey's post hoc test (P < 0.05; Supplemental Data Set 1). K and L) The percentage of shade-induced elongation for the indicated seedlings grown without NaCl K) and on 50 mm NaCl L). Error bars represent Sd from 20 seedlings. Different letters represent significant differences determined by 1-way ANOVA with Tukey's post hoc test (P < 0.05; Supplemental Data Set 1). In A) to H), the seedlings were first grown under simulated W light for 4 d and then transferred to simulated shade (R/FR, 0.4) or remained under simulated W light for 5 more days. In A), C), E), and G), scale bar = 1 mm. In B), D), F), and H), error bars represent Sd from 20 seedlings; different letters represent significant differences determined by 2-way ANOVA with Tukey's post hoc test (P < 0.05; Supplemental Data Set 1). The interaction P value between genotypes and light conditions is shown inset (Supplemental Data Set 1).
Figure 2.
Figure 2.
SOS2 promotes PIF4/PIF5 protein accumulation posttranslationally in the shade. A and B) Immunoblots showing the levels of PIF4 proteins in Col and sos2-T1 mutant seedlings grown under simulated W light or shade (R/FR, 0.4). Representative pictures are shown in A), and the relative levels of PIF4 proteins are shown in B). C and D) Immunoblots showing the levels of PIF4 proteins in gl1 and sos2-2 (in gl1 background) mutant seedlings grown under simulated W light or shade (R/FR, 0.4). Representative pictures are shown in C), and the relative levels of PIF4 proteins are shown in D). E and F) Immunoblots showing the levels of PIF4 proteins in Col and sos2-T1 mutant seedlings grown under simulated W light or shade (R/FR, 0.4) on 50 mm NaCl. Representative pictures are shown in E), and the relative levels of PIF4 proteins are shown in F). G and H) Immunoblots showing the levels of PIF4 proteins in gl1 and sos2-2 (in gl1 background) mutant seedlings grown under simulated W light or shade (R/FR, 0.4) on 50 mm NaCl. Representative pictures are shown in G), and the relative levels of PIF4 proteins are shown in H). I and J) Immunoblots showing the levels of PIF4 proteins in Col and sos2-T1 mutant seedlings grown under simulated W light for 4 d and then transferred to shade (R/FR, 0.4) for the indicated times. Representative pictures are shown in I), and the relative levels of PIF4 proteins are shown in J). In J), *P < 0.05 and **P < 0.01 (Student's t test; Supplemental Data Set 1) for the indicated pairs of samples. The interaction P value between genotypes and shade treatment time (conditions) was tested by 2-way ANOVA (Supplemental Data Set 1). K and L) Immunoblots showing the levels of PIF4 proteins in Col and sos2-T1 mutant seedlings grown under simulated W light for 4 d and then treated with mock (DMSO) or MG132 and transferred to shade (R/FR, 0.4) for 12 h. Representative pictures are shown in K) and the relative levels of PIF4 proteins are shown in L). M and N) Immunoblots showing the levels of PIF4 proteins in gl1 and sos2-2 (in gl1 background) mutant seedlings grown under simulated W light for 4 d and then treated with mock (DMSO) or MG132 and transferred to shade (R/FR, 0.4) for 12 h. Representative pictures are shown in M), and the relative levels of PIF4 proteins are shown in N). In A) to H), the seedlings were first grown under simulated W light for 4 d and then transferred to simulated shade (R/FR, 0.4) or remained under simulated W light for 5 more days. In A), E), G), and K), anti-RPN6 was used as a sample loading control; in C), I), and M), anti-HSP was used as a sample loading control. Numbers below the immunoblots in A), C), E), G), I), K), and M) indicate the relative band intensities of PIF4 normalized to the loading control. The ratio of the first clear band was set to 100. Error bars in B), D), F), H), J), L), and N) represent SD from 3 independent assays using 3 pools of seedlings. Different letters represent significant differences determined by 2-way ANOVA with Tukey's post hoc test (P < 0.05; Supplemental Data Set 1). The interaction P value between genotypes and light conditions is shown inset (Supplemental Data Set 1).
Figure 3.
Figure 3.
Genetic relationship between SOS2 and PIF4/PIF5 in mediating SAS. A and B) Phenotypes A) and hypocotyl lengths B) of Col, sos2-T1, sos2-T2, pif4 pif5, sos2-T1 pif4 pif5, sos2-T2 pif4 pif5, Pro35S:PIF4, and Pro35S:PIF4 sos2-T1 seedlings grown under simulated W light or shade (R/FR, 0.4). C and D) Immunoblots showing the levels of PIF4 proteins in Col, Pro35S:PIF4, and Pro35S:PIF4 sos2-T1 seedlings grown under simulated W light or shade (R/FR, 0.4). Anti-HSP was used as a sample loading control. Representative pictures are shown in C) and the relative levels of PIF4 proteins are shown in D). Numbers below the immunoblots in C) indicate the relative band intensities of PIF4 normalized to the loading control. The ratio of the first clear band was set to 100. E and F) Phenotypes E) and hypocotyl lengths F) of Col, sos2-T1, sos2-T2, pif4 pif5, sos2-T1 pif4 pif5, sos2-T2 pif4 pif5, Pro35S:PIF4, and Pro35S:PIF4 sos2-T1 seedlings grown under simulated W light or shade (R/FR, 0.4) on 50 mm NaCl. G and H) The ratios of hypocotyl lengths for the indicated seedlings grown on 50 mm NaCl versus 0 mm NaCl under simulated W light G) or shade (R/FR, 0.4) H). In A) to H), the seedlings were first grown under simulated W light for 4 d and then transferred to simulated shade (R/FR, 0.4) or remained under simulated W light for 5 more days. In A) and E), scale bar = 1 mm. Error bars in B), F), G), and H) represent Sd from 20 seedlings, and error bars in D) represent Sd from 3 independent assays using 3 pools of seedlings. Different letters in B), D), and F) represent significant differences determined by 2-way ANOVA with Tukey's post hoc test (P < 0.05; Supplemental Data Set 1). In G) and H), ***P < 0.001 (Student's t test; Supplemental Data Set 1) for the indicated pair of samples. The interaction P value between genotypes and light conditions is shown inset (Supplemental Data Set 1).
Figure 4.
Figure 4.
SOS2 physically interacts with PIF4 and PIF5. A) Schematic diagrams of GST-tagged PIF4/PIF5, PIF4/PIF5-N, PIF4/PIF5-C, SOS2, SOS2-KD, and SOS2-RD proteins. B and C) Pull-down assays showing that GST-tagged PIF4 B) and PIF5 C), but not GST alone, could pull down His-tagged SOS2 in vitro. The arrows indicate the GST-PIF4/5, GST-PIF4/5-N, and GST-PIF4/5-C proteins, respectively. D and E) Pull-down assays showing that GST-tagged SOS2 and SOS2-KD, but not GST alone, could pull down His-tagged PIF4 D) and PIF5 E) in vitro. The arrows indicate the GST-SOS2, GST-SOS2-KD, and GST-SOS2-RD proteins, respectively. F) BiFC assays showing the interactions between SOS2 and PIF4/PIF5 in N. benthamiana leaf cells. The indicated combinations of YFPN-SOS2, YFPN-SOS2RD PIF4-YFPC, and PIF5-YFPC constructs were co-transfected into N. benthamiana leaf cells, respectively. H2A-mCherry was the nuclear-localization marker. Scale bar = 20 μm. DIC, differential interference contrast. YFPN, N-terminal fragment of Yellow Fluorescent Protein; YFPC, C-terminal fragment of Yellow Fluorescent Protein. G) Co-IP assays showing that SOS2 associated with PIF4 in vivo. Flag-SOS2 and PIF4-Myc fusion proteins were transiently expressed in Arabidopsis (Col) protoplasts. Total proteins were extracted and incubated with Myc-trap agarose beads (AlpaLife). Total and precipitated proteins were examined by immunoblotting using antibodies against Myc, Flag and Actin, respectively.
Figure 5.
Figure 5.
SOS2 promotes PIF4 protein stability by phosphorylating a serine residue near to the APB motif. A and B) In vitro kinase assays showing that SOS2 directly phosphorylates full-length A) and truncated B) PIF4 and PIF5 proteins. In A) and B), top panels show CBB–stained SDS–PAGE gel containing His-SOS2 and MBP-PIF4/PIF5 proteins, and bottom panels show autoradiographs (Autorad) indicating SOS2 autophosphorylation (bottom bands) and MBP-PIF4/PIF5 phosphorylation (top bands). C) Schematic diagram of the domain structures of PIFs and the N-terminal sequences of PIF4, PIF5, and PIF7. The APB–binding motif (Khanna et al. 2004) is shaded, and the SOS2-phosphorylated serine residues in PIF4 and PIF5 are boxed. D) PIF4WT and PIF4S20A interacted with the Pfr form of phyB more strongly than PIF4S20D in yeast cells. Yeast cells transformed with the indicated plasmids were used for ONPG assays. The yeast cultures were irradiated with 5 min of R, or 5 min of R immediately followed by 5 min of FR, and then incubated for 2 h. The yeast cultures were then exposed to the same R or R + FR light treatments again and incubated for another 2 h. The β-galactosidase activities were then measured by liquid culture assays using ONPG as the substrate. Error bars represent Sd of 3 independent yeast cultures. Different letters represent significant differences determined by 2-way ANOVA with Tukey's post hoc test (P < 0.05; Supplemental Data Set 1). The interaction P value between PIF4 forms and light conditions is shown inset (Supplemental Data Set 1). E and F) Phenotypes E) and hypocotyl lengths F) of Super:PIF4WT-Myc pif4-2, Super:PIF4S20A-Myc pif4-2, and Super:PIF4S20D-Myc pif4-2 seedlings grown under simulated W light or shade (R/FR, 0.4). For each transgene, 2 independent homozygous lines with similar PIF4 expression levels were selected for further analyses. G and H) Immunoblots showing the levels of PIF4 proteins in Super:PIF4WT-Myc pif4-2, Super:PIF4S20A-Myc pif4-2, and Super:PIF4S20D-Myc pif4-2 seedlings grown under simulated W light or shade (R/FR, 0.4). Anti-RPN6 was used as a sample loading control. Representative pictures are shown in G), and the relative levels of PIF4 proteins are shown in H). Numbers below the immunoblots in G) indicate the relative band intensities of PIF4 normalized to the loading control. The ratio of the first band was set to 100. In E) to H), the seedlings were first grown under simulated W light for 4 d and then transferred to simulated shade (R/FR, 0.4) or remained under simulated W light for 5 more days. In E), scale bar = 1 mm. Error bars in F) represent Sd from 20 seedlings, and error bars in H) represent Sd from 3 independent assays using 3 pools of seedlings. Different letters in F) and H) represent significant differences determined by 2-way ANOVA with Tukey's post hoc test (P < 0.05; Supplemental Data Set 1). The interaction P value between genotypes and light conditions is shown inset (Supplemental Data Set 1).
Figure 6.
Figure 6.
SOS2 physically interacts with phyA and phyB. A, B) Semi-in vivo kinase assays showing SOS2 kinase activity in Pro35S:Myc-SOS2 and Pro35S:Myc-SOS2 phyA phyB seedlings grown under different light conditions. Dark, the seedlings were grown in darkness for 9 d; W light, the seedlings were grown in continuous W light (PAR, 50 μmol m−2 s−1) for 9 d; shade, the seedlings were first grown in continuous W light (PAR, 50 μmol m−2 s−1) for 5 d and transferred to simulated shade (R/FR, 0.6) for another 4 d and then treated with mock (-NaCl) or 100 mm NaCl for 12 h. Top panel shows autoradiograph indicating SOS2 kinase activity, middle panel shows CBB–stained SDS–PAGE gel containing His-SCaBP8 protein used as the SOS2 substrate, and bottom panel shows the immunoprecipitated Myc-SOS2 proteins detected by immunoblotting. Representative pictures are shown in A), and the relative levels of SOS2 kinase activity are shown in B). In A), numbers below the autoradiograph indicate the relative band intensities of SOS2 kinase activity normalized to those of the immunoprecipitated Myc-SOS2 proteins, respectively. The ratio of the first band was set to 100 for the gel. The results of the other 2 assays are shown in Supplemental Fig. S19. In B), error bars represent Sd from 3 independent assays using 3 pools of seedlings. Different letters represent significant differences by 2-way ANOVA with Duncan's post hoc test (P < 0.05; Supplemental Data Set 1). The interaction P value between genotypes and light conditions is shown inset (Supplemental Data Set 1). C) Yeast 2-hybrid assays showing that the HKRD domain (C2) of PHYA and the PRD domain (C1) of PHYB interact with SOS2 in yeast cells. D and E) Pull-down assays showing that GST-tagged SOS2, but not GST alone, could pull down His-tagged PRD domains (C1) and HKRD domains (C2) of PHYA and PHYB in vitro. F and G) Co-IP assays showing that SOS2 associated with phyA and phyB in vivo. Col and Pro35S:Myc-SOS2 seedlings were first grown in darkness for 4 d, then the total proteins were extracted and treated with 5 min of R light or with 5 min of R light followed by 5 min of FR light (R + FR) and then incubated with anti-Myc Affinity Gel (Sigma-Aldrich). The total and precipitated proteins were subjected to immunoblot analyses with antibodies against phyA, phyB, Myc, and RPN6, respectively. H) Co-IP assays showing that PIF4 associated with SOS2 and phyB in vivo. PIF4-Myc, phyB-GFP, and Flag-SOS2 proteins were first transiently expressed in Arabidopsis (Col-0) protoplasts, and then total proteins were extracted and incubated with Myc-trap agarose beads (AlpaLife). Total and precipitated proteins were examined by immunoblotting using antibodies against Myc, Flag, and GFP, respectively.
Figure 7.
Figure 7.
SOS2 genetically interacts with phyA/phyB in mediating SAS. A and B) Phenotypes A) and hypocotyl lengths B) of Col, sos2-T1, phyA-211 sos2-T1, and phyA-211 seedlings first grown under simulated W light for 4 d and then transferred to simulated shade (R/FR, 0.4) or remained under simulated W light for 5 more days. In A), scale bar = 1 mm. In B), error bars represent Sd from 18 seedlings. Different letters represent significant differences by 2-way ANOVA with Tukey's post hoc test (P < 0.05; Supplemental Data Set 1). The interaction P value between genotypes and light conditions is shown inset (Supplemental Data Set 1). C and D) Phenotypes C) and hypocotyl lengths D) of Col, sos2-T1, phyB-9 sos2-T1, and phyB-9 seedlings first grown under simulated W light for 4 d and then transferred to simulated shade (R/FR, 0.8) or remained under simulated W light for 5 more days. In C), scale bar = 1 mm. In D), error bars represent Sd from 18 seedlings. Different letters represent significant differences by 2-way ANOVA with Tukey's post hoc test (P < 0.05; Supplemental Data Set 1). The interaction P value between genotypes and light conditions is shown inset (Supplemental Data Set 1). E and F) Immunoblots showing the levels of PIF4 proteins in Col, sos2-T1, phyA-211 sos2-T1, and phyA-211 seedlings first grown under simulated W light for 4 d and then transferred to simulated shade (R/FR, 0.4) or remained under simulated W light for 5 more days. Anti-HSP was used as sample loading control. Representative pictures are shown in E), and the relative levels of PIF4 proteins are shown in F). The interaction P value between genotypes and light conditions is shown inset (Supplemental Data Set 1). G and H) Immunoblots showing the levels of PIF4 proteins in Col, sos2-T1, phyB-9 sos2-T1, and phyB-9 seedlings first grown under simulated W light for 4 d and then transferred to simulated shade (R/FR, 0.8) or remained under simulated W light for 5 more days. Anti-HSP was used as sample loading control. Representative pictures are shown in G), and the relative levels of PIF4 proteins are shown in H). In E) and G), numbers below the immunoblots indicate the relative band intensities of PIF4 normalized to the loading control. The ratio of the first clear band was set to 100. Error bars in F) and H) represent Sd from 3 independent assays using 3 pools of seedlings. Different letters represent significant differences by 2-way F) and 1-way ANOVA H) with Duncan's post hoc test (P < 0.05; Supplemental Data Set 1).
Figure 8.
Figure 8.
A working model depicting that SOS2 positively regulates SAS by promoting PIF4 and PIF5 protein accumulation in the shade. In the shade, phyA and phyB interact with SOS2 and promote its kinase activity. SOS2 directly phosphorylates PIF4 and PIF5 at a serine residue close to their APB motif, thus decreasing their interactions with phyB. Therefore, SOS2 inhibits 26S proteasome-mediated degradation of PIF4/PIF5 and posttranslationally promotes their protein accumulation in the shade. Increased levels of PIF4/PIF5 proteins promote hypocotyl elongation in the shade by modulating the expression of shade-responsive genes. Under both shade and salt stress, shade-induced hypocotyl growth of Arabidopsis seedlings is overall inhibited by salt stress (Hayes et al. 2019), but salt-activated SOS2 more robustly promotes PIF4 and PIF5 protein accumulation.

References

    1. Bae G, Choi G. Decoding of light signals by plant phytochromes and their interacting proteins. Annu Rev Plant Biol. 2008:59(1):281–311. 10.1146/annurev.arplant.59.032607.092859 - DOI - PubMed
    1. Ballaré CL, Scopel AL, Sánchez RA. Far-red radiation reflected from adjacent leaves: an early signal of competition in plant canopies. Science 1990:247(4940):329–332. 10.1126/science.247.4940.329 - DOI - PubMed
    1. Bauer D, Viczián A, Kircher S, Nobis T, Nitschke R, Kunkel T, Panigrahi KC, Adám E, Fejes E, Schäfer E, et al. . Constitutive photomorphogenesis 1 and multiple photoreceptors control degradation of phytochrome interacting factor 3, a transcription factor required for light signaling in Arabidopsis. Plant Cell 2004:16(6):1433–1445. 10.1105/tpc.021568 - DOI - PMC - PubMed
    1. Bernardo-García S, de Lucas M, Martínez C, Espinosa-Ruiz A, Davière J-M, Prat S. BR-dependent phosphorylation modulates PIF4 transcriptional activity and shapes diurnal hypocotyl growth. Genes Dev. 2014:28(15):1681–1694. 10.1101/gad.243675.114 - DOI - PMC - PubMed
    1. Bu Q, Zhu L, Dennis MD, Yu L, Lu SX, Person MD, Tobin EM, Browning KS, Huq E. Phosphorylation by CK2 enhances the rapid light-induced degradation of phytochrome interacting factor 1 in Arabidopsis. J Biol Chem. 2011:286(14):12066–12074. 10.1074/jbc.M110.186882 - DOI - PMC - PubMed

Publication types

MeSH terms

LinkOut - more resources