. 2023 May:91:104589.
doi: 10.1016/j.ebiom.2023.104589. Epub 2023 Apr 27.

CSF neopterin, quinolinic acid and kynurenine/tryptophan ratio are biomarkers of active neuroinflammation

Affiliations

CSF neopterin, quinolinic acid and kynurenine/tryptophan ratio are biomarkers of active neuroinflammation

Jingya Yan et al. EBioMedicine. 2023 May.

Abstract

Background: Defining the presence of acute and chronic brain inflammation remains a challenge to clinicians due to the heterogeneity of clinical presentations and aetiologies. However, defining the presence of neuroinflammation, and monitoring the effects of therapy is important given its reversible and potentially damaging nature. We investigated the utility of CSF metabolites in the diagnosis of primary neuroinflammatory disorders such as encephalitis and explored the potential pathogenic role of inflammation in epilepsy.

Methods: Cerebrospinal fluid (CSF) collected from 341 paediatric patients (169 males, median age 5.8 years, range 0.1-17.1) were examined. The patients were separated into a primary inflammatory disorder group (n = 90) and epilepsy group (n = 80), who were compared with three control groups including neurogenetic and structural (n = 76), neurodevelopmental disorders, psychiatric and functional neurological disorders (n = 63), and headache (n = 32).

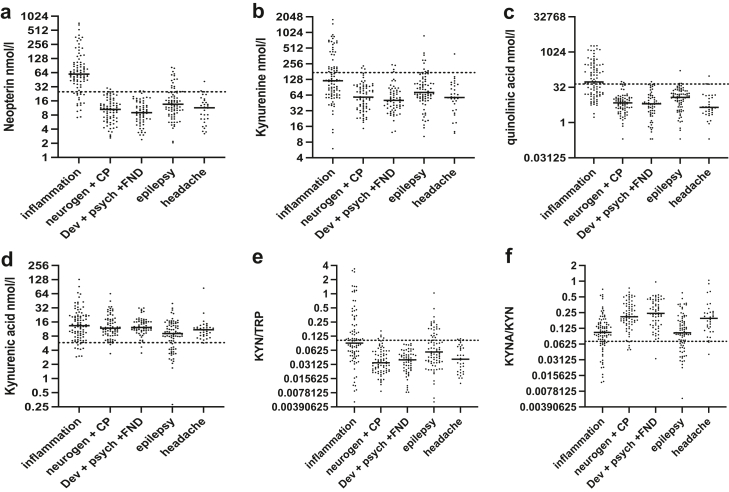
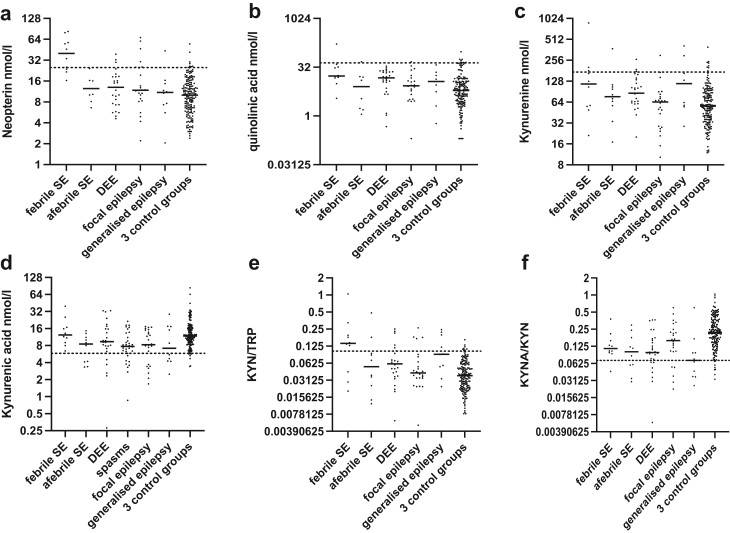
Findings: There were statistically significant increases of CSF neopterin, kynurenine, quinolinic acid and kynurenine/tryptophan ratio (KYN/TRP) in the inflammation group compared to all control groups (all p < 0.0003). As biomarkers, at thresholds with 95% specificity, CSF neopterin had the best sensitivity for defining neuroinflammation (82%, CI 73-89), then quinolinic acid (57%, CI 47-67), KYN/TRP ratio (47%, CI 36-56) and kynurenine (37%, CI 28-48). CSF pleocytosis had sensitivity of 53%, CI 42-64). The area under the receiver operating characteristic curve (ROC AUC) of CSF neopterin (94.4% CI 91.0-97.7%) was superior to that of CSF pleocytosis (84.9% CI 79.5-90.4%) (p = 0.005). CSF kynurenic acid/kynurenine ratio (KYNA/KYN) was statistically decreased in the epilepsy group compared to all control groups (all p ≤ 0.0003), which was evident in most epilepsy subgroups.

Interpretation: Here we show that CSF neopterin, kynurenine, quinolinic acid and KYN/TRP are useful diagnostic and monitoring biomarkers of neuroinflammation. These findings provide biological insights into the role of inflammatory metabolism in neurological disorders and provide diagnostic and therapeutic opportunities for improved management of neurological diseases.

Funding: Financial support for the study was granted by Dale NHMRC Investigator grant APP1193648, University of Sydney, Petre Foundation, Cerebral Palsy Alliance and Department of Biochemistry at the Children's Hospital at Westmead. Prof Guillemin is funded by NHMRC Investigator grant APP 1176660 and Macquarie University.

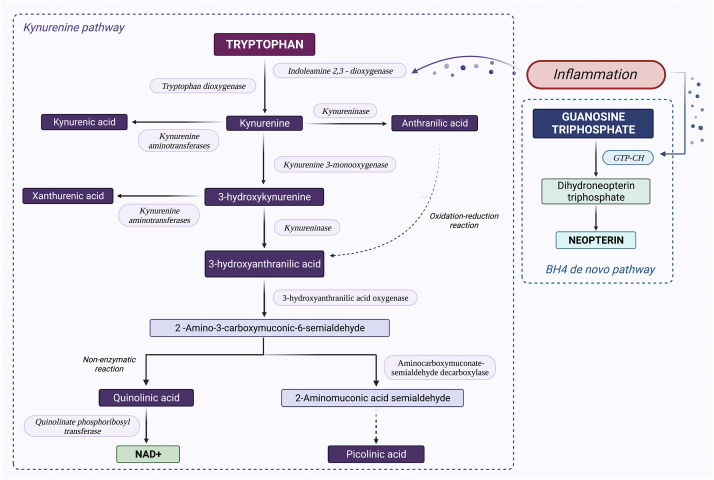
Keywords: Cerebrospinal fluid metabolomics; Encephalitis; Epilepsy; Kynurenine pathway; Neopterin; Neurodevelopmental disorders.


Conflict of interest statement

Declaration of interests M Farrar reports grants from NHMRC and Cerebral Palsy Alliance Research Foundation, honoraria for educational presentations from Roche, Biogen and Novartis, participation on advisory board for Novartis Gene therapies and Roche, being medical director for Muscular dystrophy NSW and member of scientific and medical committee of Childhood dementia and Friedreich's ataxia. R Dale reports honorarium from Beijing pediatric neurology conference. The other authors have declared that no conflict of interest exists.

Figures

Fig. 1
Fig. 1
Neopterin and kynurenine pathways including enzymes. GTP-CH: guanosine triphosphate cyclohydrolase, NAD+: Nicotinamide adenine dinucleotide+.
Fig. 2
Fig. 2
Neopterin and kynurenine pathway metabolites in the 5 subgroups. CSF Neopterin (a), Kynurenine (b), quinolinic acid (c), and kynurenic acid (d), plus the ratios of KYN/TRP (e) and KYNA/KYN (f) are presented as log2 of nmol/l in the two groups of interest (inflammation n = 90 and epilepsy n = 80) and the three control groups (n = 171). The median of the groups is presented as a bar. The 95th centile of the 3 control groups is presented as a dotted line for Neopterin, kynurenine, quinolinic acid and KYN/TRP, and the 5th centile of the 3 control groups is presented as a dotted line for kynurenic acid and KYNA/KYN. As can be seen neopterin is a strongly differentiating biomarker of neuroinflammation, with kynurenine, quinolinic acid and KYN/TRP also differentiating neuroinflammation. In addition, there is evidence of inflammation in some patients with epilepsy. Kynurenic acid is decreased in the epilepsy group (d), as is KYNA/KYN (f) (all pairwise statistical comparisons are presented in Table 2).
Fig. 3
Fig. 3
CSF metabolites in epilepsy subgroups. The same metabolites and ratios are presented as for Fig. 2. The three control groups are presented as one large group (n = 171), and the 95th centile (for neopterin, quinolinic acid, kynurenine, and KYN/TRP) and the 5th centile (for kynurenic acid and KYNA/KYN) are presented as dotted lines. The subgroups of the epilepsy group (n = 80) are presented, as per Table 2. As can be seen, most of the inflammatory signal (as per neopterin) is generated by the febrile status group (a). Kynurenic acid (d) and KYNA/KYN (f) is generally low in all epilepsy subgroups, compared to controls. The median of the groups is presented as a bar.
Fig. 4
Fig. 4
Heat map in all groups, and correlations in inflammation and epilepsy groups. (a) Heat map shows that most of the elevated metabolite signal (red) and decreased metabolite signal (blue) is from the inflammation group (salmon colour in top bar), and to a lesser extent from the epilepsy group (pale blue colour in top bar). (b) Correlations for inflammation group demonstrates the positive correlations between metabolites (red) and negative correlations (blue). (c) Correlations for the epilepsy group shows some positive and negative correlations, although generally less than for the inflammation group. For (b) and (c): red cells represent positive correlations, blue cells represent negative correlations, grey font represents non-statistically significant correlation coefficients, the bolded black font represents Spearman's correlation coefficient (R) with p < 0.05, and bolded purple font represents R with p < 0.01.
Fig. 5
Fig. 5
Longitudinal monitoring in monophasic and chronic neuroinflammatory conditions. Longitudinal sampling shows the utility of the main inflammatory metabolites for comparing monophasic inflammation (left column) compared to chronic inflammation (right column). The cases with monophasic inflammation (n = 3) or chronic inflammation (n = 3) measured over 2 or 3 timelines (T1, T2, T3), show that in monophasic inflammation the inflammatory metabolites are initially elevated but then decline and normalize over time (a, c, e, g). Whereas the chronic patients had persistently elevated values over the 2 or 3 time points (b, d, f, h). All data presented in log2 scale, and the 95th centile of the 3 control groups is presented as a dotted line.
Graphical abstract
Graphical abstract

References

    1. Fung A., Vizcaychipi M., Lloyd D., Wan Y., Ma D. Central nervous system inflammation in disease related conditions: mechanistic prospects. Brain Res. 2012;1446:144–155. - PubMed
    1. Liu J., Cao X. Cellular and molecular regulation of innate inflammatory responses. Cell Mol Immunol. 2016;13(6):711–721. - PMC - PubMed
    1. Lukens J.R., Eyo U.B. Microglia and neurodevelopmental disorders. Annu Rev Neurosci. 2022;45:425–445. - PMC - PubMed
    1. Tanaka M., Toldi J., Vécsei L. Exploring the etiological links behind neurodegenerative diseases: inflammatory cytokines and bioactive kynurenines. Int J Mol Sci. 2020;21(7) - PMC - PubMed
    1. Donat C.K., Scott G., Gentleman S.M., Sastre M. Microglial activation in traumatic brain injury. Front Aging Neurosci. 2017;9:208. - PMC - PubMed