. 2023 Aug 9;224(4):iyad078.
doi: 10.1093/genetics/iyad078.

Rare disease research resources at the Rat Genome Database

Affiliations

Rare disease research resources at the Rat Genome Database

Mary L Kaldunski et al. Genetics. .

Abstract

Rare diseases individually affect relatively few people, but as a group they impact considerable numbers of people. The Rat Genome Database (https://rgd.mcw.edu) is a knowledgebase that offers resources for rare disease research. This includes disease definitions, genes, quantitative trail loci (QTLs), genetic variants, annotations to published literature, links to external resources, and more. One important resource is identifying relevant cell lines and rat strains that serve as models for disease research. Diseases, genes, and strains have report pages with consolidated data, and links to analysis tools. Utilizing these globally accessible resources for rare disease research, potentiating discovery of mechanisms and new treatments, can point researchers toward solutions to alleviate the suffering of those afflicted with these diseases.

Keywords: Rat Genome Database; ontologies; rare diseases.


Conflict of interest statement

Conflicts of interest statement The author(s) declare no conflict of interest.

Figures

Fig. 1.
Fig. 1.
RGD strain report pages. Strain nomenclature, IDs, alleles, type (mutant, inbred), sources, origins, curated references and annotations, and more are available on the report page for each strain https://rgd.mcw.edu/rgdweb/report/strain/main.html?id=126925978).
Fig. 2.
Fig. 2.
RGD disease ontology term report page. Disease term report pages include consolidated information including definitions, synonyms, links, gene/strain lists, and tools. a) Indicates the cross references to multiple disease ontology resources and external links. b) Indicates categories of lists on the disease report page for genes in rat (default), other species by sequence orthology, rat strains, and cell lines with annotations to the disease. Where applicable, human clinical variants will be listed when the human tab is selected. Lists are downloadable. c) Indicates the RGD toolbox icon that allows the gene list to be analyzed directly in any of the RGD suite of analysis tools, for example a MOET gene list enrichment analysis. (https://rgd.mcw.edu/rgdweb/ontology/annot.html?acc_id=DOID:9119).
Fig. 3.
Fig. 3.
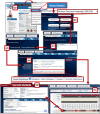
Accessing rare disease report pages and data in RGD. a) Indicates the general search box on the RGD homepage, in which to enter a search term. b) Indicates the general search results page with categories for objects such as genes and ontologies. c) Indicates the Ontology and Annotation search tool, as an alternative search path to access ontology terms. d) Indicates the Ontology Search results, accessible from the Ontology and Annotation search or by selecting an ontology in the general search results. In the ontologies, a green branch icon will open the disease ontology tree. The red A box will open a disease report page (as shown in Fig. 2). e) Indicates the RGD Disease Portals landing page (https://rgd.mcw.edu/rgdweb/portal/index.jsp), which provides another path to explore the disease ontology, in this case for cancer and neoplastic diseases, and reach disease report pages (https://rgd.mcw.edu/rgdweb/ontology/view.html?acc_id=DOID:9119). Supplementary Figure 1 provides an expanded view of Fig. 3.
Fig. 4.
Fig. 4.
RGD tools to search and analyze data. a) Indicates the categories of lists on the disease report page for genes, strains, and cell lines annotated to the disease. Selecting the Strains tab will change the display from the gene list in rat (default) to rat strains. b) Indicates the location of the Find Models tool on the RGD homepage in the Phenotypes & Models menu (https://rgd.mcw.edu/rgdweb/models/findModels.html). c) Indicates the direct Strain Search available on the RGD homepage (https://rgd.mcw.edu/rgdweb/search/strains.html). In the search results, a blue “PM” icon in the list of strains indicates that there is PhenoMiner data for that strain. Likewise, a purple “VV” icon indicates that RGD has variant data for that strain in the Variant Visualizer tool. d) Indicates the tools available on the right side of the strain search results page, including the ability to download the list, search for strain-specific variants using the Variant Visualizer, or explore quantitative measurements in the PhenoMiner tool for the strains listed and selected. Supplementary Figure 2 provides an expanded view of the details in Fig. 4.
Fig. 5.
Fig. 5.
RGD PhenoMiner repository of quantitative phenotype data (https://rgd.mcw.edu/rgdweb/phenominer/ontChoices.html). a) Indicates strains populating the Rat Strains bucket in the PhenoMiner data selection panels, as they would if entering via the Rat Strains search tool (from Fig. 4d). b) Indicates the Clinical Measurements tab, which will show phenotypes for which the selected strains have data. c) Indicates the Select buttons to load chosen phenotypes into the Clinical Measurements bucket. d) Indicates the Generate Report button, after selections are completed. e) Indicates the PhenoMiner report page, which consists of a graph (if phenotypes share a set of units of measure) and a table of the data, which can be manipulated or downloaded. The left-hand menu facilitates further filtering of data selections. 5f indicates the changes to the report page if “colored by” is changed to Phenotype, which also updates the graph legend; and the table is sorted, which will also sort the bars in the graph. Supplementary Figure 3 provides an expanded view of the details of Fig. 5.
Fig. 6.
Fig. 6.
RGD gene and strain search for cystic fibrosis disease. a) Indicates the RGD homepage Gene Search tool and the Data/Gene Search menu selections that are starting points for investigation of the Cftr gene. b) Indicates the gene report page (https://rgd.mcw.edu/rgdweb/report/gene/main.html?id=2332) and the menu option for the RGD manually curated disease annotations, including links to the referenced papers. c) Indicates the menu selection option of variants in the Cftr rat gene. d) Indicates the same menu selection after selecting the human gene report instead of rat. Supplementary Figure 4 provides an expanded view of the details of Fig. 6.
Fig. 7.
Fig. 7.
RGD variant visualizer tool, CFTR example (https://rgd.mcw.edu/rgdweb/front/config.html). a) Indicates the RGD Analysis & Visualization menu dropdown for selecting the RGD tool Variant Visualizer. b), c), and d) Indicate the subsequent pages on which to select human, rat, or dog assembly and Limit by Genes to enter the gene symbol or a list, and select the sample in which to search for variants. e) Indicates selection of options, in this case to specify the clinical significance for variants listed in ClinVar as Pathogenic or Likely Pathogenic (https://rgd.mcw.edu/rgdweb/front/config.html?mapKey=38&geneList=cftr&chr=&start=&stop=&geneStart=&geneStop=&geneList=cftr&strain%5B%5D=2&sample1=2). f) Indicates the query result page, which displays the details for 624 pathogenic/likely pathogenic human variants in the CFTR gene with a scrollbar. g) Clicking on any one of the variants will display a pop-up with variant details. Supplementary Figure 5 provides an expanded view of the details of Fig. 7, and an additional explanation of rat variants in AML strains.
Fig. 8.
Fig. 8.
RGD VCMap virtual comparative mapping (https://rgd.mcw.edu/vcmap/). a) Indicates the front page of the tool. b) Indicates the selection menu page. c) Indicates the results page showing multiple species’ chromosome positions, based on sequence.

References

    1. D'Andrea AD. Susceptibility pathways in fanconi's anemia and breast cancer. N Engl J Med. 2010;362(20):1909–1919. doi:10.1056/NEJMra0809889. - DOI - PMC - PubMed
    1. Dozzo A, Galvin A, Shin JW, Scalia S, O'Driscoll CM, Ryan KB. Modelling acute myeloid leukemia (AML): what's New? A transition from the classical to the modern. Drug Deliv Transl Res. 2022. doi:10.1007/s13346-022-01189-4. - DOI - PMC - PubMed
    1. Ehrhart F, Willighagen EL, Kutmon M, van Hoften M, Curfs LMG, Evelo CT. A resource to explore the discovery of rare diseases and their causative genes. Sci Data. 2021;8(1):124. doi:10.1038/s41597-021-00905-y. - DOI - PMC - PubMed
    1. Fang EF, Kassahun H, Croteau DL, Scheibye-Knudsen M, Marosi K, Lu H, Shamanna RA, Kalyanasundaram S, Bollineni RC, Wilson MA, et al. . Nad(+) replenishment improves lifespan and healthspan in ataxia telangiectasia models via mitophagy and DNA repair. Cell Metab. 2016;24(4):566–581. doi:10.1016/j.cmet.2016.09.004. - DOI - PMC - PubMed
    1. Feinberg AP, Williams BR. Wilms’ tumor as a model for cancer biology. Methods Mol Biol. 2003;222:239–248. doi:10.1385/1-59259-328-3:239. - DOI - PubMed

Publication types