. 2023 Jun 1;31(6):713-723.e3.
doi: 10.1016/j.str.2023.04.005. Epub 2023 Apr 28.

Computational modeling and prediction of deletion mutants

Affiliations

Computational modeling and prediction of deletion mutants

Hope Woods et al. Structure. .

Abstract

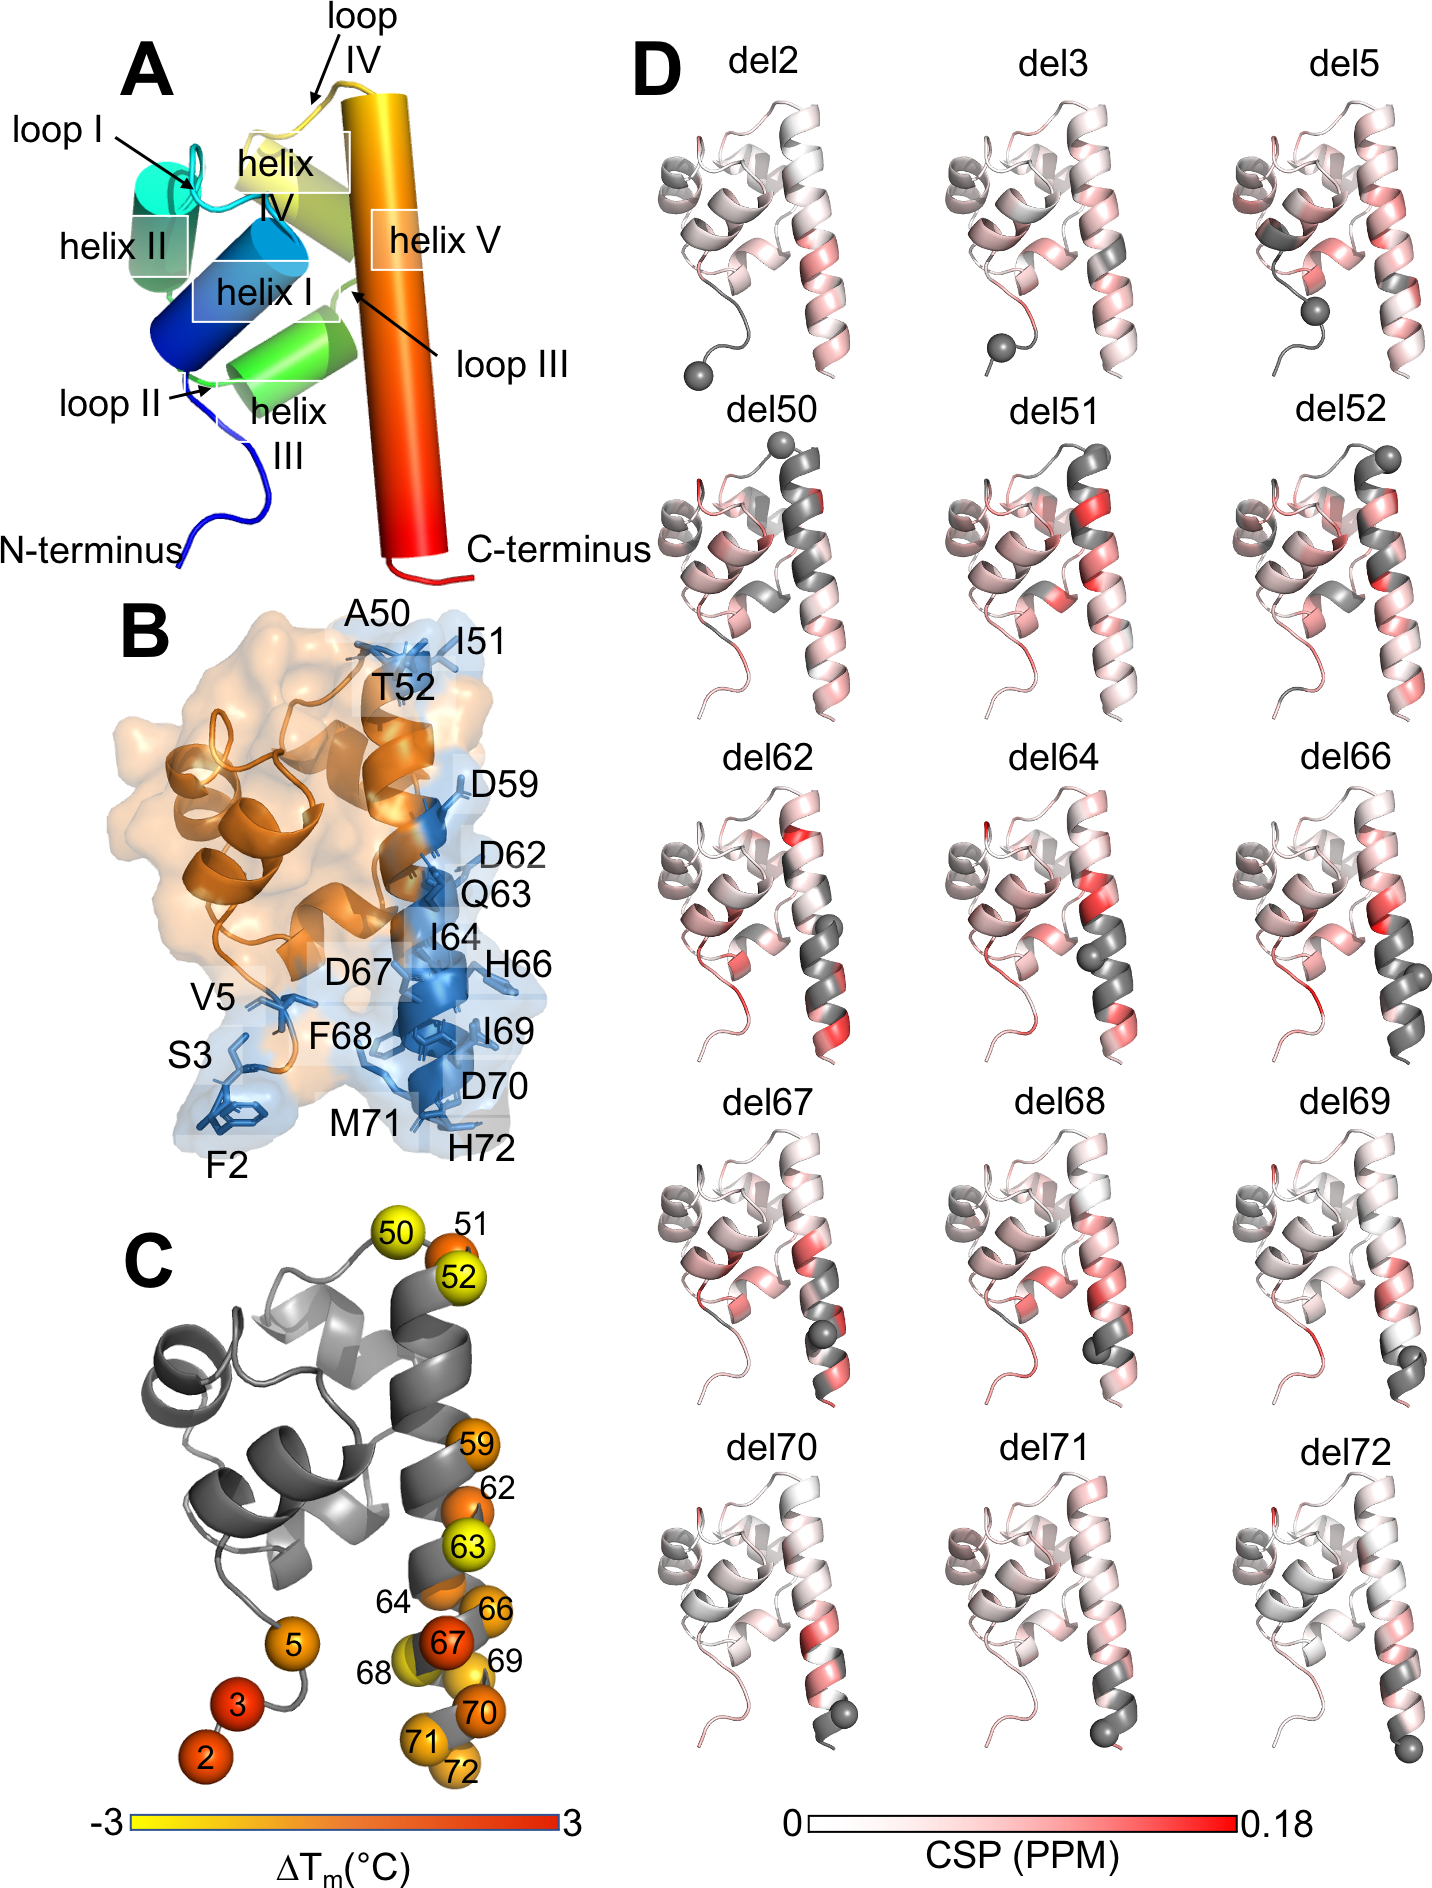
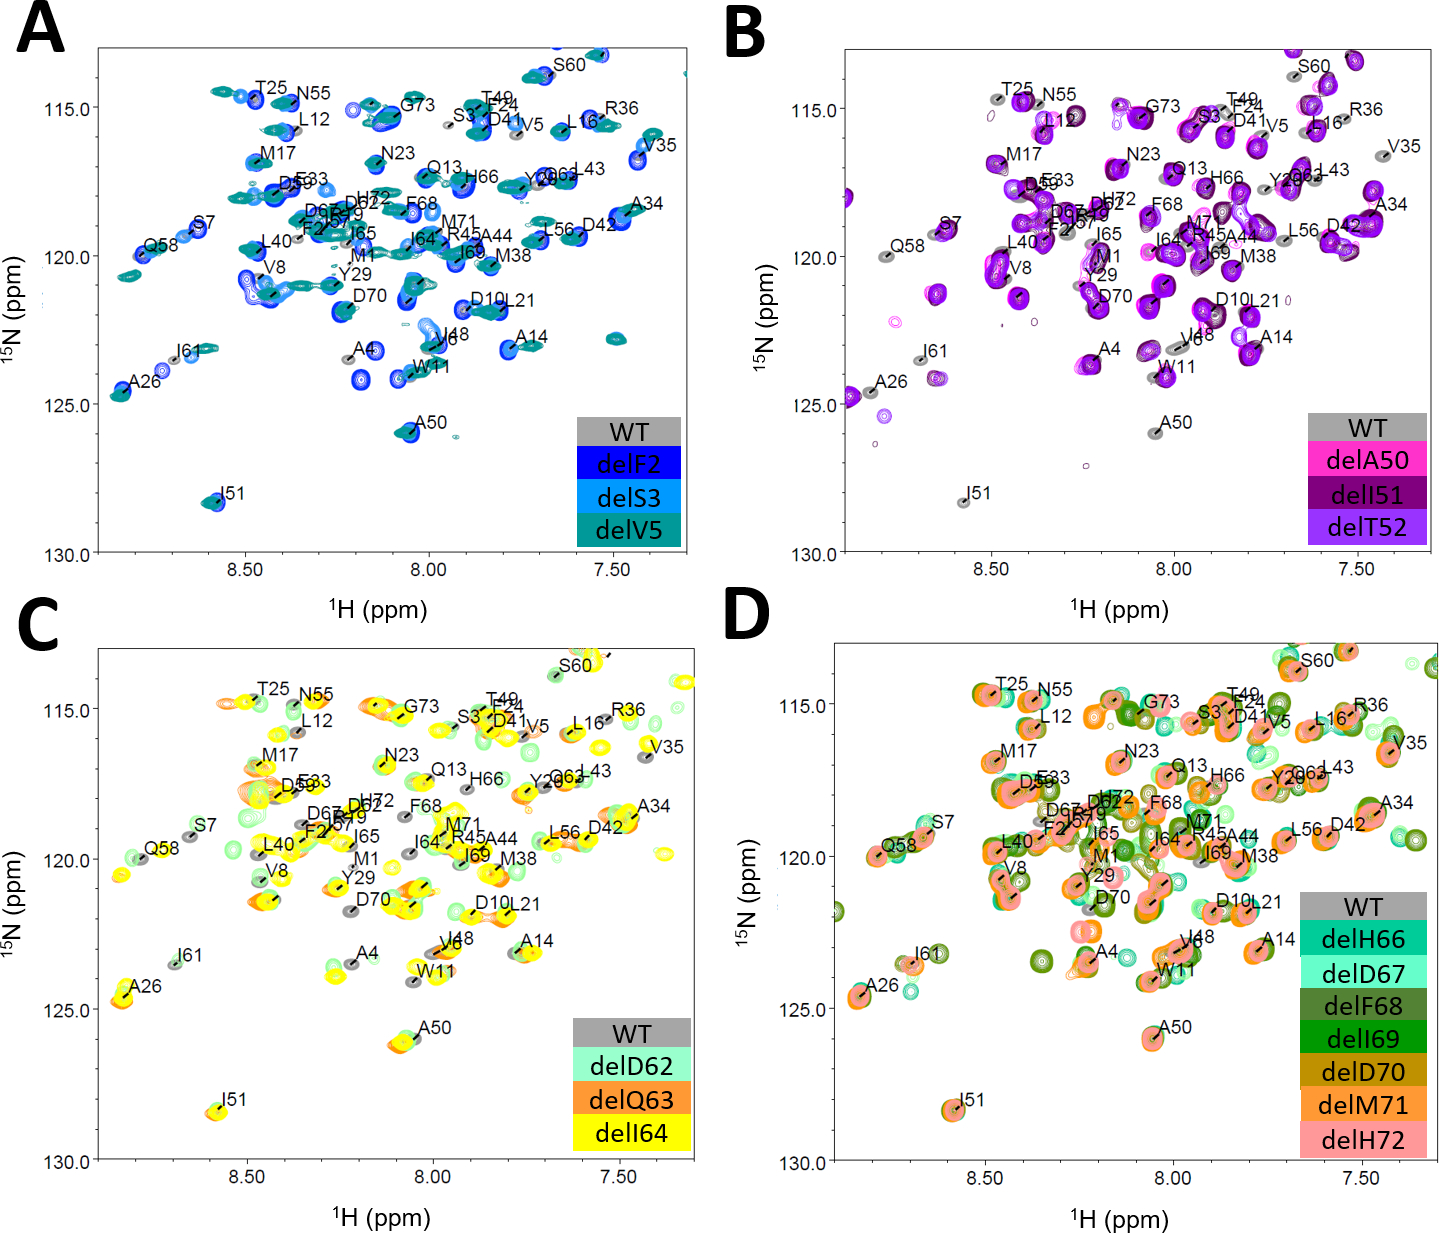
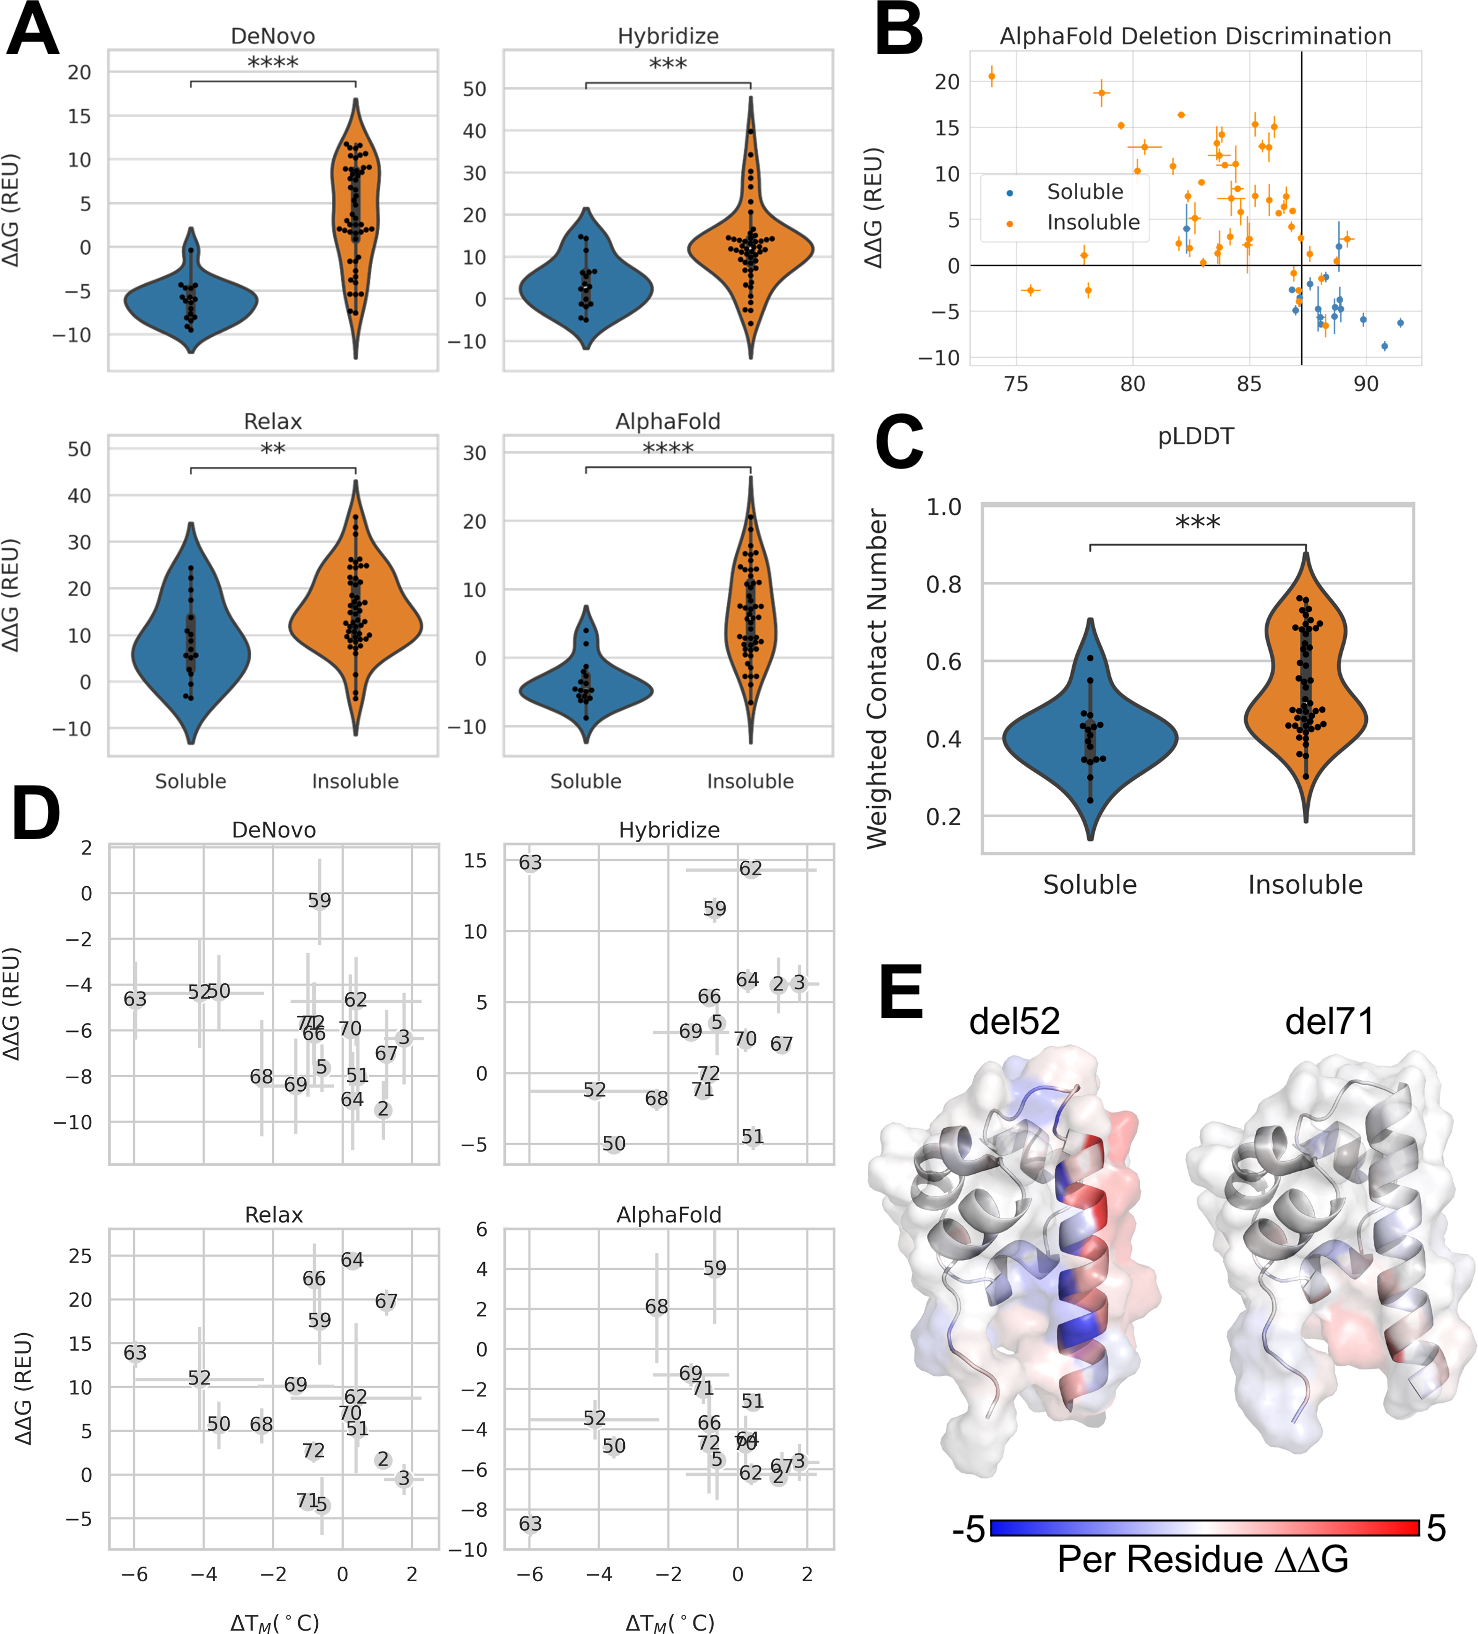
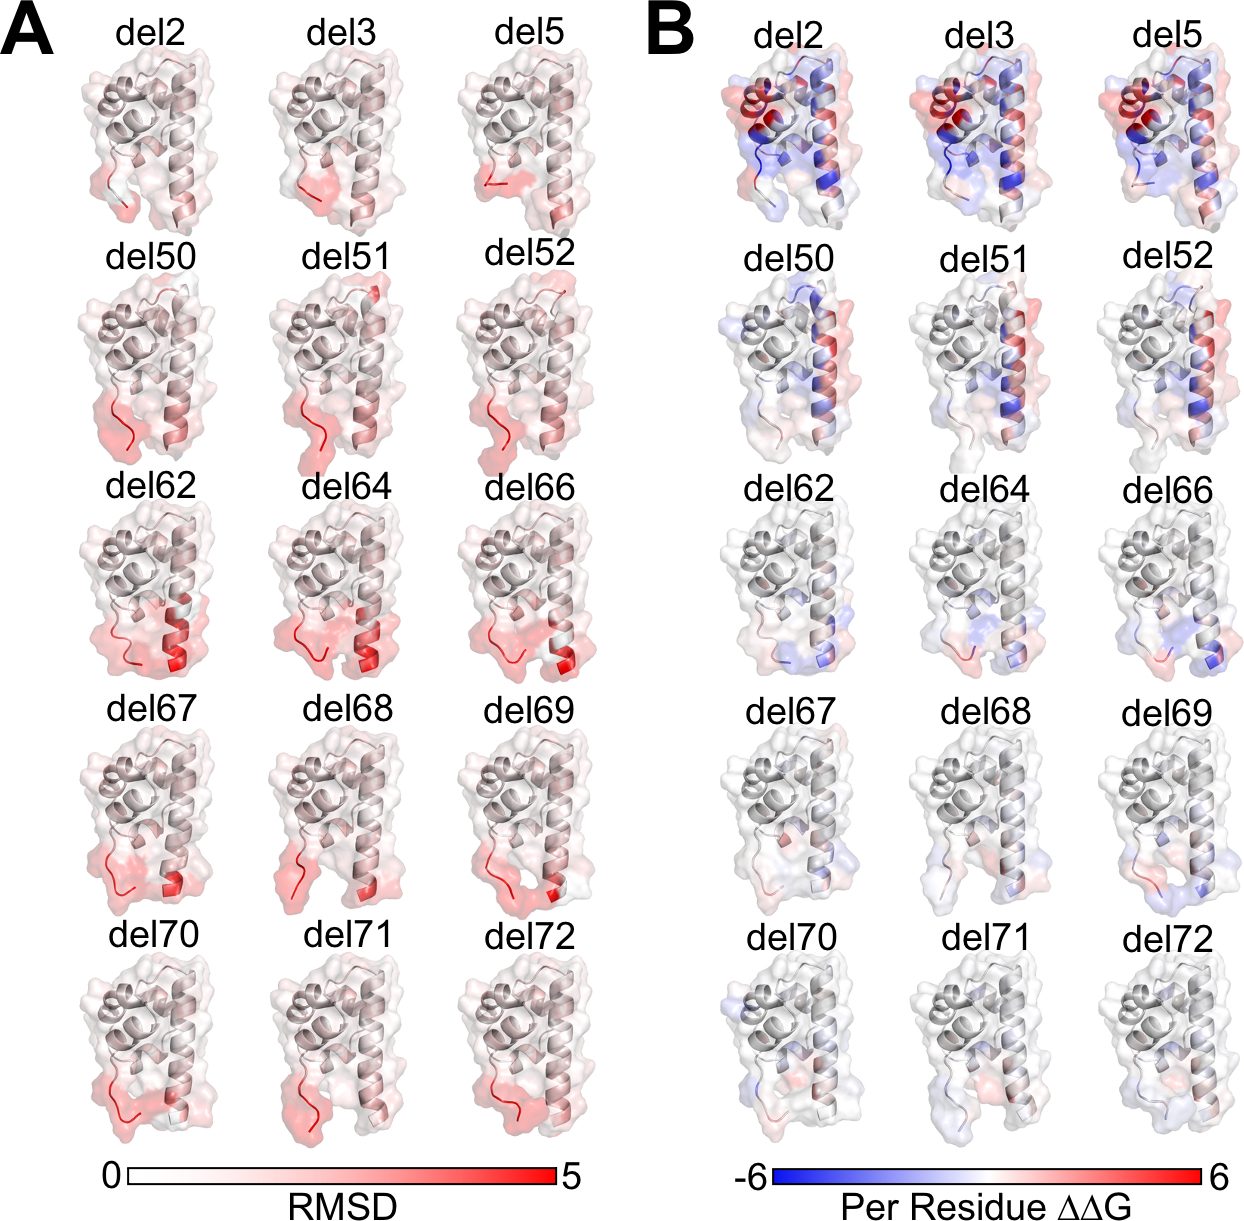
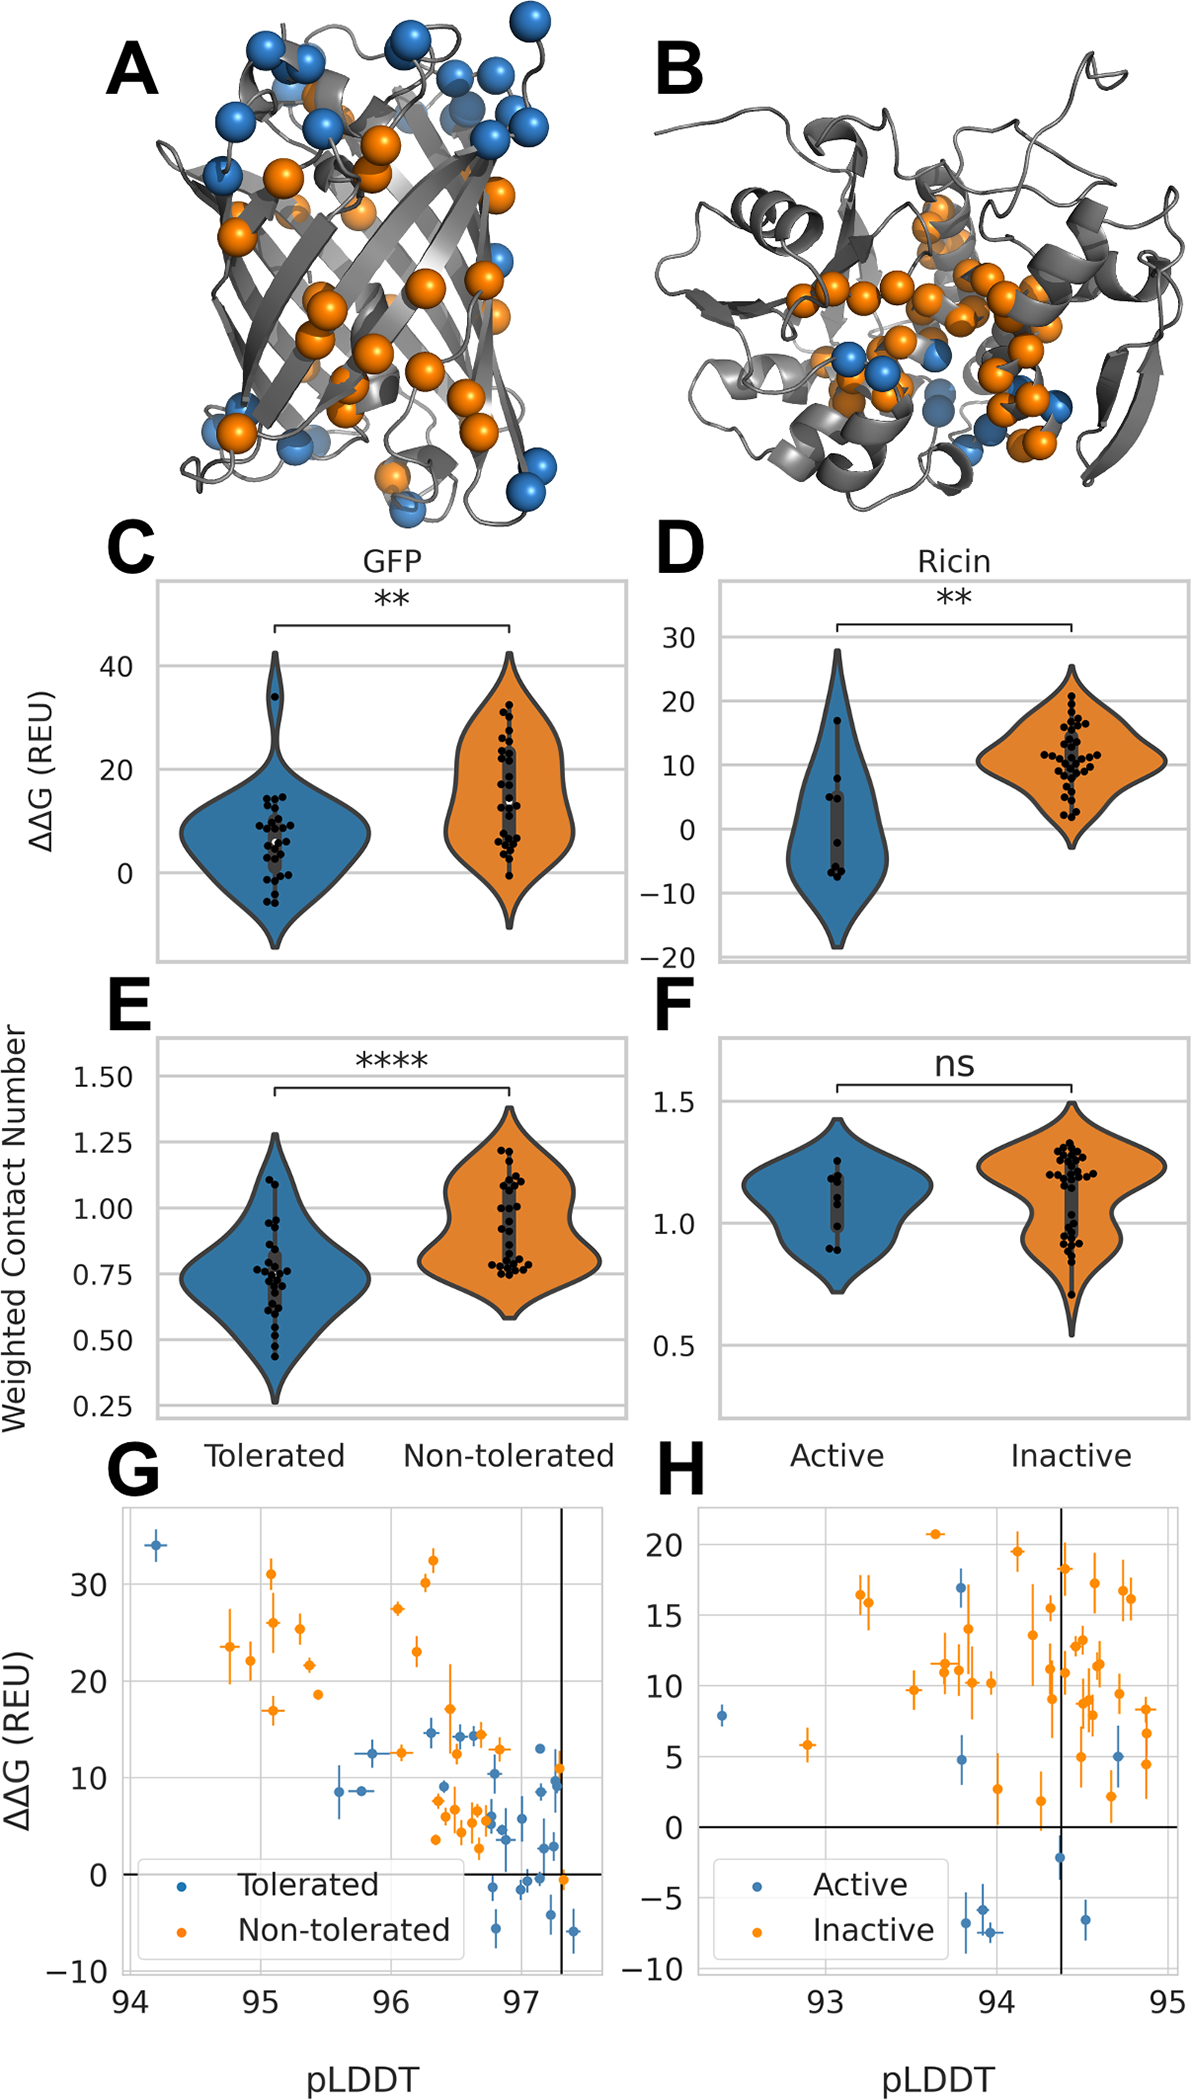
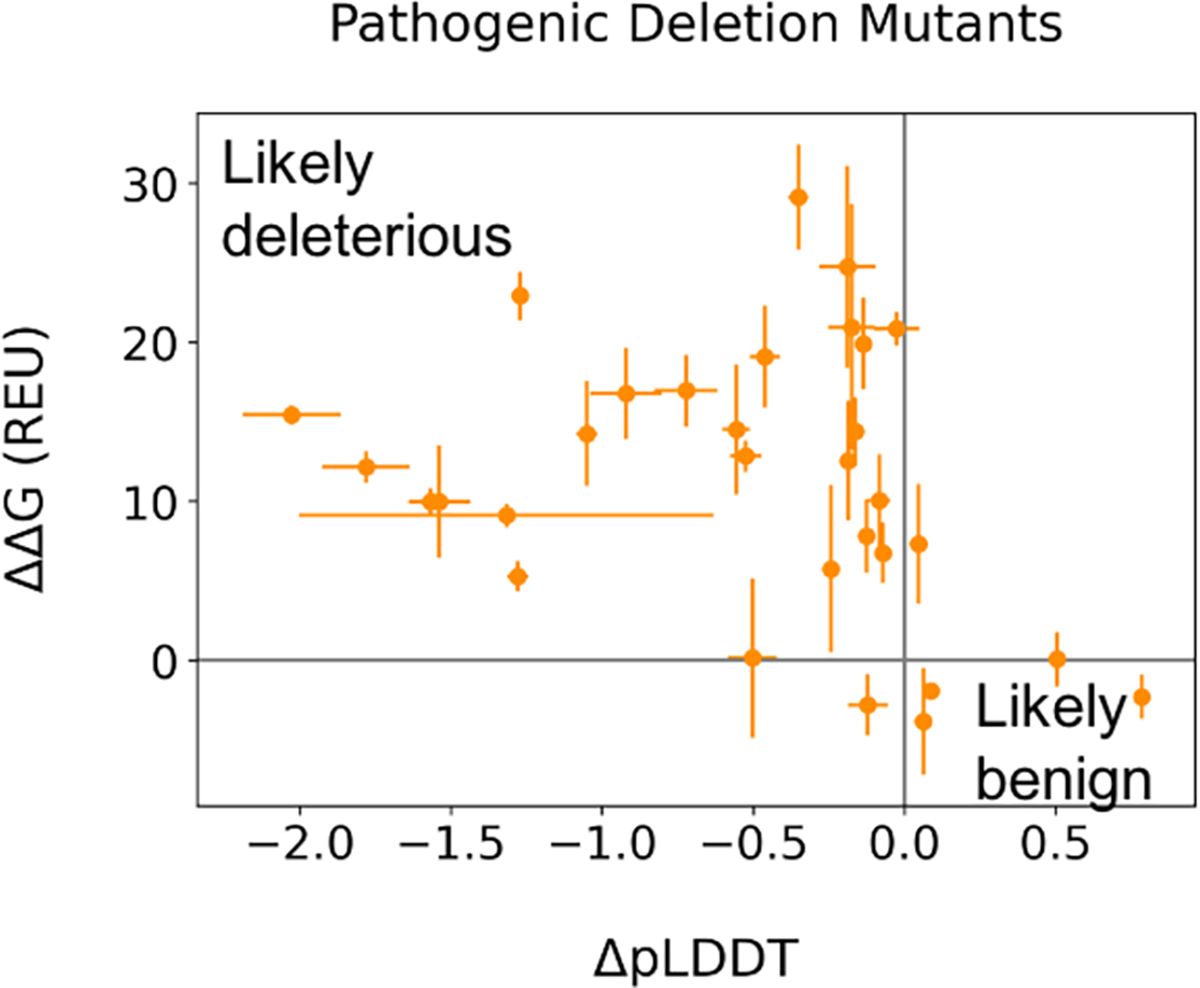
In-frame deletion mutations can result in disease. The impact of these mutations on protein structure and subsequent functional changes remain understudied, partially due to the lack of comprehensive datasets including a structural readout. In addition, the recent breakthrough in structure prediction through deep learning demands an update of computational deletion mutation prediction. In this study, we deleted individually every residue of a small α-helical sterile alpha motif domain and investigated the structural and thermodynamic changes using 2D NMR spectroscopy and differential scanning fluorimetry. Then, we tested computational protocols to model and classify observed deletion mutants. We show a method using AlphaFold2 followed by RosettaRelax performs the best overall. In addition, a metric containing pLDDT values and Rosetta ΔΔG is most reliable in classifying tolerated deletion mutations. We further test this method on other datasets and show they hold for proteins known to harbor disease-causing deletion mutations.

Keywords: AlphaFold; Deletion; Modeling; NMR; Rosetta; SAM domain; indel; mutation; ΔΔG.


Conflict of interest statement

Declaration of interests C.T.S. has received an unrelated research fund from Navigo Proteins GmbH, Halle (Saale), Germany. J.I.A. is currently affiliated with Molecular Pharmacology and Therapeutics Graduate Program, University of Minnesota, Minneapolis, MN 55455, USA. All authors declare no competing interests.

Figures

Figure 1:
Figure 1:. Deletion mutants of a SAM domain.
A. Structural composition of the SAM domain. B. Soluble deletion mapped onto the structure of the SAM domain labeled, shown in blue and insoluble shown in orange. C. Melting temperature difference ΔTM for deletion mutants mapped onto the SAM domain structure (from nanoDSF measurements). D. NMR data (chemical shift perturbation plots); grey indicating regions where no CSP value could be determined because the corresponding peak could not be reliably identified in the spectrum. Gray spheres indicate the deleted residue.
Figure 2:
Figure 2:. 1H-15N-HSQC spectra of the wildtype protein and respective deletion mutants, grouped by observed structural clusters.
A. N-terminal deletion mutants del2, 3, 5, B. Loop IV deletion mutants del50-52, C. Structurally diverse helix V deletion mutants del62-64 and D. C-terminal deletion mutants del66-72.
Figure 3:
Figure 3:. Computational protocols for the prediction of deletion mutants of the investigated SAM domain.
A. Distribution of ΔΔG calculated from four different computational protocols of deletions mutants that were soluble verses insoluble. Blue indicates soluble and orange indicates insoluble mutants. Stars indicate p-values calculated from Mann-Whitney test. DeNovo p-value: 4.91×10⁻⁸, Hybridize p-value: 3.28×10⁻⁴, Relax p-value: 6.12×10⁻³, AlphaFold p-value: 2.27×10⁻⁷. B. Average pLDDT values from AlphaFold2 verses average ΔΔG of AlphaFold2+Rosetta Relax three lowest scoring models for soluble (blue) and insoluble (orange) deletions. Vertical black line indicates wildtype average pLDDT. Horizontal black line drawn at 0 REU. Error bars depict standard error. C. Distribution of weighted contact number for soluble vs insoluble deletion mutants. P-value: 1.22×10⁻⁴. D. Melting temperatures measured with nanoDSF versus ΔΔG calculated from tested computational protocols. Higher melting temperatures indicate higher thermostability; therefore a negative correlation is expected between ΔΔG and ΔTm E. PerResidue ΔΔG scores AlphaFold2+RosettaRelax for deletion 52 and deletion 71 mapped onto the lowest scoring structures from the AlphaFold2 protocol.
Figure 4:
Figure 4:. RMSD and Per Residue Scores on SAM Domain Deletion Structures.
A. Per-Residue RMSD from starting structure of SAM deletion mutants mapped onto structure. B. Per-Residue Rosetta ΔΔG calculated from difference of lowest scoring mutant and lowest scoring wildtype models from AlphaFold2+RosettaRelax protocols. Negative (blue) values indicate mutant has a lower, more stable, score; positive (red) values indicate mutant has a higher, less stable, score.
Figure 5:
Figure 5:. Performance of computational protocols on GFP and Ricin dataset.
A. Tolerated deletion mutations in blue and non-tolerated in orange mapped on GFP structure; B. Deletion mutants with remaining Ricin activity in orange and deletion mutations without activity in blue,; C. Distribution of ΔΔG values from AlphaFold2-RosettaRelax protocol from tolerated and non-tolerated deletion mutants in GFP; stars indicate p-values calculated from Mann-Whitney test with a p-value of 2.12×10³ and D. for Ricin with a p-value of 1.8×10³. E. Distribution of WCN for tolerated and non-tolerated deletion mutations in GFP with a p-value of 6.84×10⁵ and F. in Ricin with a p-value of 0.26. G. ΔΔG values plotted against average pLDDT values from AlphaFold2 for GFP and H. for Ricin. Black lines represent values obtained for GFP and Ricin wildtype respectively. Error bars depict standard error.
Figure 6:
Figure 6:. Modeling known pathogenic deletion mutants.
Average ΔpLDDT values from AlphaFold2 versus ΔΔG from AlphaFold+RosettaRelax for pathogenic deletion mutations listed in Table S4. Gray lines drawn at 0 to indicate how far from the wildtype value each mutant is. Error bars depict standard error.

Comment in

  • Mind the gap.
    Larsen-Ledet S, Stein A. Larsen-Ledet S, et al. Structure. 2023 Jun 1;31(6):641-643. doi: 10.1016/j.str.2023.05.005. Structure. 2023. PMID: 37267922

References

    1. Stenson PD, Mort M, Ball EV, Howells K, Phillips AD, Thomas NST, and Cooper DN (2009). The Human Gene Mutation Database: 2008 update. Genome Medicine 1, 13. 10.1186/gm13. - DOI - PMC - PubMed
    1. Genomes Project C, Abecasis GR, Altshuler D, Auton A, Brooks LD, Durbin RM, Gibbs RA, Hurles ME, and McVean GA (2010). A map of human genome variation from population-scale sequencing. Nature 467, 1061–1073. 10.1038/nature09534. - DOI - PMC - PubMed
    1. Rufenacht UB, Gouya L, Schneider-Yin X, Puy H, Schafer BW, Aquaron R, Nordmann Y, Minder EI, and Deybach JC (1998). Systematic analysis of molecular defects in the ferrochelatase gene from patients with erythropoietic protoporphyria. Am J Hum Genet 62, 1341–1352. 10.1086/301870. - DOI - PMC - PubMed
    1. Peng Q, Zhou R, Liu N, Wang H, Xu H, Zhao M, Yang D, Au KK, Huang H, Liu L, and Chen Z (2022). Naturally occurring spike mutations influence the infectivity and immunogenicity of SARS-CoV-2. Cell Mol Immunol, 1–9. 10.1038/s41423-022-00924-8. - DOI - PMC - PubMed
    1. Scovino AM, Dahab EC, Vieira GF, Freire-de-Lima L, Freire-de-Lima CG, and Morrot A (2022). SARS-CoV-2’s Variants of Concern: A Brief Characterization. Front Immunol 13, 834098. 10.3389/fimmu.2022.834098. - DOI - PMC - PubMed

Publication types

LinkOut - more resources