

Changes in COVID-19-related mortality across key demographic and clinical subgroups in England from 2020 to 2022: a retrospective cohort study using the OpenSAFELY platform
- PMID: 37120260
- PMCID: PMC10139026
- DOI: 10.1016/S2468-2667(23)00079-8
Changes in COVID-19-related mortality across key demographic and clinical subgroups in England from 2020 to 2022: a retrospective cohort study using the OpenSAFELY platform
Abstract
Background: COVID-19 has been shown to differently affect various demographic and clinical population subgroups. We aimed to describe trends in absolute and relative COVID-19-related mortality risks across clinical and demographic population subgroups during successive SARS-CoV-2 pandemic waves.
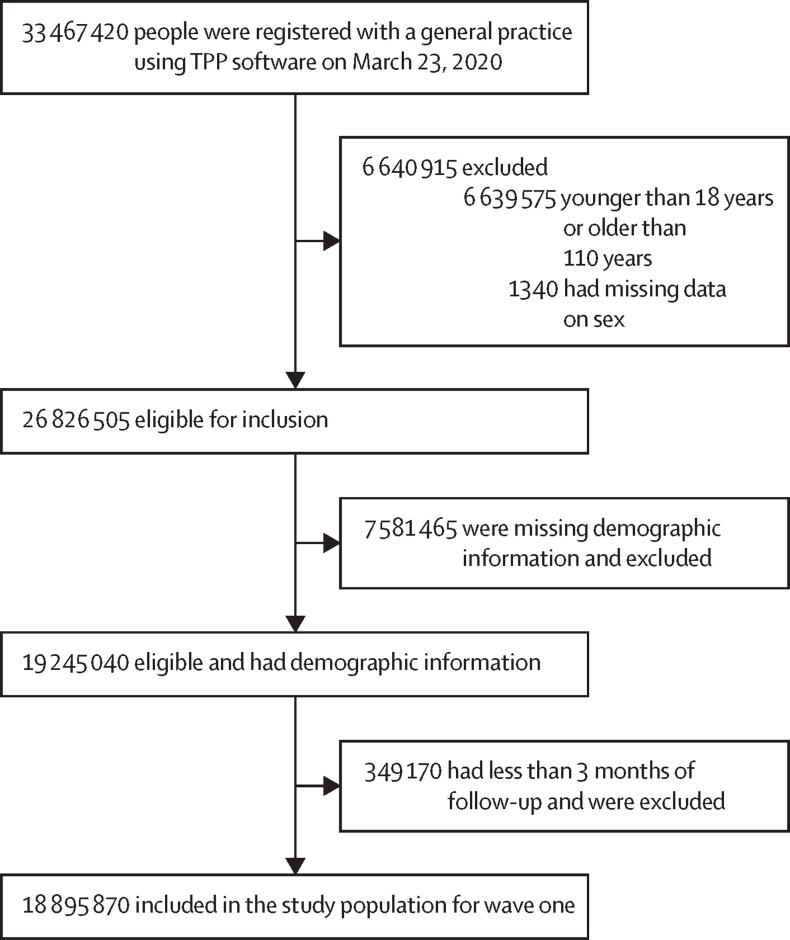
Methods: We did a retrospective cohort study in England using the OpenSAFELY platform with the approval of National Health Service England, covering the first five SARS-CoV-2 pandemic waves (wave one [wild-type] from March 23 to May 30, 2020; wave two [alpha (B.1.1.7)] from Sept 7, 2020, to April 24, 2021; wave three [delta (B.1.617.2)] from May 28 to Dec 14, 2021; wave four [omicron (B.1.1.529)] from Dec 15, 2021, to April 29, 2022; and wave five [omicron] from June 24 to Aug 3, 2022). In each wave, we included people aged 18-110 years who were registered with a general practice on the first day of the wave and who had at least 3 months of continuous general practice registration up to this date. We estimated crude and sex-standardised and age-standardised wave-specific COVID-19-related death rates and relative risks of COVID-19-related death in population subgroups.
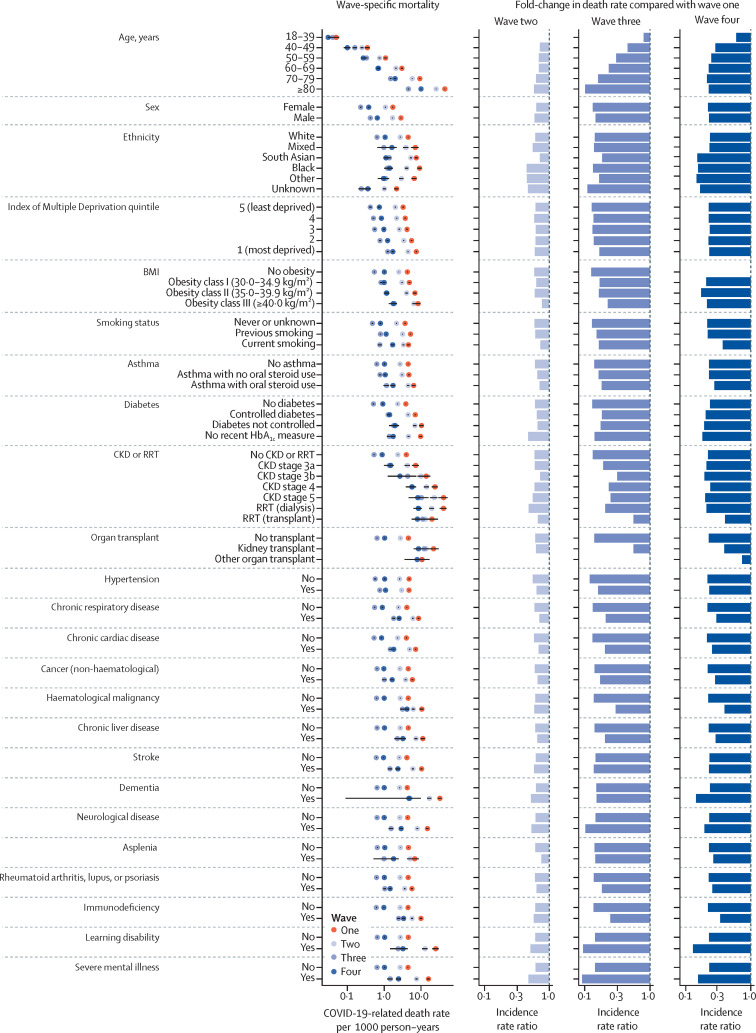
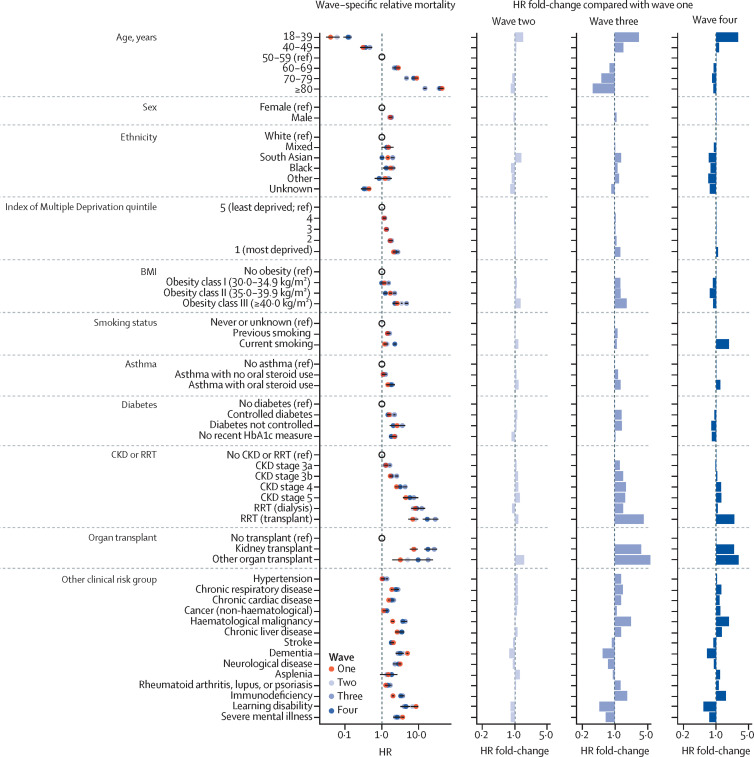
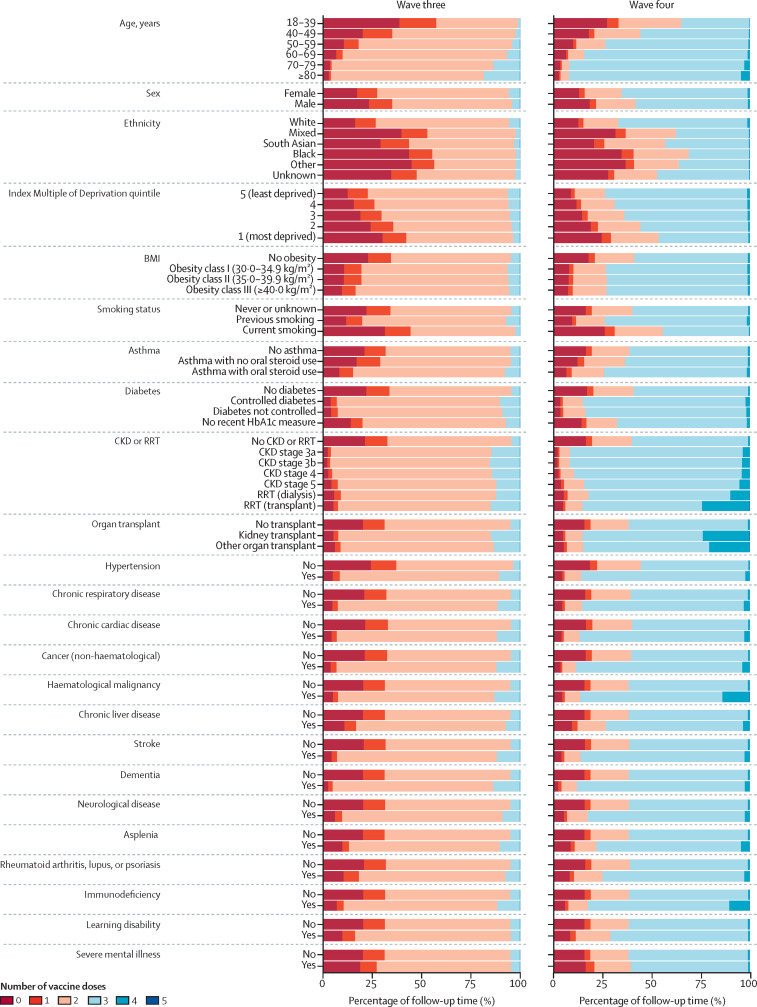
Findings: 18 895 870 adults were included in wave one, 19 014 720 in wave two, 18 932 050 in wave three, 19 097 970 in wave four, and 19 226 475 in wave five. Crude COVID-19-related death rates per 1000 person-years decreased from 4·48 deaths (95% CI 4·41-4·55) in wave one to 2·69 (2·66-2·72) in wave two, 0·64 (0·63-0·66) in wave three, 1·01 (0·99-1·03) in wave four, and 0·67 (0·64-0·71) in wave five. In wave one, the standardised COVID-19-related death rates were highest in people aged 80 years or older, people with chronic kidney disease stage 5 or 4, people receiving dialysis, people with dementia or learning disability, and people who had received a kidney transplant (ranging from 19·85 deaths per 1000 person-years to 44·41 deaths per 1000 person-years, compared with from 0·05 deaths per 1000 person-years to 15·93 deaths per 1000 person-years in other subgroups). In wave two compared with wave one, in a largely unvaccinated population, the decrease in COVID-19-related mortality was evenly distributed across population subgroups. In wave three compared with wave one, larger decreases in COVID-19-related death rates were seen in groups prioritised for primary SARS-CoV-2 vaccination, including people aged 80 years or older and people with neurological disease, learning disability, or severe mental illness (90-91% decrease). Conversely, smaller decreases in COVID-19-related death rates were observed in younger age groups, people who had received organ transplants, and people with chronic kidney disease, haematological malignancies, or immunosuppressive conditions (0-25% decrease). In wave four compared with wave one, the decrease in COVID-19-related death rates was smaller in groups with lower vaccination coverage (including younger age groups) and conditions associated with impaired vaccine response, including people who had received organ transplants and people with immunosuppressive conditions (26-61% decrease).
Interpretation: There was a substantial decrease in absolute COVID-19-related death rates over time in the overall population, but demographic and clinical relative risk profiles persisted and worsened for people with lower vaccination coverage or impaired immune response. Our findings provide an evidence base to inform UK public health policy for protecting these vulnerable population subgroups.
Funding: UK Research and Innovation, Wellcome Trust, UK Medical Research Council, National Institute for Health and Care Research, and Health Data Research UK.
Copyright © 2023 The Author(s). Published by Elsevier Ltd. This is an Open Access article under the CC BY 4.0 license. Published by Elsevier Ltd.. All rights reserved.
Conflict of interest statement
Declaration of interests BG has received personal income from speaking and writing for lay audiences on the misuse of science and has been a non-executive director of NHS Digital. EJW has received payment for providing training for AstraZeneca (unrelated to the submitted work). All other authors declare no competing interests.
Figures
Comment in
-
Reduction in COVID-19-related mortality over time but disparities across population subgroups.Lancet Public Health. 2023 May;8(5):e327-e328. doi: 10.1016/S2468-2667(23)00078-6. Lancet Public Health. 2023. PMID: 37120257 Free PMC article. No abstract available.
References
-
- Raleigh V. The King's Fund; 2022. Deaths from Covid-19 (coronavirus)https://www.kingsfund.org.uk/publications/deaths-covid-19
-
- Public Health England CHIME—COVID-19 health inequalities. https://analytics.phe.gov.uk/apps/chime/
Publication types
MeSH terms
Substances
Supplementary concepts
Grants and funding
LinkOut - more resources
Full Text Sources
Medical
Research Materials
Miscellaneous
