

Serum triglyceride glucose index is a valuable predictor for visceral obesity in patients with type 2 diabetes: a cross-sectional study
- PMID: 37120516
- PMCID: PMC10148999
- DOI: 10.1186/s12933-023-01834-3
Serum triglyceride glucose index is a valuable predictor for visceral obesity in patients with type 2 diabetes: a cross-sectional study
Abstract
Background: Since the triglyceride glucose (TyG) index can reflect insulin resistance, it has been proven to be an efficient predictor of glycolipid-metabolism-related diseases. Therefore, this study aimed to investigate the predictive value of the TyG index for visceral obesity (VO) and body fat distribution in patients with type 2 diabetes mellitus (T2DM).
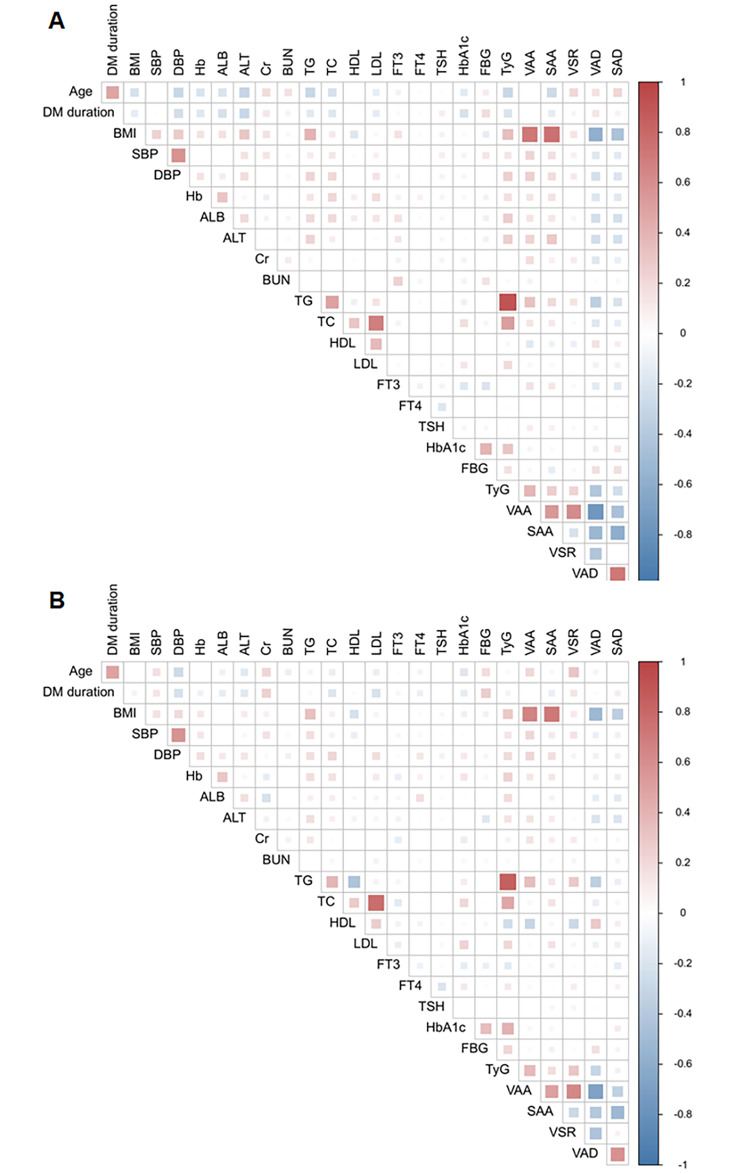
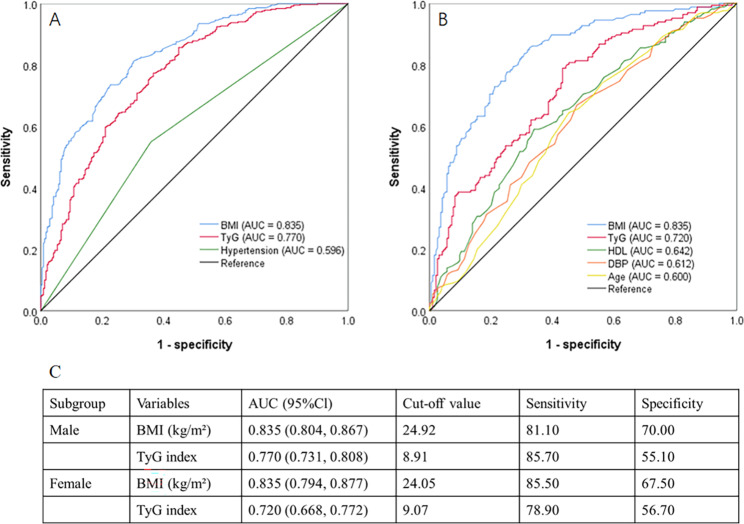
Methods: Abdominal adipose tissue characteristics in patients with T2DM, including visceral adipose area (VAA), subcutaneous adipose area (SAA), VAA-to-SAA ratio (VSR), visceral adipose density (VAD), and subcutaneous adipose density (SAD), were obtained through analyses of computed tomography images at the lumbar 2/3 level. VO was diagnosed according to the VAA (> 142 cm2 for males and > 115 cm2 for females). Logistic regression was performed to identify independent factors of VO, and receiver operating characteristic (ROC) curves were used to compare the diagnostic performance according to the area under the ROC curve (AUC).
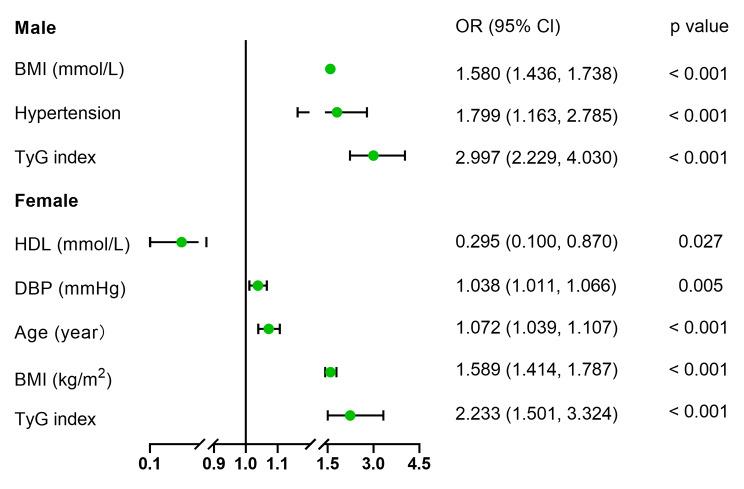
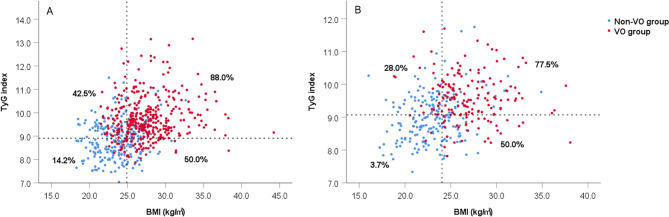
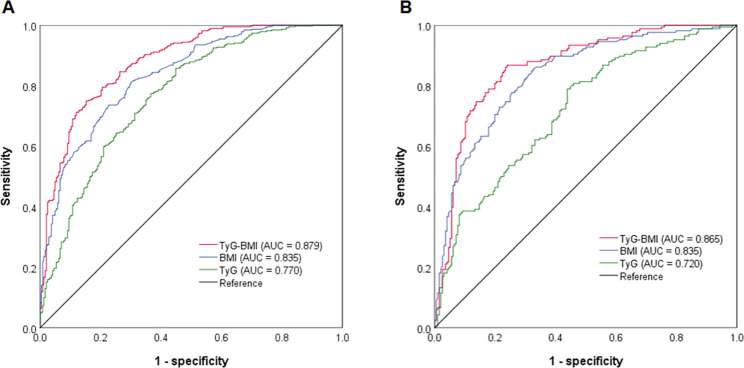
Results: A total of 976 patients were included in this study. VO patients showed significantly higher TyG values than non-VO patients in males (9.74 vs. 8.88) and females (9.59 vs. 9.01). The TyG index showed significant positive correlations with VAA, SAA, and VSR and negative correlations with VAD and SAD. The TyG index was an independent factor for VO in both males (odds ratio [OR] = 2.997) and females (OR = 2.233). The TyG index ranked second to body mass index (BMI) for predicting VO in male (AUC = 0.770) and female patients (AUC = 0.720). Patients with higher BMI and TyG index values showed a significantly higher risk of VO than the other patients. TyG-BMI, the combination index of TyG and BMI, showed significantly higher predictive power than BMI for VO in male patients (AUC = 0.879 and 0.835, respectively) but showed no significance when compared with BMI in female patients (AUC = 0.865 and 0.835, respectively).
Conclusions: . TyG is a comprehensive indicator of adipose volume, density, and distribution in patients with T2DM and is a valuable predictor for VO in combination with anthropometric indices, such as BMI.
Keywords: Triglyceride glucose index; Type 2 diabetes mellitus; Visceral obesity.
© 2023. The Author(s).
Conflict of interest statement
The authors report no conflicts of interest.
Figures

References
-
- Magliano DJ, Boyko EJ. committee IDFDAtes: IDF Diabetes Atlas. In: Idf diabetes atlas Brussels: International Diabetes Federation © International Diabetes Federation, 2021.; 2021.
Publication types
MeSH terms
Substances
LinkOut - more resources
Full Text Sources
Medical
