. 2023 Apr 30;24(1):100.
doi: 10.1186/s13059-023-02919-8.

Inversion polymorphism in a complete human genome assembly

Affiliations

Inversion polymorphism in a complete human genome assembly

David Porubsky et al. Genome Biol. .

Abstract

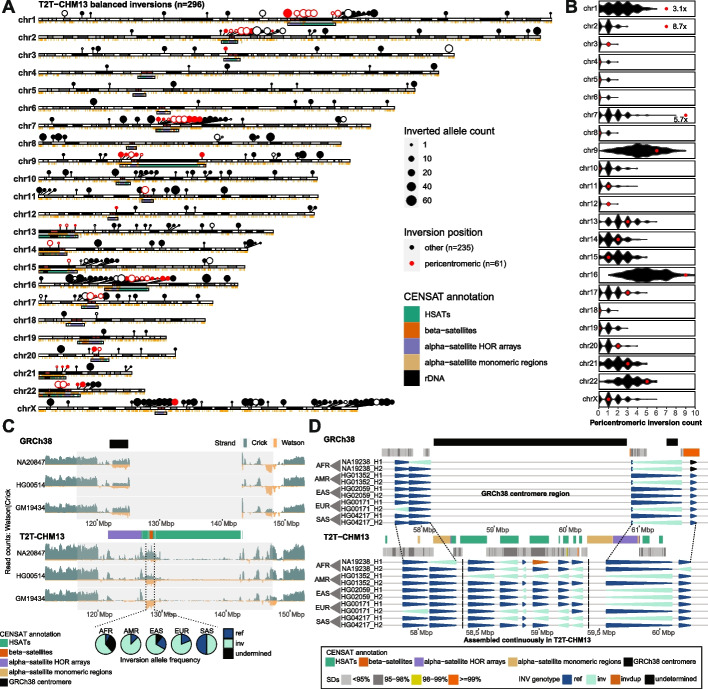
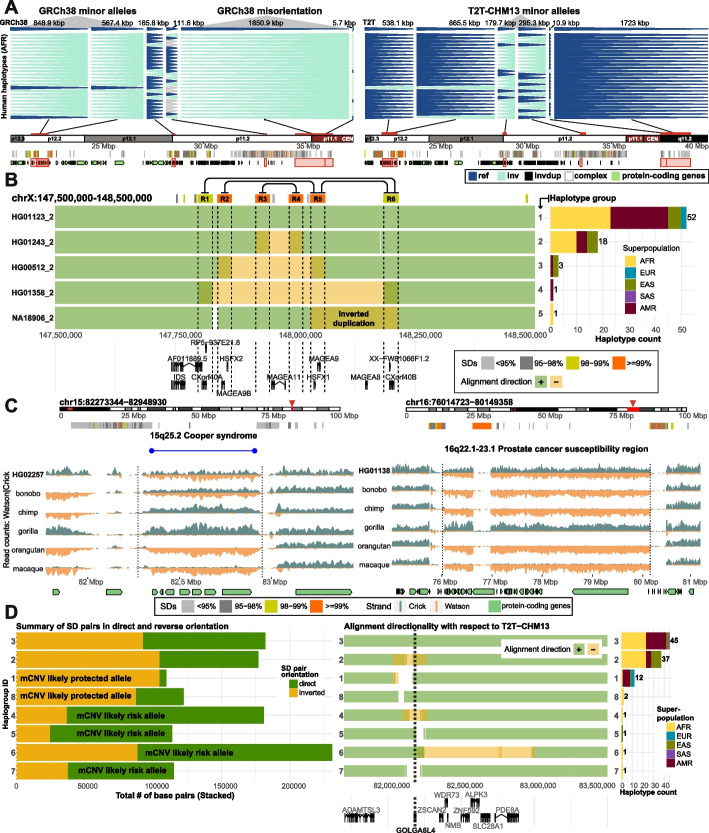
The telomere-to-telomere (T2T) complete human reference has significantly improved our ability to characterize genome structural variation. To understand its impact on inversion polymorphisms, we remapped data from 41 genomes against the T2T reference genome and compared it to the GRCh38 reference. We find a ~ 21% increase in sensitivity improving mapping of 63 inversions on the T2T reference. We identify 26 misorientations within GRCh38 and show that the T2T reference is three times more likely to represent the correct orientation of the major human allele. Analysis of 10 additional samples reveals novel rare inversions at chromosomes 15q25.2, 16p11.2, 16q22.1-23.1, and 22q11.21.

Keywords: Genomic structural variation; Inversion; Pathogenic copy number variant; Pericentromeric; T2T-CHM13.


Conflict of interest statement

E.E.E. is a scientific advisory board (SAB) member of Variant Bio, Inc. The following authors have previously disclosed a patent application (no. EP19169090) relevant to Strand-seq: J.O.K., T.M., and D.P. The other authors declare no competing interests.

Figures

Fig. 1
Fig. 1
Inversion polymorphisms with respect to a complete T2T reference show pericentromeric bias. A An ideogram showing the position and inverted allele frequency (dot size) of all balanced inversions from 41 human samples mapped to T2T-CHM13 reference (n = 296). Inversions that fall within pericentromeric regions (CENSAT annotation, ± 1 Mbp) are shown as red dots (n = 61) while other inversions are shown as black dots (n = 235). Inversions with ≥ 90% reciprocal overlap with nonsyntenic regions between GRCh38 and T2T-CHM13 or that failed to map to the GRCh38 reference are highlighted as open circles (n = 63). B Permutation analysis shows pericentromeric enrichment for specific chromosomes. Permuted counts of pericentromeric inversions are shown as black violin plots as compared to observed counts (red dots). C The read-coverage profiles of Strand-seq data over a chromosome 1 centromeric region summarized as binned (bin size: 50 kbp step size: 10 kbp) read counts represented as bars above (teal; Crick read counts) and below (orange; Watson read counts) the midline with respect to centromere repeat annotation. Dotted lines highlight the novel centromeric inversion detected on chromosome 1 only with respect to T2T-CHM13. Note: equal coverage of Watson and Crick counts represent a heterozygous inversion (one homologue inverted) while reads aligned only in the Watson orientation signify a homozygous inversion (both homologs inverted). Pie charts show frequency of inverted (bright blue) and directly oriented (light blue) alleles across all haplotypes (n = 82) from all unrelated individuals (n = 41) for a given centromeric inversion (dotted lines). D A “backgammon” plot showing the inversion status of each defined region reported as colored arrowheads (dark blue—direct, bright blue—inverted, see the legend) for chromosome 7 region with respect to GRCh38 (chr7:57456486–61949954; top) and T2T-CHM13 (chr7:57700000–60400000; bottom). HSATs human satellites, HOR higher-order repeat
Fig. 2
Fig. 2
Improved representation of inversion polymorphisms in T2T-CHM13 and interpretation of TADs. A A “backgammon” plot for a 20 Mbp region at chromosome 16p depicting changes in the representation of major alleles as inverted (light blue) and direct (dark blue) orientation based on phased inversion genotypes reported with respect to GRCh38 and T2T-CHM13 reference genomes. Each horizontal set of arrowheads represents a single haplotype of African (AFR) ancestry. In most cases, GRCh38 was either erroneous or represented the minor allele. (See Additional file 1: Fig. S13 for all 82 haplotypes.) B Overlapping inversions on chromosome Xq28. Each row represents a unique human haplotype (haplotypes 1–5) of the Xq28 region visualized as a single human assembly aligned to T2T-CHM13 in forward ('+', green) or reverse ('-', orange) orientation. These aligned segments are displayed with respect to flanking segmental duplications (SDs) (R1-6) that likely mediate the inversions (connecting lines) and underlying protein-coding genes. We use transparency to convey positions of overlapping alignments, such as highlighted inverted duplication in haplotype 5. Barplot (right) shows the total counts of human haplotypes per haplotype group stratified by superpopulation. C Two disease-associated regions mapping to chromosomes 15q25.2 and 16q22.1–23.1 are depicted within chromosome-specific ideograms (red rectangle) with a zoom into the region flanked by SDs (colored horizontal bars) and pathogenic duplication and deletion breakpoints highlighted in blue and red horizontal lines, respectively. Strand-seq data highlight rare heterozygous inversions (see Fig. 1C for detailed description) discovered in a human sample with respect to the status in different nonhuman primate species. Homozygous inversions are orange while homozygous teal represents homozygous direct orientations. D Left plot summarizes the total number of base pairs for SD pairs in direct (dark green) and inverted (dark orange) orientatation for each haplogroup (in rows) marked as likely protected or at risk for morbid copy number variant (mCNV) formation. Middle plot shows unique human haplotypes (haplotypes 1–8) of the 15q25.2 region visualized as a single human assembly aligned to T2T-CHM13 in forward ('+', green) or reverse ('-', orange) orientation. Underlying protein-coding genes from this region are shown below. Barplot (right) shows the total counts of human haplotypes per haplotype group stratified by superpopulation

References

    1. Nurk S, Koren S, Rhie A, Rautiainen M, Bzikadze AV, Mikheenko A, et al. The complete sequence of a human genome. Science. 2022;376:44–53. doi: 10.1126/science.abj6987. - DOI - PMC - PubMed
    1. Aganezov S, Yan SM, Soto DC, Kirsche M, Zarate S, Avdeyev P, et al. A complete reference genome improves analysis of human genetic variation. Science. 2022;376:eabl3533. doi: 10.1126/science.abl3533. - DOI - PMC - PubMed
    1. Vollger MR, Guitart X, Dishuck PC, Mercuri L, Harvey WT, Gershman A, et al. Segmental duplications and their variation in a complete human genome. Science. 2022;376:eabj6965. doi: 10.1126/science.abj6965. - DOI - PMC - PubMed
    1. Jarvis ED, Formenti G, Rhie A, Guarracino A, Yang C, Wood J, et al. Semi-automated assembly of high-quality diploid human reference genomes. Nature. 2022;611:519–531. doi: 10.1038/s41586-022-05325-5. - DOI - PMC - PubMed
    1. Kidd JM, Cooper GM, Donahue WF, Hayden HS, Sampas N, Graves T, et al. Mapping and sequencing of structural variation from eight human genomes. Nature. 2008;453:56–64. doi: 10.1038/nature06862. - DOI - PMC - PubMed

Publication types

LinkOut - more resources