. 2023;83(4):319.
doi: 10.1140/epjc/s10052-023-11354-9. Epub 2023 Apr 24.

Liquid argon light collection and veto modeling in GERDA Phase II

M Agostini  1 A Alexander  1 G R Araujo  2 A M Bakalyarov  3 M Balata  4 I Barabanov  5 L Baudis  2 C Bauer  6 S Belogurov  5   7   8 A Bettini  9   10 L Bezrukov  5 V Biancacci  9   10 E Bossio  11 V Bothe  6 R Brugnera  9   10 A Caldwell  12 S Calgaro  9   10 C Cattadori  13 A Chernogorov  7   3 P-J Chiu  2 T Comellato  11 V D'Andrea  14 E V Demidova  7 A Di Giacinto  4 N Di Marco  15 E Doroshkevich  5 F Fischer  12 M Fomina  16 A Gangapshev  6   5 A Garfagnini  9   10 C Gooch  12 P Grabmayr  17 V Gurentsov  5 K Gusev  16   3   11 J Hakenmüller  6   18 S Hemmer  10 W Hofmann  6 M Hult  19 L V Inzhechik  5   20 J Janicskó Csáthy  11   21 J Jochum  17 M Junker  4 V Kazalov  5 Y Kermaïdic  6   22 H Khushbakht  17 T Kihm  6 K Kilgus  17 I V Kirpichnikov  7 A Klimenko  16   6   20 K T Knöpfle  6   23 O Kochetov  16 V N Kornoukhov  5   7 P Krause  11 V V Kuzminov  5 M Laubenstein  4 B Lehnert  24   25 M Lindner  6 I Lippi  10 A Lubashevskiy  16 B Lubsandorzhiev  5 G Lutter  19 C Macolino  14 B Majorovits  12 W Maneschg  6 L Manzanillas  12 G Marshall  1 M Miloradovic  2 R Mingazheva  2 M Misiaszek  26 M Morella  15 Y Müller  2 I Nemchenok  16   22 M Neuberger  11 L Pandola  27 K Pelczar  19 L Pertoldi  11   10 P Piseri  28 A Pullia  28 L Rauscher  17 M Redchuk  10 S Riboldi  28 N Rumyantseva  16   3 C Sada  9   10 S Sailer  6 F Salamida  14 S Schönert  11 J Schreiner  6 M Schütt  6 A-K Schütz  17 O Schulz  12 M Schwarz  11 B Schwingenheuer  6 O Selivanenko  5 E Shevchik  16 M Shirchenko  16 L Shtembari  12 H Simgen  6 A Smolnikov  16   6 D Stukov  3 S Sullivan  6 A A Vasenko  7 A Veresnikova  5 C Vignoli  4 K von Sturm  9   10 A Wegmann  6 T Wester  24 C Wiesinger  11 M Wojcik  26 E Yanovich  5 B Zatschler  24 I Zhitnikov  16 S V Zhukov  3 D Zinatulina  16 A Zschocke  17 A J Zsigmond  12 K Zuber  24 G Zuzel  26 Gerda collaboration
Affiliations

Liquid argon light collection and veto modeling in GERDA Phase II

M Agostini et al. Eur Phys J C Part Fields. 2023.

Abstract

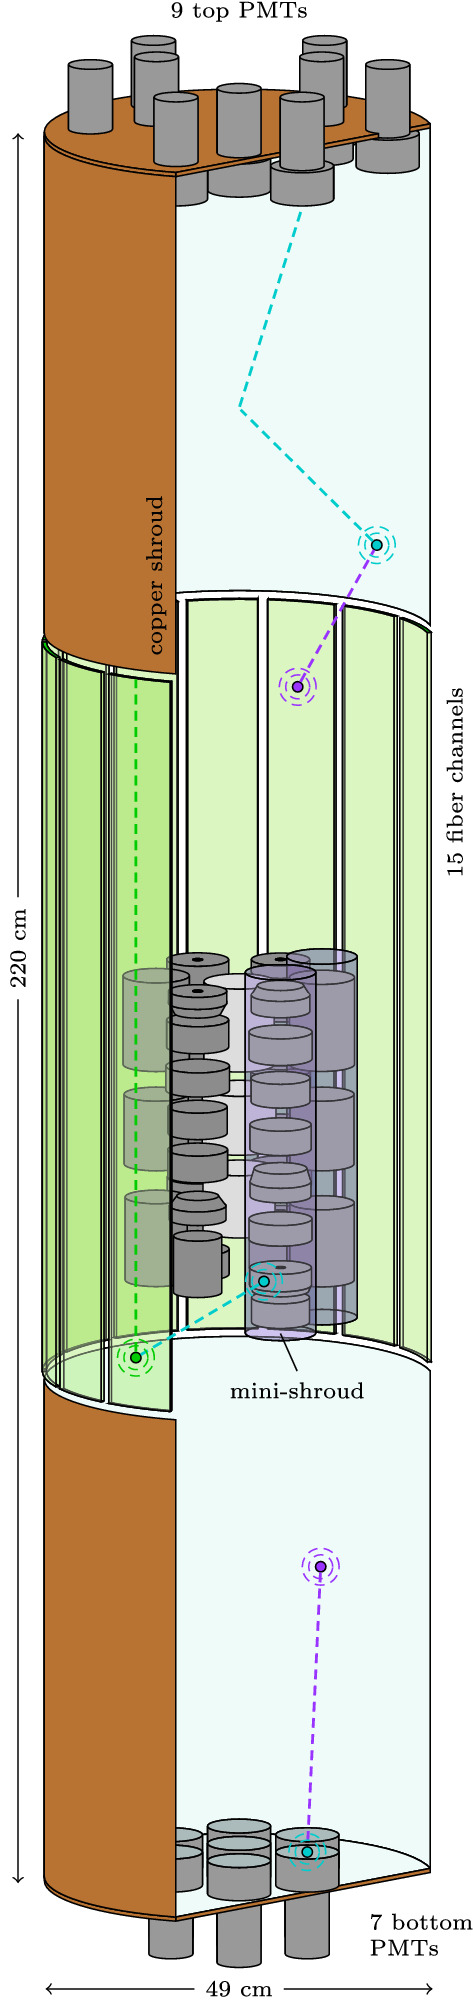
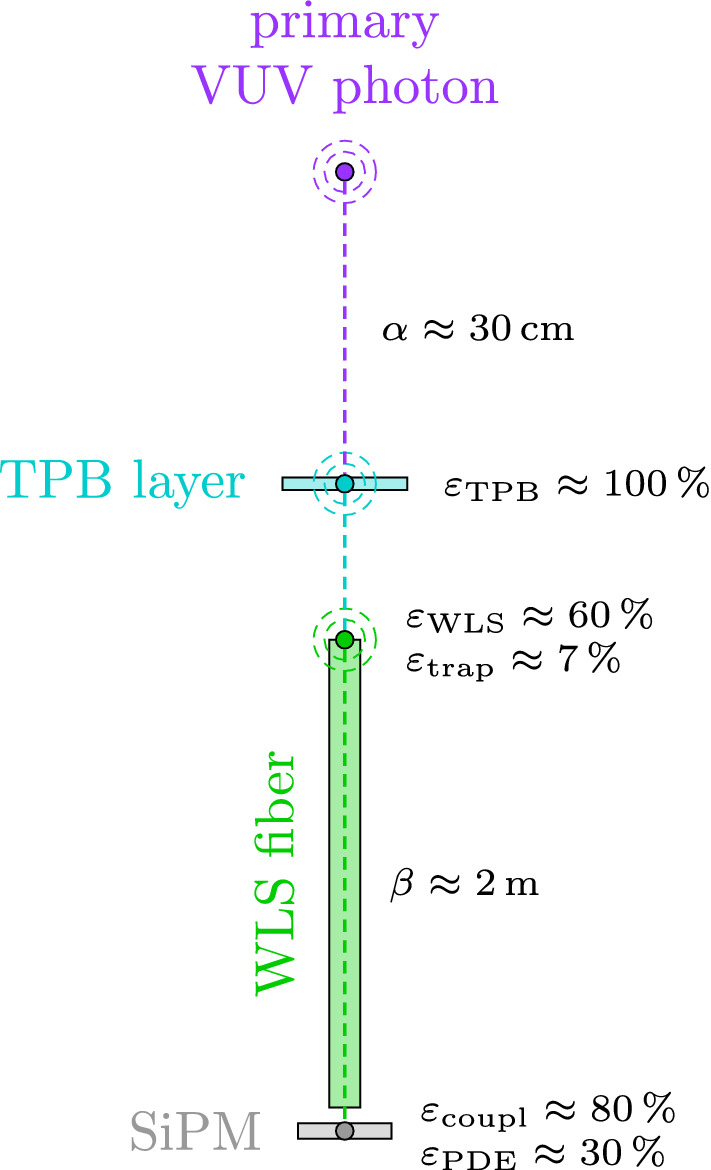
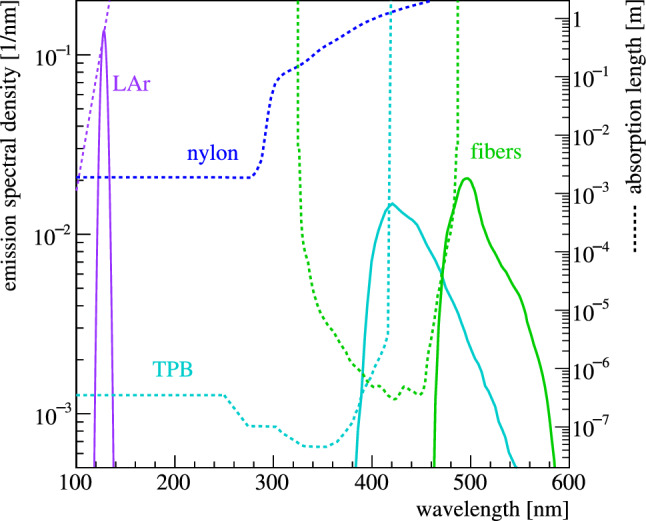
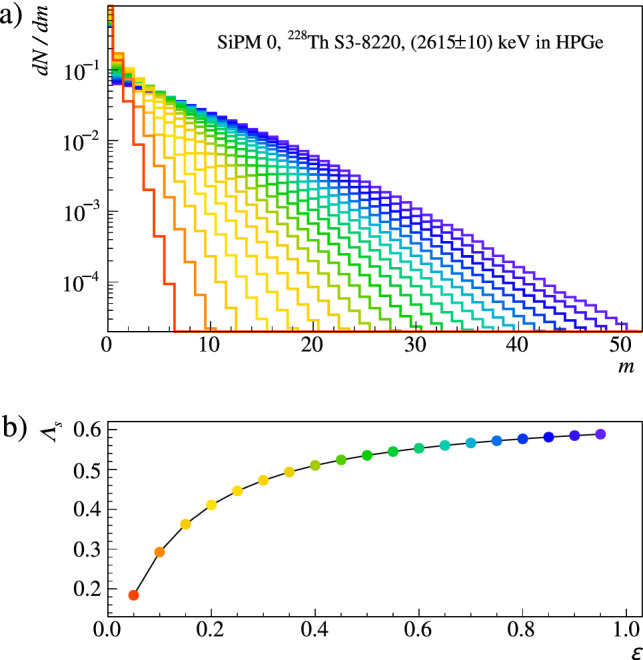
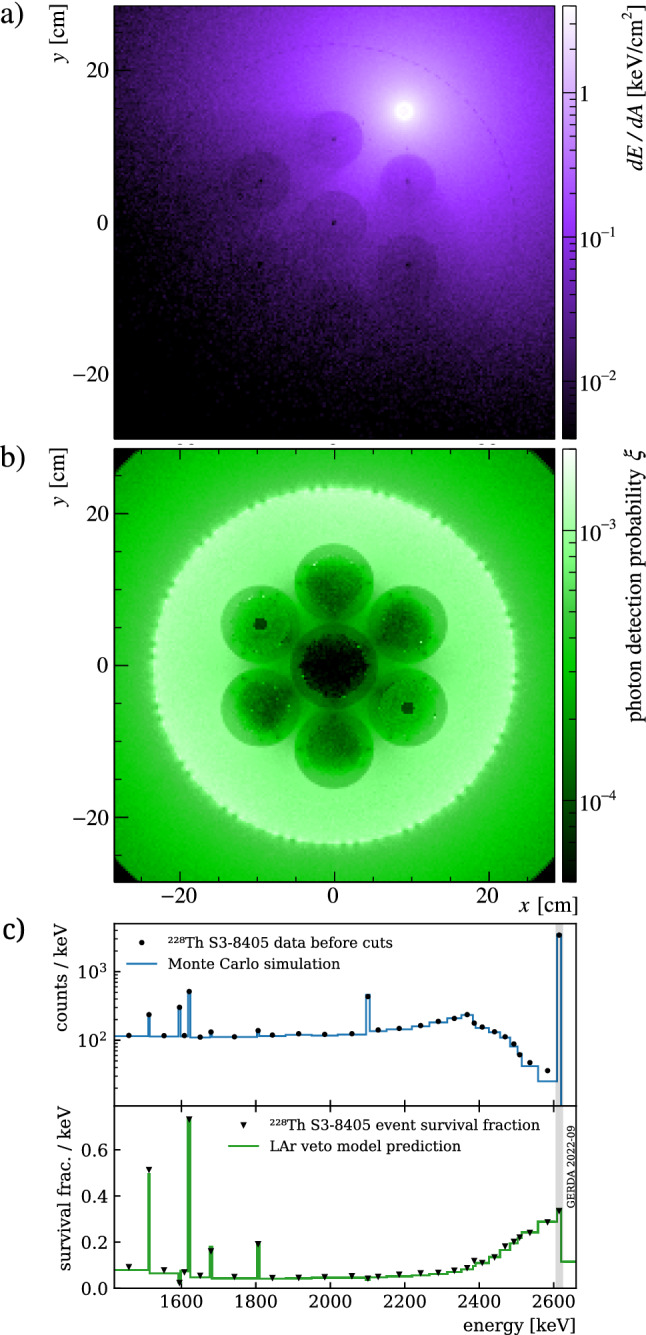
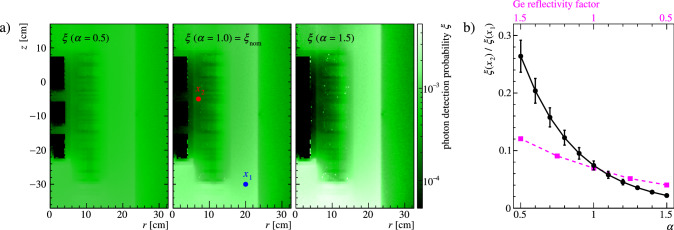
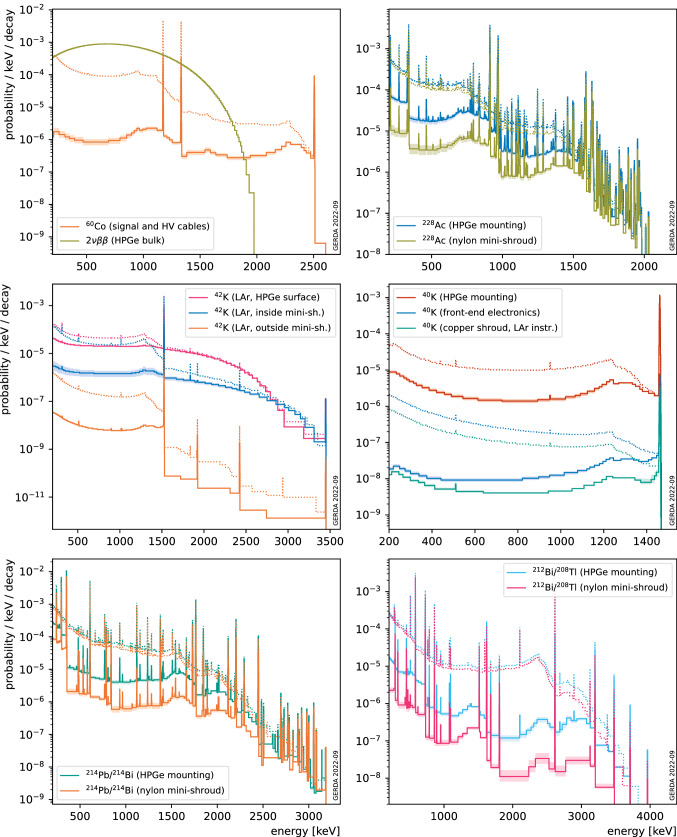
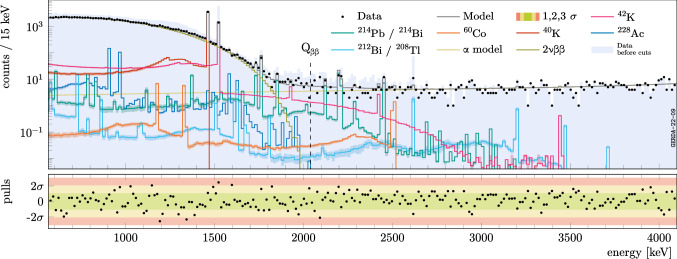
The ability to detect liquid argon scintillation light from within a densely packed high-purity germanium detector array allowed the Gerda experiment to reach an exceptionally low background rate in the search for neutrinoless double beta decay of 76 Ge. Proper modeling of the light propagation throughout the experimental setup, from any origin in the liquid argon volume to its eventual detection by the novel light read-out system, provides insight into the rejection capability and is a necessary ingredient to obtain robust background predictions. In this paper, we present a model of the Gerda liquid argon veto, as obtained by Monte Carlo simulations and constrained by calibration data, and highlight its application for background decomposition.


Figures

Fig. 1
Fig. 1
LAr veto instrumentation concept. Transport of light signals towards the PMTs or SiPMs relies on WLS processes in the TPB layers or optical fibers. Several potential light paths are indicated. Support structure details, electronics as well as individual fibers are not drawn
Fig. 2
Fig. 2
Simplified light collection chain. This one-dimensional representation depicts the main material properties that affect the light collection with the Gerda fiber-SiPM instrumentation. The overall light collection efficiency for the primary VUV photon is of O(0.1)%. In real life, effects like shadowing, reflections and optical coverage enter the game
Fig. 3
Fig. 3
Emission spectra (solid lines) and absorption length (dashed lines) of indicated materials. The primary emission from the LAr follows a simple Gaussian distribution centered at 128 nm. Its absorption length connects to larger wavelength with an ad-hoc exponential scaling. Absorption and re-emission appears in TPB and the polystyrene fiber material. Nylon is only transparent to larger wavelength
Fig. 4
Fig. 4
Binomial repopulation. a The pmf Λs[m](ε) defined in Eq. 4 can be obtained for any value of the detection efficiency ε from the unaltered simulation output. The example shows the pmf for a specific SiPM channel as obtained for 228Th decays in a calibration source at the top of the array (see also Tab. 1) depositing 2615 ± 10 keV in the HPGe detectors. The result is plotted for a selection of efficiency values, reported in the bottom panel. b The panel shows the non-linear dependence of the light detection probability Λs (defined in Eq. 5). The color coding relates data points with corresponding distributions in the top panel
Fig. 5
Fig. 5
Data/Monte Carlo comparison. a Projected distribution of the LAr energy depositions for simulated 208Tl 2615 keV FEP-events from a calibration source at position 8405 mm. Darker circles correspond to the volume occupied by the HPGe detectors. b Photon detection probability ξ in the same region. c Top panel: the energy spectrum of the 228Th data corresponding to figure a, before the LAr veto cut, compared to the Monte Carlo prediction. The pdf is normalized to reproduce the total count rate in data. Despite small shape discrepancies, the predicted LAr veto survival probability (bottom panel) matches the data over a wide range of energies, even far from the model optimization energy region (gray band). A variable binning is adopted for visualization purposes
Fig. 6
Fig. 6
Modification of the photon detection probability ξ(x) through analytical power-law distortions defined in Eq. 8. a Inhomogeneities that are present in the nominal map are amplified with increasing α, leading to a more homogeneous (α<1, i.e. less color contrast) or less homogeneous (α>1, i.e. more color contrast) response. b The probability ratio from two sample points x1 and x2, outside and within the array, highlights this modification (black data points). The comparison of an altered germanium reflectivity (magenta data points) shows how the distortions conservatively exceed ±50% on the reflectivity
Fig. 7
Fig. 7
Probability density functions (pdfs, normalized to the number of simulated primary decays) for a representative selection of background and signal event sources in the Gerda Phase II setup as detected by HPGe detectors and surviving the LAr veto cut, as predicted by the model presented in this document. Model uncertainties are shown as bands of lighter color. pdfS before the cut [28] (dotted lines) are overlaid for comparison. The reader is referred to [, Figure 1] for a detailed documentation of the simulated setup. A variable binning is adopted for visualization purposes
Fig. 8
Fig. 8
Background decomposition of the first 61.4 kg years of data from Gerda Phase II surviving the LAr veto cut (black dots). The veto model is applied to the existing background pdfs before the cut [28] folding in the probability map ξ(x) . Data before the cut is shown as a light blue filled histogram. Shaded bands constructed with the maximally distorted probability maps provide a visualization of the systematic uncertainty affecting each pdf

References

    1. Ackermann KH, et al. Eur. Phys. J. C. 2013;73(3):1–29. doi: 10.1140/epjc/s10052-013-2330-0. - DOI
    1. Agostini M, et al. Eur. Phys. J. C. 2022;82(4):284. doi: 10.1140/epjc/s10052-022-10163-w. - DOI - PMC - PubMed
    1. Agostini M, et al. Nature. 2017;544:47. doi: 10.1038/nature21717. - DOI - PubMed
    1. Agostini M, et al. Phys. Rev. Lett. 2020;125(25):252–502. doi: 10.1103/PhysRevLett.125.252502. - DOI - PubMed
    1. Agostini M, et al. Eur. Phys. J. C. 2015;75(10):506. doi: 10.1140/epjc/s10052-015-3681-5. - DOI