. 2023 Apr 12:17:1169288.
doi: 10.3389/fncom.2023.1169288. eCollection 2023.

Spike timing-dependent plasticity under imbalanced excitation and inhibition reduces the complexity of neural activity

Affiliations

Spike timing-dependent plasticity under imbalanced excitation and inhibition reduces the complexity of neural activity

Jihoon Park et al. Front Comput Neurosci. .

Abstract

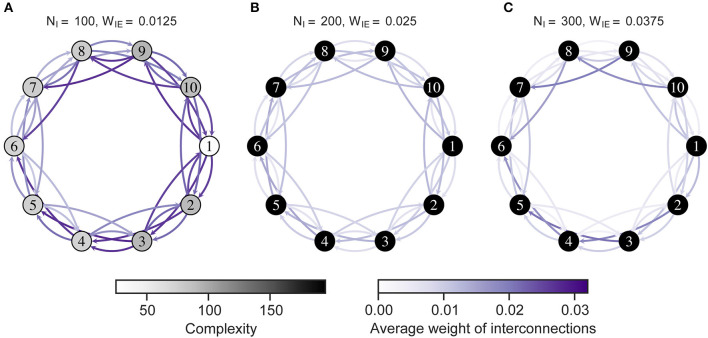
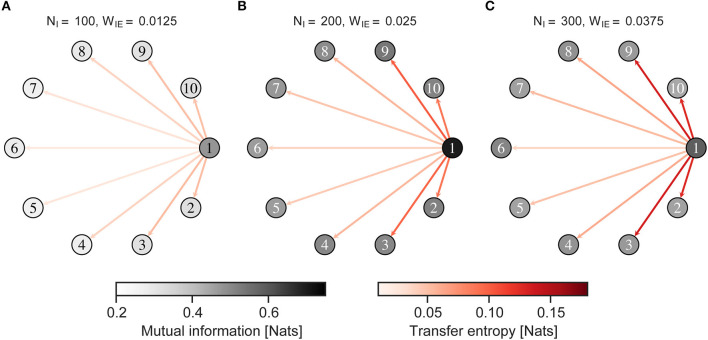
Excitatory and inhibitory neurons are fundamental components of the brain, and healthy neural circuits are well balanced between excitation and inhibition (E/I balance). However, it is not clear how an E/I imbalance affects the self-organization of the network structure and function in general. In this study, we examined how locally altered E/I balance affects neural dynamics such as the connectivity by activity-dependent formation, the complexity (multiscale entropy) of neural activity, and information transmission. In our simulation, a spiking neural network model was used with the spike-timing dependent plasticity rule to explore the above neural dynamics. We controlled the number of inhibitory neurons and the inhibitory synaptic weights in a single neuron group out of multiple neuron groups. The results showed that a locally increased E/I ratio strengthens excitatory connections, reduces the complexity of neural activity, and decreases information transmission between neuron groups in response to an external input. Finally, we argued the relationship between our results and excessive connections and low complexity of brain activity in the neuropsychiatric brain disorders.

Keywords: E/I balance; complexity; information transmission; neuropsychiatric brain disorder; self-organization; spiking neural network.


Conflict of interest statement

The authors declare that the research was conducted in the absence of any commercial or financial relationships that could be construed as a potential conflict of interest.

Figures

Figure 1
Figure 1
Neuron group model. (A) Intra- and interconnections in a model with two neuron groups. (B) A network model using ten neuron groups. Each neuron group comprises excitatory (red nodes) and inhibitory (blue nodes) neurons, as shown in (A). Excitatory neurons have intra- (black arrows) and interconnections (purple arrows), and inhibitory neurons have intraconnections only. Each white circle indicates a neuron group and purple arc arrows show connections between neuron groups. The number of inhibitory neurons and the synaptic weights from inhibitory neurons to excitatory neurons in neuron group 1 (imbalanced neuron group) are changed to control the local E/I balance. The parameters in other neuron groups (balanced neuron group) are not changed. E/I, excitation and inhibition.
Figure 2
Figure 2
The average weights of intra- and interconnections after self-organization in the model with two neuron groups. (A) The average weights of intraconnections in the imbalanced neuron group. (B) The average weights of intraconnections in the balanced neuron group. (C) The average weights of interconnections from the imbalanced neuron group to the balanced neuron group. (D) The average weights of interconnections from the balanced neuron group to the imbalanced neuron group. The x- and y-axes show the number of inhibitory neurons (NI) and weights from inhibitory neurons to excitatory neurons (WIE) in the imbalanced neuron group, respectively. The number and the number in parentheses in each box represents the average and standard deviations of the weights among 20 simulations, respectively. ***p < 0.001, **p < 0.01, *p < 0.05 indicate statistical significance for differences compared to values for the model with base parameters (NI = 200, WIE = 0.025) using Welch's t-tests.
Figure 3
Figure 3
Firing rate after self-organization in the model with two neuron groups. (A) Firing rate of excitatory neurons in the imbalanced neuron group. (B) Firing rate of excitatory neurons in the balanced neuron group. (C) Firing rate of inhibitory neurons in the imbalanced neuron group. (D) Firing rate of inhibitory neurons in the balanced neuron group. The x- and y-axes show the number of inhibitory neurons (NI) and weights from inhibitory neurons to excitatory neurons (WIE) in the imbalanced neuron group, respectively. The number and the number in parentheses in each box represents the average and standard deviations of the firing rate among 20 simulations, respectively. ***p < 0.001, **p < 0.01 indicate statistical significance for differences compared to values for the model with base parameters (NI = 200, WIE = 0.025) using Welch's t-tests.
Figure 4
Figure 4
Complexity of neural activity after self-organization in the model with two neuron groups. (A) Complexity of neural activity in the imbalanced neuron group. (B) Complexity of neural activity in the balanced neuron group. The x- and y-axes show the number of inhibitory neurons (NI) and weights from inhibitory neurons to excitatory neurons (WIE) in the imbalanced neuron group, respectively. Color indicates the summation of the sample entropy for all 100 scale factors. The number and the number in parentheses in each box represents the average and standard deviations of the complexity among 20 simulations, respectively. ***p < 0.001, *p < 0.05 indicate statistical significance for differences compared to values for the model with base parameters (NI = 200, WIE = 0.025) using Welch's t-tests.
Figure 5
Figure 5
The average weights of intra- and interconnections after self-organization. Each numbered circle indicates a neuron group with its index. The color of the node indicates the average weights of intraconnections. Purple arrows indicate the average weights of interconnections from one neuron group to another. Neuron group 1 has an imbalanced E/I ratio. (A) High-E/I. (B) Base-E/I. (C) Low-E/I. E/I, excitation and inhibition; WIE, the inhibitory synaptic weights to excitatory neurons; NI, the number of inhibitory neurons.
Figure 6
Figure 6
Complexity of neural activity in the neuron group after self-organization. Each numbered circle indicates a neuron group with its index. The color of the node indicates the complexity of neural activity in the neuron group that is the summation of the sample entropy for all 100 scale factors. Purple arrows indicate the average weights of interconnections from one neuron group to another. Neuron group 1 has an imbalanced E/I ratio. (A) High-E/I. (B) Baseline-E/I. (C) Low-E/I. E/I, excitation and inhibition; WIE, the inhibitory synaptic weights to excitatory neurons; NI, the number of inhibitory neurons.
Figure 7
Figure 7
Mutual information and transfer entropy in the neuron group after self-organization. Each numbered circle indicates a neuron group with its index. The color of the node indicates the mutual information between neural activity of the neuron group and the external input. Red arrows indicate the transfer entropy from neural activity of one neuron group receiving external input to another. Neuron group 1 has an imbalanced E/I ratio. The external input was fed into neuron group 1. (A) High-E/I. (B) Baseline-E/I. (C) Low-E/I. E/I, excitation and inhibition; WIE, the inhibitory synaptic weights to excitatory neurons; NI, the number of inhibitory neurons.
Figure 8
Figure 8
Mutual information and transfer entropy in the neuron group after self-organization. Each numbered circle indicates a neuron group with its index. The color of the node indicates the mutual information between neural activity of the neuron group and the external input. Red arrows indicate the transfer entropy from neural activity of one neuron group receiving external input to another. Neuron group 1 has an imbalanced E/I ratio. The external input was fed into neuron group 3. (A) High-E/I. (B) Baseline-E/I. (C) Low-E/I. E/I, excitation and inhibition; WIE, the inhibitory synaptic weights to excitatory neurons; NI, the number of inhibitory neurons.

References

    1. Akil A. E., Rosenbaum R., Josić K. (2021). Balanced networks under spike-time dependent plasticity. PLoS Comput. Biol. 17, e1008958. 10.1371/journal.pcbi.1008958 - DOI - PMC - PubMed
    1. Blatt G. J., Fatemi S. H. (2011). Alterations in gabaergic biomarkers in the autism brain: research findings and clinical implications. Anat. Rec. Adv. Integr. Anat. Evol. Biol. 294, 1646–1652. 10.1002/ar.21252 - DOI - PMC - PubMed
    1. Börgers C., Kopell N. (2003). Synchronization in networks of excitatory and inhibitory neurons with sparse, random connectivity. Neural Comput. 15, 509–538. 10.1162/089976603321192059 - DOI - PubMed
    1. Bosl W., Tierney A., Tager-Flusberg H., Nelson C. (2011). Eeg complexity as a biomarker for autism spectrum disorder risk. BMC Med. 9, 18. 10.1186/1741-7015-9-18 - DOI - PMC - PubMed
    1. Caporale N., Dan Y. (2008). Spike timing–dependent plasticity: a hebbian learning rule. Annu. Rev. Neurosci. 31, 25–46. 10.1146/annurev.neuro.31.060407.125639 - DOI - PubMed

LinkOut - more resources