. 2023 Apr 12:3:1144266.
doi: 10.3389/fbinf.2023.1144266. eCollection 2023.

Gene length is a pivotal feature to explain disparities in transcript capture between single transcriptome techniques

Affiliations

Gene length is a pivotal feature to explain disparities in transcript capture between single transcriptome techniques

Ricardo R Pavan et al. Front Bioinform. .

Abstract

The scale and capability of single-cell and single-nucleus RNA-sequencing technologies are rapidly growing, enabling key discoveries and large-scale cell mapping operations. However, studies directly comparing technical differences between single-cell and single-nucleus RNA sequencing are still lacking. Here, we compared three paired single-cell and single-nucleus transcriptomes from three different organs (Heart, Lung and Kidney). Differently from previous studies that focused on cell classification, we explored disparities in the transcriptome output of whole cells relative to the nucleus. We found that the major cell clusters could be recovered by either technique from matched samples, but at different proportions. In 2/3 datasets (kidney and lung) we detected clusters exclusively present with single-nucleus RNA sequencing. In all three organ groups, we found that genomic and gene structural characteristics such as gene length and exon content significantly differed between the two techniques. Genes recovered with the single-nucleus RNA sequencing technique had longer sequence lengths and larger exon counts, whereas single-cell RNA sequencing captured short genes at higher rates. Furthermore, we found that when compared to the whole host genome (mouse for kidney and lung datasets and human for the heart dataset), single transcriptomes obtained with either technique skewed from the expected proportions in several points: a) coding sequence length, b) transcript length and c) genomic span; and d) distribution of genes based on exons counts. Interestingly, the top-100 DEG between the two techniques returned distinctive GO terms. Hence, the type of single transcriptome technique used affected the outcome of downstream analysis. In summary, our data revealed both techniques present disparities in RNA capture. Moreover, the biased RNA capture affected the calculations of basic cellular parameters, raising pivotal points about the limitations and advantages of either single transcriptome techniques.

Keywords: biased gene capture; bioinformatic; data analysis; next-generation sequencing; single-cell RNA sequencing; single-nucleus RNA sequencing.


Conflict of interest statement

The authors declare that the research was conducted in the absence of any commercial or financial relationships that could be construed as a potential conflict of interest.

Figures
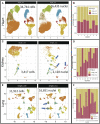
FIGURE 1
FIGURE 1
Cell distribution on low dimensional space after integration of single-cell and single-nucleus RNA sequencing datasets. Integrated organ derived datasets for heart, kidney, and lung are depicted. The total number of cells per dataset is shown on each panel ((A, C, E) respectively). Distribution of cellular proportions between single transcriptome technique and clusters for heart, kidney, and lung are shown ((B, D, F) respectively). Single-Cell RNA sequencing dataset (single_cell); single-nucleus RNA sequencing dataset (single_nuc).
FIGURE 2
FIGURE 2
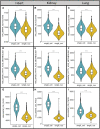
Measurements of RNA capture, gene mapping and subsampling of cells from single-cell and single-nucleus RNA sequencing. The number of features (genes) was plotted against the RNA reads mapped (counts) per cell, for both single-cell or single nucleus RNA sequencing, in all three organs (A–C) respectively). Total number of RNA reads mapped (counts) per cell compared between techniques (D–F) top panels). Comparisons of the total number of identified genes per cell between techniques (D–F) bottom panels). Comparisons of the total number of counts and features obtained from the sub-sampled datasets are depicted (G–I). Sample comparison performed with Wilcoxon Rank Sum test, **p < 0.001 and ***p < 0.0001, ns = not statistically significant.
FIGURE 3
FIGURE 3
Different gene capture between techniques reveals a bias toward gene length. Dotplots depicting the expression of long vs. short genes in single-cell RNA sequencing (Single-Cell) or single-nucleus RNA sequencing (Single_Nuc). Vertical numbers on the right side of each panel represent exon counts for genes in heart, kidney, and lung groups ((A–E) respectively). Expression scores for long and short genes plotted on the UMAP projections of each cell for all paired datasets from heart, kidney and lung (B–F). The color key indicating normalized expression scores, and it was set to have the same intensity between the two single transcriptome technique (yellow = low, blue = high).
FIGURE 4
FIGURE 4
Comparisons of exon counts and sequencing length between single transcriptome techniques. The top-100 DEG between techniques were compared based on their sequencing length (A–G); Exon counts (B–H) for the heart, kidney and lung. Density curves for genes vs. number of exon were generated to each single transcriptome technique and overlapped. The mean number of exons is depicted as a dashed line, for the heart, kidney and lung groups (C–I). The density plots were cropped for better visualization of mean distances. Inset in figures C and F represent whole distribution. The number of genes in (I) with more the 70 exons was negligible.
FIGURE 5
FIGURE 5
Exons counts comparisons between DEG from each single transcriptome technique with expected ratios for the whole host genome. The DEG from each technique was compare with the host genome to evaluate the distribution of genes containing few versus genes containing several exons in all three organs studied (heart (A, B); kidney (C, D); lung (E, F).
FIGURE 6
FIGURE 6
Top-20 GO terms obtained with the DEG list from each single transcriptome technique in all three organs. The top-100 DEG from each technique and organ were fed into the ShinyGO API. The top-20 GO terms are depicted, the color key shows fold enrichment (heart (A–B); kidney (C, D); lung (E, F)).
FIGURE 7
FIGURE 7
Metabolic pathways have higher normalized expression scores with single-cell RNA sequencing. All datasets were used to calculate normalized expression scores for Hallmark pathways of glycolysis (A–C), fatty acid synthesis (D–F) and oxidative phosphorylation (G–I). The obtained scores between different single transcriptome techniques were compared with Wilcoxon Rank Sum Test across techniques ***p-value <0.0001.

References

    1. Adam M., Potter A. S., Potter S. S. (2017). Psychrophilic proteases dramatically reduce single-cell RNA-seq artifacts: A molecular atlas of kidney development. Dev. Camb. 144 (19), 3625–3632. 10.1242/dev.151142 - DOI - PMC - PubMed
    1. Aibar S., González-Blas C. B., Moerman T., Huynh-Thu V. A., Imrichova H., Hulselmans G., et al. (2017). Scenic: Single-cell regulatory network inference and clustering. Nat. Methods 14 (11), 1083–1086. 10.1038/nmeth.4463 - DOI - PMC - PubMed
    1. Barbie D. A., Tamayo P., Boehm J. S., Kim S. Y., Moody S. E., Dunn I. F., et al. (2009). Systematic RNA interference reveals that oncogenic KRAS-driven cancers require TBK1. Nature 462 (7269), 108–112. 10.1038/nature08460 - DOI - PMC - PubMed
    1. Björk P., Wieslander L. (2014). Mechanisms of mRNA export. Seminars Cell Dev. Biol. 32, 47–54. 10.1111/tra.12691 - DOI - PubMed
    1. Borcherding N., Vishwakarma A., Voigt A. P., Bellizzi A., Kaplan J., Nepple K., et al. (2021). Mapping the immune environment in clear cell renal carcinoma by single-cell genomics. Commun. Biol. 4 (1), 122–211. 10.1038/s42003-020-01625-6 - DOI - PMC - PubMed

LinkOut - more resources