

Narrative minireview of the spatial epidemiology of substance use disorder in the United States: Who is at risk and where?
- PMID: 37123313
- PMCID: PMC10131000
- DOI: 10.12998/wjcc.v11.i11.2374
Narrative minireview of the spatial epidemiology of substance use disorder in the United States: Who is at risk and where?
Abstract
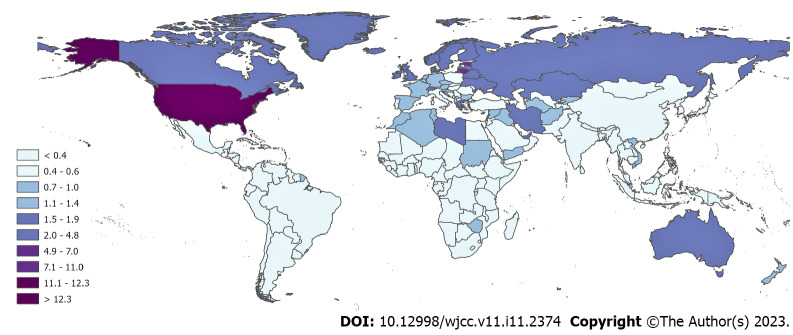
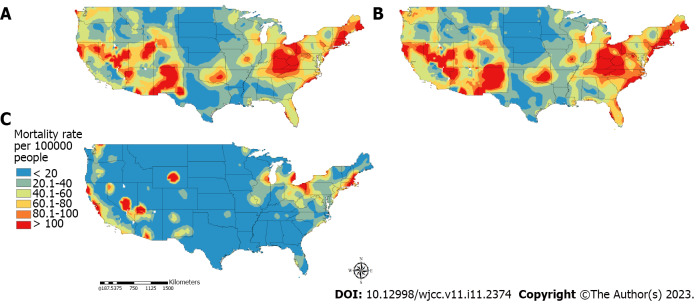
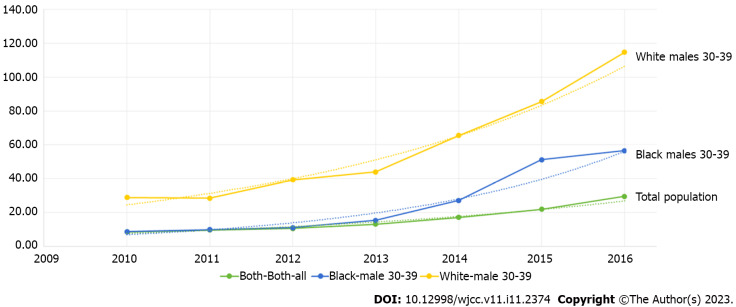
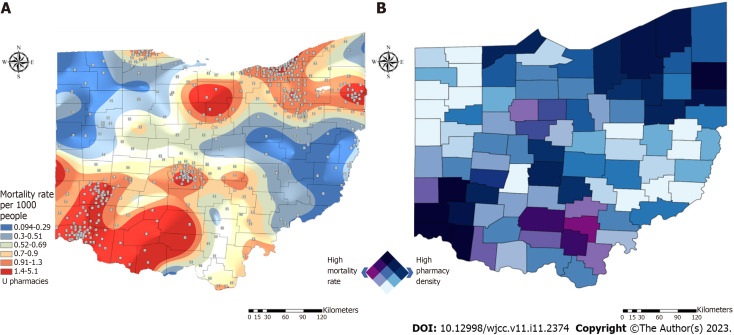
Drug overdose is the leading cause of death by injury in the United States. The incidence of substance use disorder (SUD) in the United States has increased steadily over the past two decades, becoming a major public health problem for the country. The drivers of the SUD epidemic in the United States have changed over time, characterized by an initial heroin outbreak between 1970 and 1999, followed by a painkiller outbreak, and finally by an ongoing synthetic opioid outbreak. The nature and sources of these abused substances reveal striking differences in the socioeconomic and behavioral factors that shape the drug epidemic. Moreover, the geospatial distribution of the SUD epidemic is not homogeneous. The United States has specific locations where vulnerable communities at high risk of SUD are concentrated, reaffirming the multifactorial socioeconomic nature of this epidemic. A better understanding of the SUD epidemic under a spatial epidemiology framework is necessary to determine the factors that have shaped its spread and how these patterns can be used to predict new outbreaks and create effective mitigation policies. This narrative minireview summarizes the current records of the spatial distribution of the SUD epidemic in the United States across different periods, revealing some spatiotemporal patterns that have preceded the occurrence of outbreaks. By analyzing the epidemic of SUD-related deaths, we also describe the epidemic behavior in areas with high incidence of cases. Finally, we describe public health interventions that can be effective for demographic groups, and we discuss future challenges in the study and control of the SUD epidemic in the country.
Keywords: Disease mapping; Risk factors; Spatial epidemiology; Spatial statistics; Substance use disorder.
©The Author(s) 2023. Published by Baishideng Publishing Group Inc. All rights reserved.
Conflict of interest statement
Conflict-of-interest statement: All the authors report no relevant conflicts of interest for this article.
Figures
References
-
- American Society of Addiction Medicine (ASAM) Public Policy Statement: Long Definition of Addiction, 2019. Available from: https://academic.oup.com/book/29516/chapter-abstract/248088740?redirecte... .
-
- CDC National Center for Health Statistics Mortality Data on CDC WONDER. 2022. Available from: https://wonder.cdc.gov/Deaths-by-Underlying-Cause.html .
-
- NIH Overdose Death Rates. 2022. Available from: https://www.nih.gov/
Publication types
LinkOut - more resources
Full Text Sources
Miscellaneous
