. 2023 Jan;8(1):92-104.
doi: 10.1039/d2me00179a. Epub 2022 Sep 28.

Oxidative Degradation of Sequence-Defined Peptoid Oligomers

Affiliations

Oxidative Degradation of Sequence-Defined Peptoid Oligomers

Hattie C Schunk et al. Mol Syst Des Eng. 2023 Jan.

Abstract

Due to their N-substitution, peptoids are generally regarded as resistant to biological degradation, such as enzymatic and hydrolytic mechanisms. This stability is an especially attractive feature for therapeutic development and is a selling point of many previous biological studies. However, another key mode of degradation remains to be fully explored, namely oxidative degradation mediated by reactive oxygen and nitrogen species (ROS/RNS). ROS and RNS are biologically relevant in numerous contexts where biomaterials may be present, thus, improving understanding of peptoid oxidative susceptibility is crucial to exploit their full potential in the biomaterials field, where an oxidatively-labile but enzymatically stable molecule can offer attractive properties. Toward this end, we demonstrate a fundamental characterization of sequence-defined peptoid chains in the presence of chemically generated ROS, as compared to ROS-susceptible peptides such as proline and lysine oligomers. Lysine oligomers showed the fastest degradation rates to ROS and the enzyme trypsin. Peptoids degraded in metal catalyzed oxidation conditions at rates on par with poly(prolines), while maintaining resistance to enzymatic degradation. Furthermore, lysine-containing peptide-peptoid hybrid molecules showed tunability in both ROS-mediated and enzyme-mediated degradation, with rates intermediate to lysine and peptoid oligomers. When lysine-mimetic side-chains were incorporated into a peptoid backbone, the rate of degradation matched that of the lysine peptide oligomers, but remained resistant to enzymatic degradation. These results expand understanding of peptoid degradation to oxidative and enzymatic mechanisms, and demonstrate the potential for peptoid incorporation into materials where selectivity towards oxidative degradation is necessary, or directed enzymatic susceptibility is desired.

Keywords: Degradation; Peptoids; Reactive Oxygen Species; Sequence-Defined.


Conflict of interest statement

Conflicts of Interest There are no conflicts to declare.

Figures

Figure 1:
Figure 1:. Summary schematic of peptide and peptoid molecules explored for oxidative and enzymatic degradation.
A) Peptide vs. peptoid chemical structure depicted with representative trimers. B) Peptide and C) peptoid residues explored for oxidative and enzymatic degradation. D) Name, sequence, substrate classification, applicable library of investigation, and analyses conducted of all oligomers investigated. Full chemical structures, MALDI-TOF spectra, and LC-MS chromatographs for each molecule are included in Figures S1–5.
Figure 2:
Figure 2:. Comparison of peptide vs. peptoid oxidative and enzymatic degradation.
A) LC traces of selected 18-mer L-proline peptide, (LPro)18, in comparison to B) 18-mer N-methylglycine peptoid, (NAla)18, upon exposure to 10 mM H2O2 (top panel), 10 mM H2O2 + 50 μM CuSO4 (middle panel) or 10 μM trypsin (bottom panel). As indicated by the arrows, timepoints were taken at 15-minute intervals over the course of 2 hours for H2O2 + 50 μM CuSO4 (MCO) and at 24-hour intervals over the course of 7 days for H2O2 and Trypsin. LC traces of the other 18-mer oligomers can be found in Figure S7. C) Comparison of 18-mer oligomer peptide and peptoid degradation rates when exposed to oxidative (10 mM H2O2 + 50 μM CuSO4) and D) enzymatic (1 μM trypsin) stimuli. E) Comparison of 6-mer fluorescent homopolymer peptides and peptoids when exposed to 10 mM H2O2 + 50 μM CuSO4. Peptides are shown with closed markers and solid lines. Peptoids are shown with open markers and dashed lines. Each point represents max absorbance of degraded substrate samples normalized to max absorbance of control (n=3). Lines only represent a guide for the eye. Error bars represent standard deviation from three experimental replicates.
Figure 3:
Figure 3:. Fluorescent Reporter Degradation Study.
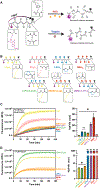
A) Schematic of FRET design and resulting degradation products. Each 6-mer oligomer sequence is flanked with L-Lysines functionalized with 2,4-dinitropheyl (Dnp) quencher on the C-terminus and 7-methoxycoumarin (Mca) fluorophore on the N-terminus. B) Schematic of fluorescent 6-mer library structures and sequences C) Fluorescence tracking of degradation when exposed to 10 mM H2O2 + 50 μM CuSO4 stimuli for 3 hours and comparison of half-lives (min) from exponential plateau fit. C) Fluorescence tracking of degradation when exposed to 0.1 μM trypsin stimuli for 3 hours and comparison of half-lives (min) from exponential plateau fit. All oligomers were at a concentration of 10 μM. For fluorescence tracking, error bars represent standard deviation from three experimental replicates and the dashed line represents exponential plateau model fit. For bar-graphs, error bars represent the 95% confidence intervals. Significance brackets extend over all samples that are significantly different from one another such that *p ≤ 0.05 with exceptions (ns) denoted.
Figure 4:
Figure 4:. Fluorescent Reporter ‘Sequence Effects’ Degradation Study.
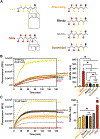
A) Schematic of fluorescent 6-mer sequence effect library. B) Fluorescence tracking of degradation when exposed to 10 mM H2O2 + 50 μM CuSO4 stimuli for 3 hours and comparison of half-lives (min) from exponential plateau fit. C) Fluorescence tracking of degradation when exposed to 0.1 μM trypsin stimuli for 3 hours and comparison of half-lives (min) from exponential plateau fit. All oligomers were at a concentration of 10 μM. For fluorescence tracking, error bars represent standard deviation from three experimental replicates and the dashed line represents exponential plateau model fit. For bar-graphs, error bars represent the 95% confidence intervals. Significance brackets extend over all samples that are significantly different from one another such that *p ≤ 0.05 with exceptions (ns) denoted.

References

    1. Berlett BS and Stadtman ER, J. Biol. Chem, 1997, 272, 20313–20316. - PubMed
    1. Ulbricht J, Jordan R and Luxenhofer R, Biomaterials, 2014, 35, 4848–4861. - PubMed
    1. Starke-Reed PE and Oliver CN, Arch. Biochem. Biophys, 1989, 275, 559–567. - PubMed
    1. Mittal M, Siddiqui MR, Tran K, Reddy SP and Malik AB, Antioxidants Redox Signal, 2014, 20, 1126–1167. - PMC - PubMed
    1. Joshi-Barr S, de Gracia Lux C, Mahmoud E and Almutairi A, Antioxid. Redox Signal, 2014, 21, 730–754. - PMC - PubMed

LinkOut - more resources