. 2023 Apr 12:14:1118388.
doi: 10.3389/fpls.2023.1118388. eCollection 2023.

Hoverflies provide pollination and biological pest control in greenhouse-grown horticultural crops

Affiliations

Hoverflies provide pollination and biological pest control in greenhouse-grown horticultural crops

Hui Li et al. Front Plant Sci. .

Abstract

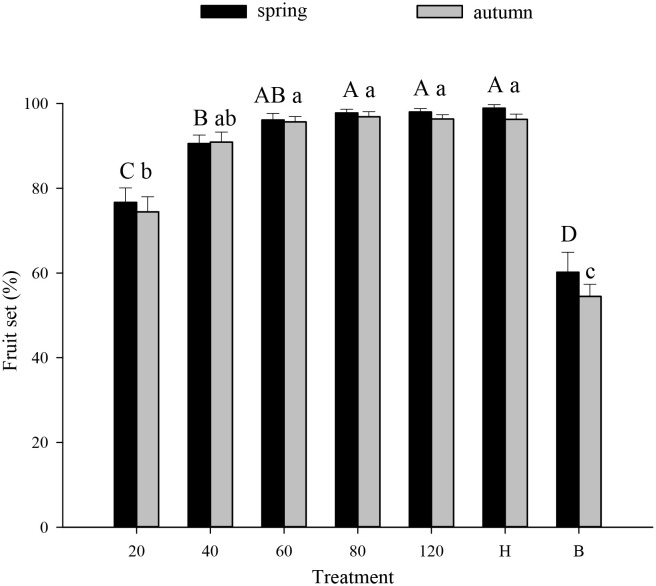
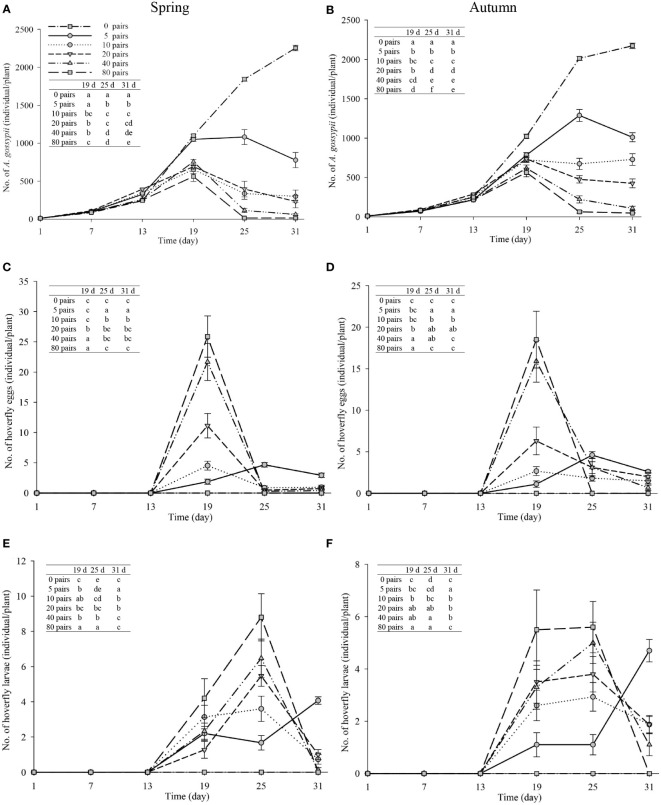
Beneficial insects provide pollination and biological control in natural and man-made settings. Those ecosystem services (ES) are especially important for high-value fruits and vegetables, including those grown under greenhouse conditions. The hoverfly Eupeodes corollae (Diptera: Syrphidae) delivers both ES, given that its larvae prey upon aphid pests and its adults pollinate crops. In this study, we investigated this dual role of E. corollae in three insect-pollinated and aphid-affected horticultural crops i.e., tomato, melon and strawberry within greenhouses in Hebei province (China). Augmentative releases of E. corollae increased fruit set and fruit weight of all three crops, and affected population dynamics of the cotton aphid Aphis gossypii (Hemiptera: Aphididae). On melon and strawberry, E. corollae suppressed A. gossypii populations by 54-99% and 50-70% respectively. In tomato, weekly releases of 240 E. corollae individuals/100 m2led to 95% fruit set. Meanwhile, releases of 160 hoverfly individuals per 100 m2led to 100% fruit set in melon. Also, at hoverfly/aphid release rates of 1:500 in spring and 1:150 in autumn, aphid populations were reduced by more than 95% on melon. Lastly, on strawberry, optimum levels of pollination and aphid biological control were attained at E. corollae release rates of 640 individuals/100 m2. Overall, our work shows how augmentative releases of laboratory-reared hoverflies E. corollae can enhance yields of multiple horticultural crops while securing effective, non-chemical control of resident aphid pests.

Keywords: Eupeodes corollae; agroecology; aphid control; food safety; horticulture; pollination; protected cultivation.


Conflict of interest statement

The authors declare that the research was conducted in the absence of any commercial or financial relationships that could be construed as a potential conflict of interest.

Figures

Figure 1
Figure 1
Fruit set of tomato (% per plant) under different experimental treatments during spring or autumn 2020-21. Numbers in the X axis refer to the total number of hoverfly adults that were released i.e., 20, 40, 60, 80 or 120; data are also plotted for hormone (H) and bagging (B) treatments. Different uppercase and lowercase letters indicate statistically significant differences between treatment groups during either season (One-way ANOVA, P<0.05, Tukey’s HSD post-hoc).
Figure 2
Figure 2
Fruit weight of tomato (g/plant) in different experimental treatments during spring and autumn 2020-21. Numbers in the X axis refer to the total number of hoverfly adults that were released i.e., 20, 40, 60, 80 or 120; data are also plotted for hormone (H) and bagging (B) treatments. Different uppercase and lowercase letters indicate statistically significant differences between treatment groups during either season (One-way ANOVA, P<0.05, Tukey’s HSD post-hoc). Asterisks refer to seasonal differences in fruit weight under the same treatment.
Figure 3
Figure 3
Fruit set of muskmelon (% per plant) under different experimental treatments during spring or autumn 2020-21. Numbers in the X axis refer to the total number of hoverfly adults that were released i.e., 5, 10, 20, 40 or 80 pairs; data are also plotted for hormone (H) and bagging (B) treatments. Different uppercase and lowercase letters indicate statistically significant differences between treatment groups during either season (One-way ANOVA, P<0.05, Tukey’s HSD post-hoc).
Figure 4
Figure 4
Number of A. gossypii (A, B), hoverfly eggs (C, D) and hoverfly larvae (E, F) per muskmelon plant over time during spring and autumn 2020-21. Hoverflies were released on day 7, 13, 19, 25 and 31. Mesh bags that covered individual aphid-infested plants were removed on day #13. Data are plotted for different hoverfly release rates i.e., 0 (i.e., hormone treatment), 5, 10, 20, 40 and 80 adult pairs. Different lowercase letters indicate statistically significant differences between treatment groups on the same time in each figure (One-way ANOVA, P<0.05, Tukey’s HSD post-hoc).
Figure 5
Figure 5
Fruit weight of muskmelon (g/plant) in different experimental treatments during spring and autumn 2020-21. Numbers in the X axis refer to the total number of hoverfly adults that were released i.e., 5, 10, 20, 40 or 80 pairs; data are also plotted for hormone (H) and bagging (B) treatments. Different uppercase and lowercase letters indicate statistically significant differences between treatment groups during either season (One-way ANOVA, P<0.05, Tukey’s HSD post-hoc). Asterisks refer to seasonal differences in fruit weight under the same treatment.
Figure 6
Figure 6
Fruit set of strawberry (% per plant) under different experimental treatments during winter 2020-21. Numbers in the X axis refer to the total number of hoverfly adults that were released i.e., 10, 20, 40 or 80 pairs; data are also plotted for a bagging (B) treatment. Different lowercase letters indicate statistically significant differences between treatment groups (One-way ANOVA, P<0.05, Tukey’s HSD post-hoc).
Figure 7
Figure 7
Number of A. gossypii (A), hoverfly eggs (B) and hoverfly larvae (C) per strawberry plant over time during winter 2020-21. Four consecutive hoverfly releases were conducted (as shown by boxes on the abscissa in each figure). Data are plotted for different hoverfly release rates i.e., 0 (i.e., bagging treatment), 10, 20, 40 and 80 adult pairs. Different lowercase letters indicate statistically significant differences between treatment groups on the same time in each figure (One-way ANOVA, P<0.05, Tukey’s HSD post-hoc).
Figure 8
Figure 8
Fruit weight of strawberry (g/plant) in different experimental treatments during winter 2020-21. Numbers in the X axis refer to the total number of hoverfly adults that were released i.e., 10, 20, 40 or 80 pairs; data are also plotted for a bagging (B) treatment. Different lowercase letters indicate statistically significant differences between treatment groups (One-way ANOVA, P<0.05, Tukey’s HSD post-hoc).

References

    1. Aizen M. A., Garibaldi L. A., Cunningham S. A., Klein A. M. (2009). How much does agriculture depend on pollinators? lessons from long-term trends in crop production. Ann. Bot. 103, 1579–1588. doi: 10.1093/aob/mcp076 - DOI - PMC - PubMed
    1. Bale J. S., Van Lenteren J. C., Bigler F. (2008). Biological control and sustainable food production. Phil. Trans. R. Soc B 363, 761–776. doi: 10.1098/rstb.2007.2182 - DOI - PMC - PubMed
    1. Bartomeus I., Gagic V., Bommarco R. (2015). Pollinators, pests and soil properties interactively shape oilseed rape yield. Basic Appl. Ecol. 16, 737–745. doi: 10.1016/j.baae.2015.07.004 - DOI
    1. Bellefeuille Y., Fournier M., Lucas E. (2021). Biological control of the foxglove aphid using a banker plant with Eupeodes americanus (Diptera: Syrphidae) in experimental and commercial greenhouses. Biol. Control 155, 104541. doi: 10.1016/j.biocontrol.2021.104541 - DOI
    1. Biesmeijer J. C., Roberts S. P., Reemer M., Ohlemüller R., Edwards M., Peeters T., et al. . (2006). Parallel declines in pollinators and insect-pollinated plants in Britain and the Netherlands. Science 313, 351–354. doi: 10.1126/science.1127863 - DOI - PubMed

LinkOut - more resources