. 2023 Apr 26;13(19):13017-13029.
doi: 10.1039/d3ra01436c. eCollection 2023 Apr 24.

A sigh-performance hydrogen gas sensor based on Ag/Pd nanoparticle-functionalized ZnO nanoplates

Affiliations

A sigh-performance hydrogen gas sensor based on Ag/Pd nanoparticle-functionalized ZnO nanoplates

To Thi Nguyet et al. RSC Adv. .

Abstract

As a source of clean energy, hydrogen (H2) is a promising alternative to fossil fuels in reducing the carbon footprint. However, due to the highly explosive nature of H2, developing a high-performance sensor for real-time detection of H2 gas at low concentration is essential. Here, we demonstrated the H2 gas sensing performance of Ag/Pd nanoparticle-functionalized ZnO nanoplates. Bimetallic Ag/Pd nanoparticles with an average size of 8 nm were prepared and decorated on the surface of ZnO nanoplates to enhance the H2 gas sensing performance. Compared with pristine ZnO, the sensor based on ZnO nanoplate doped with Ag/Pd (0.025 wt%) exhibited an outstanding response upon exposure to H2 gas (R a/R g = 78 for 500 ppm) with fast response time and speedy recovery. The sensor also showed excellent selectivity for the detection of H2 over the interfering gases (i.e., CO, NH3, H2S, and VOCs). The superior gas sensing of the sensor was dominated by the morphological structure of ZnO, and the synergistic effect of strong adsorption and the optimum catalytic characteristics of the bimetallic Ag/Pd enhances the hydrogen response of the sensors. Thus, bimetallic Ag/Pd-doped ZnO is a promising sensing material for the quantitative determination of H2 concentration towards industrial applications.


Conflict of interest statement

There are no conflicts to declare.

Figures

Fig. 1
Fig. 1. (A) Schematic diagram of the synthesis of pristine ZnO nanoplate, (B) Ag/Pd-doped ZnO nanoplates, (C) and the gas sensor fabricated by the drop-casting process.
Fig. 2
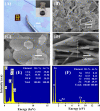
Fig. 2. Photo of the (A) fabricated 0.025 wt% sensors, and inset is a photo of the sensing material solution; and SEM images of the Ag/Pd-doped ZnO nanoplates at (B) low magnification, (C) high magnification, and (D) cross-sectional view. EDS spectra of the (E) Ag/Pd nanoparticle and (F) Ag/Pd-doped ZnO nanoplates.
Fig. 3
Fig. 3. (A) Low and (B–F) high magnification TEM images of the 0.025 wt% Ag/Pd-doped ZnO nanoplates. Inset (B) shows the corresponding selected area electron diffraction.
Fig. 4
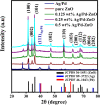
Fig. 4. XRD patterns of the bimetallic AgPd, pristine ZnO nanoplates, and Ag/Pd-doped ZnO nanoplates.
Fig. 5
Fig. 5. (A) The current–voltage characteristics of the Ag/Pd-doped ZnO nanoplates measured in the range of 200–400 °C in air; and (B) the calculated resistance of the sensor at different working temperatures.
Fig. 6
Fig. 6. (A) The transient response curve of the 0.025 wt% Ag/Pd–ZnO nanoplate sensor towards different H2 concentrations in the range 200–450 °C, (B) sensor response as a function of the H2 concentration.
Fig. 7
Fig. 7. (A) The response of the gas sensor shows a linear correlation with the H2 gas concentrations, (B) response/recovery times as a function of the H2 concentration. Note that there are six trials of independent measurement were used to the error estimation in figure.
Fig. 8
Fig. 8. (A) Comparison in the responses of the sensors based on pristine ZnO and 0.025 wt% Ag/Pd–ZnO toward 500 ppm H2 at different temperatures and the (B) selectivity of the Ag/Pd-doped ZnO sensor in the presence of interfering gases.
Fig. 9
Fig. 9. (A) The short-term and (B) long-term stability of the 0.025 wt% Ag/Pd–ZnO sensor after 4 continuous weeks of testing at 400 °C.
Fig. 10
Fig. 10. (A) The response in the temperature range of 200–450 °C (B) the dynamic resistance versus time, (C) calibration curve under various relative humidity, and (D) short-term stability toward 50 ppm H2 concentration in the presence of 60% RH of the 0.025 wt% Ag/Pd–ZnO sensor.
Fig. 11
Fig. 11. Schematic for the H2 gas sensing mechanism of (A) pristine ZnO, (B) AgPd-doped ZnO, and (C) the energy band diagram for the Ag/Pd-doped ZnO in the presence of air and H2 (Φ, Δ, and Δ′ denote the barrier height at the interface Ag–Pd NPs and ZnO and the modified barrier heights in air and H2 gas, respectively; W, δ, and δ′ are the depletion layer width and the modified depletion layer widths in presence of air and H2, respectively).

References

    1. Ahmad Fauzi A. S. Hamidah N. L. Sato S. Shintani M. Putri G. K. Kitamura S. Hatakeyama K. Quitain A. T. Kida T. Sens. Actuators, B. 2020;323:128678.
    1. Soboń A. Słyś D. Ruszel M. Wiącek A. Energies. 2021;14:7089.
    1. Cai L. Zhu S. Wu G. Jiao F. Li W. Wang X. An Y. Hu Y. Sun J. Dong X. Wang J. Lu Q. Jing Q. Liu B. Int. J. Hydrogen Energy. 2020;45:31327–31340.
    1. Zhou S. Ji J. Qiu T. Wang L. Ni W. Li S. Yan W. Ling M. Liang C. Inorg. Chem. Front. 2022;9:599–606.
    1. Arora K. Srivastava S. Solanki P. R. Puri N. K. IEEE Sens. J. 2019;19:8262–8271.