. 2023 Jun 23;51(11):5699-5713.
doi: 10.1093/nar/gkad311.

RecF protein targeting to postreplication (daughter strand) gaps I: DNA binding by RecF and RecFR

Affiliations

RecF protein targeting to postreplication (daughter strand) gaps I: DNA binding by RecF and RecFR

Camille Henry et al. Nucleic Acids Res. .

Erratum in

Abstract

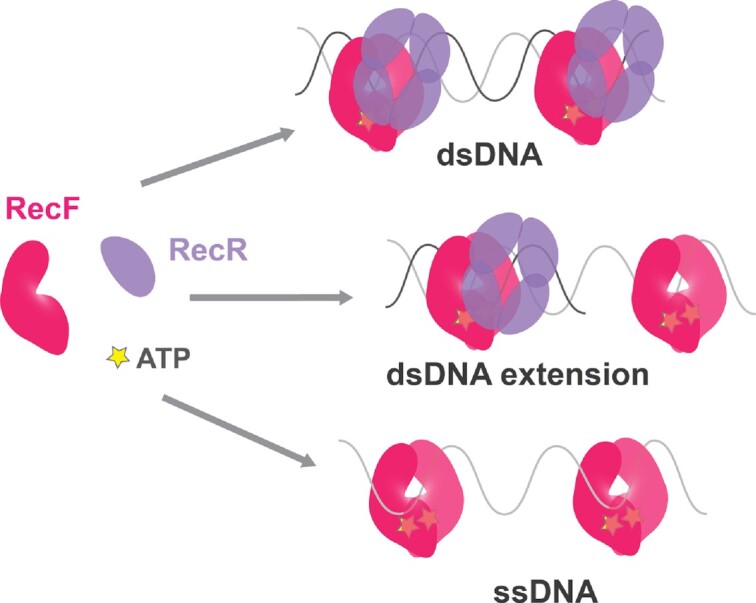
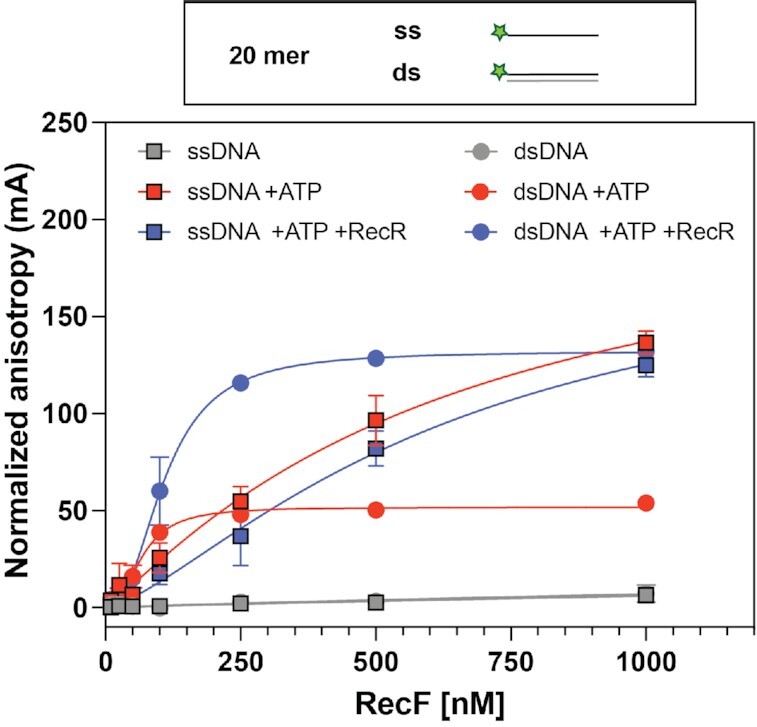
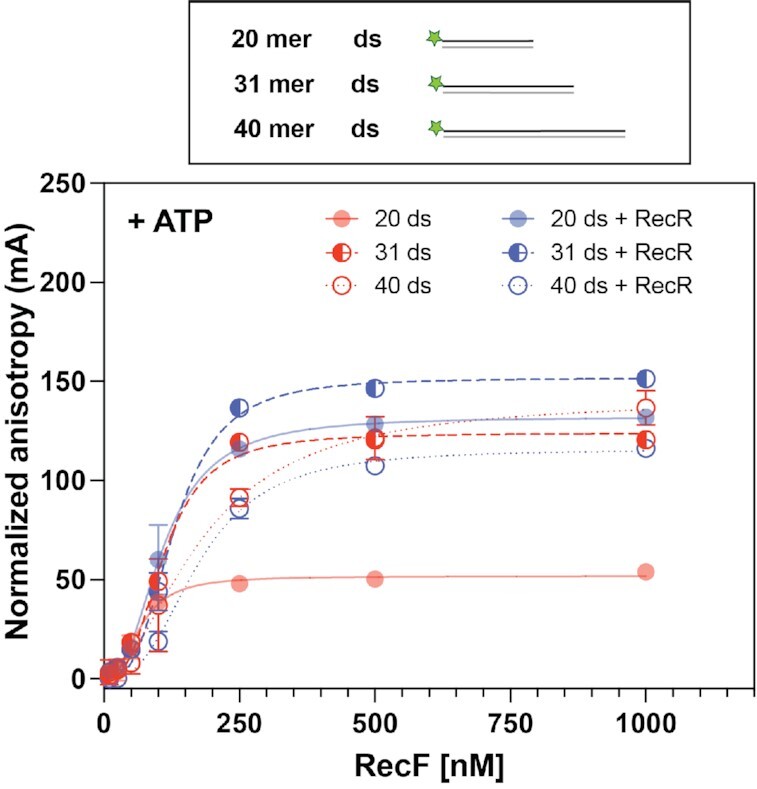
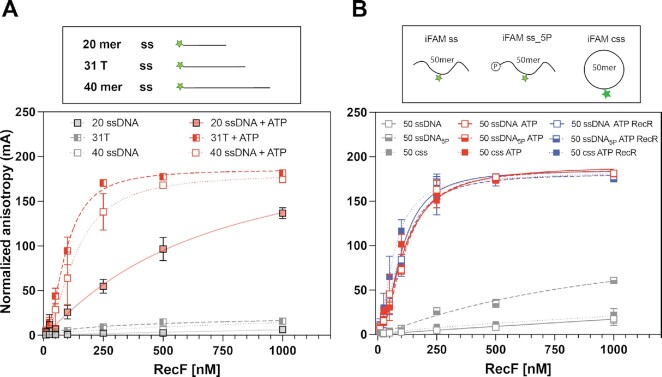
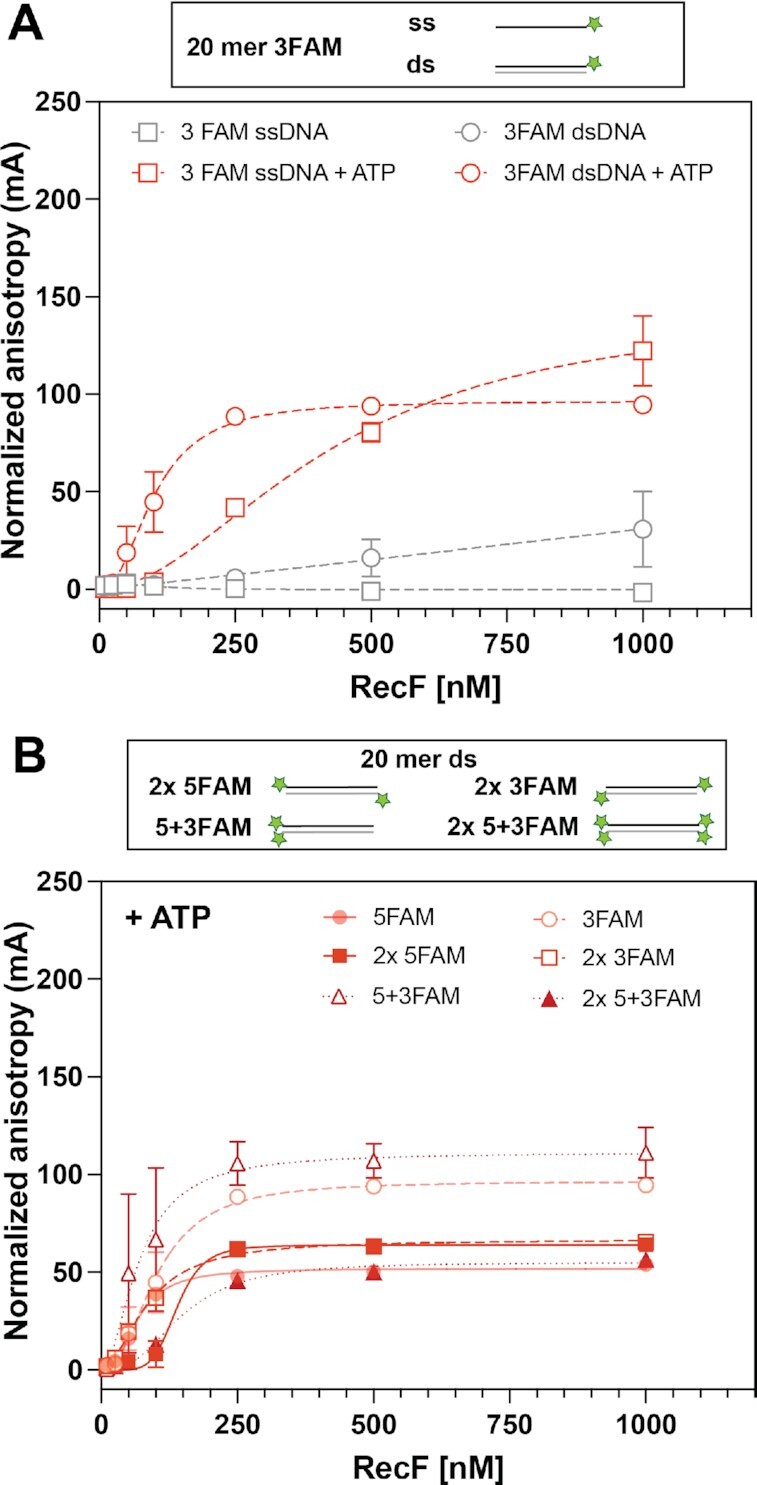
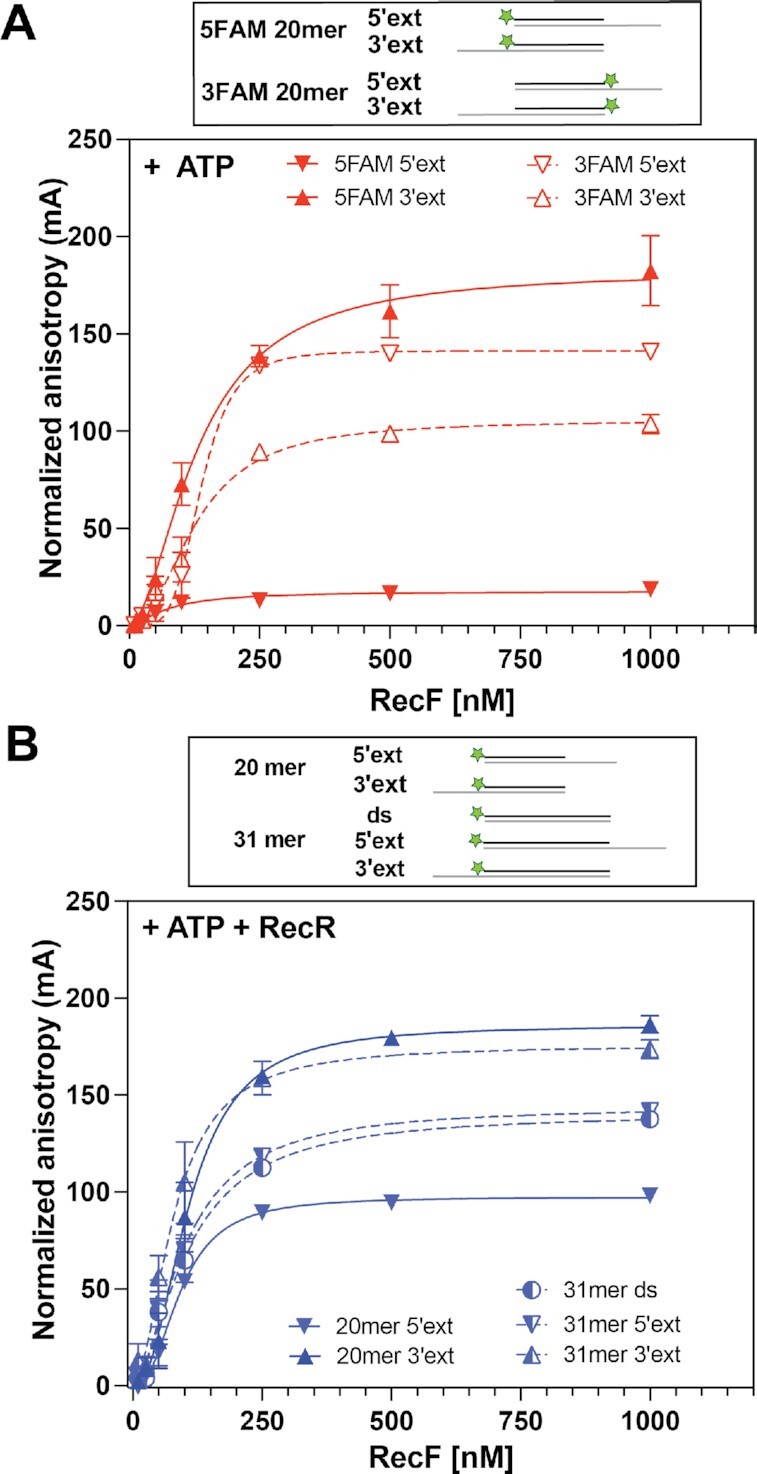
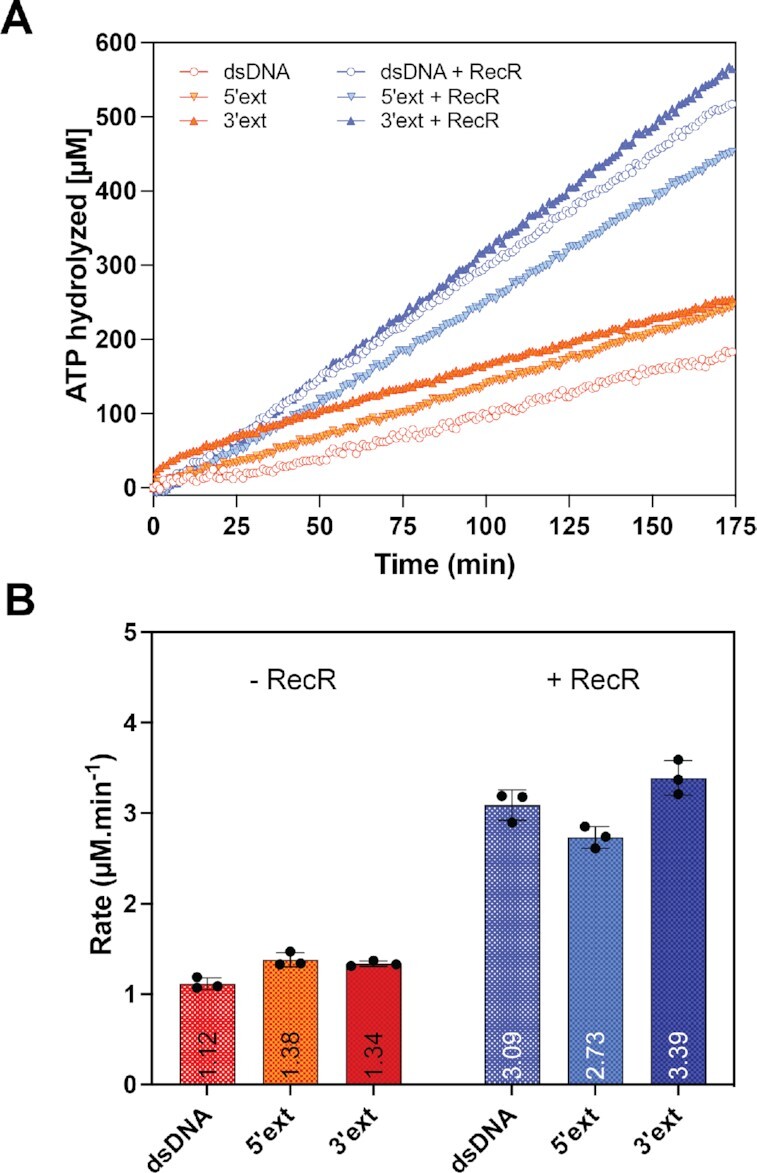
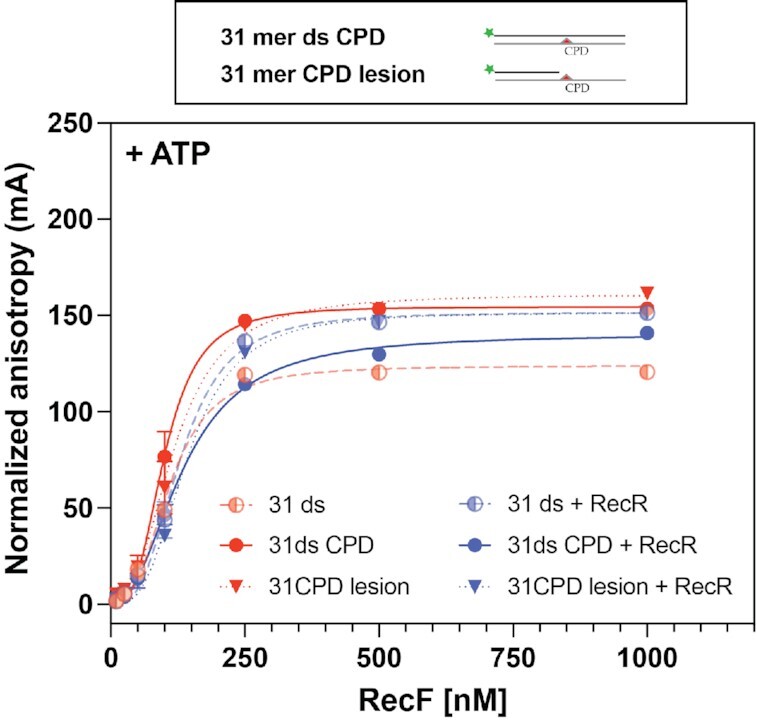
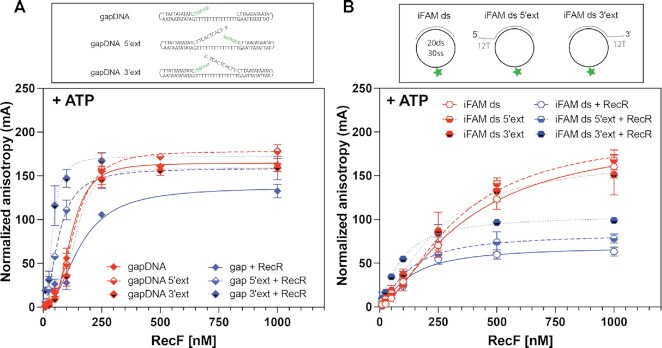
In bacteria, the repair of post-replication gaps by homologous recombination requires the action of the recombination mediator proteins RecF, RecO and RecR. Whereas the role of the RecOR proteins to displace the single strand binding protein (SSB) and facilitate RecA loading is clear, how RecF mediates targeting of the system to appropriate sites remains enigmatic. The most prominent hypothesis relies on specific RecF binding to gap ends. To test this idea, we present a detailed examination of RecF and RecFR binding to more than 40 DNA substrates of varying length and structure. Neither RecF nor the RecFR complex exhibited specific DNA binding that can explain the targeting of RecF(R) to post-replication gaps. RecF(R) bound to dsDNA and ssDNA of sufficient length with similar facility. DNA binding was highly ATP-dependent. Most measured Kd values fell into a range of 60-180 nM. The addition of ssDNA extensions on duplex substrates to mimic gap ends or CPD lesions produces only subtle increases or decreases in RecF(R) affinity. Significant RecFR binding cooperativity was evident with many DNA substrates. The results indicate that RecF or RecFR targeting to post-replication gaps must rely on factors not yet identified, perhaps involving interactions with additional proteins.


Figures

Graphical Abstract
Graphical Abstract
RecF or RecFR bind to all DNA structures with low nM affinity, with no specificity for gap ends.
Figure 1.
Figure 1.
RecF binding to 20mer substrates; ATP dependence. Binding to 20 mer ssDNA (square) and dsDNA (circle) harboring a 5′ FAM label was tested by fluorescence anisotropy. RecF binding was tested alone (grey), or in the presence of 3 mM ATP (red), or in the presence of 3 mM ATP and 5 μM RecR (blue). The values plotted represent the mean of reactions carried out in triplicate and the standard deviation obtained for each RecF concentration. The curves indicate the Hill slope binding model fit obtained for each condition.
Figure 2.
Figure 2.
RecF binding to dsDNA; length effect. RecF binding to 20 (filled circle, full line), 31 (half-moon, dashed line) and 40 mer (empty circle, dotted line) dsDNA FAM labeled on one 5′ end was tested by fluorescence anisotropy. Binding was tested in the presence of 3 mM ATP (red), or in presence of 3 mM ATP combined to 5 μM of RecR (blue). The values represent the mean of reactions carried out in triplicate and the standard deviation obtained for each RecF concentration. The curves represent the Hill slope binding model obtained for each condition. For the 20mer, the values used in the graph were the same as presented in Figure 1. They are provided for ease of comparison and are depicted with 50% transparency.
Figure 3.
Figure 3.
RecF binding to ssDNA(s); length effect. The RecF binding to ssDNA varying in length was tested by fluorescence anisotropy. The values represent the mean of reactions carried out in triplicate and the standard deviation obtained for each RecF concentration. The curves represent the Hill slope binding model obtained for each condition. (A) RecF binding to 20 (filled square, solid line), 31 (half-filled square, dashed line) and 40mer (empty square, dotted line) ssDNA FAM labeled on the 5′ end was tested was tested either in the absence (grey) or in presence of 3 mM ATP (red). For the 20mer, the values used were the same in Figure 1 and are presented with 50% transparency. (B) RecF binding to 50mer ssDNA substrates non phosphorylated (open square, solid line), 5′ phosphorylated (half-filled square, dashed line) and circularized (filled square, dotted line) was tested in absence of co-factors (grey), in presence of 3 mM ATP (red) or in presence of 3 mM ATP and 5 μM of RecR (black).
Figure 4.
Figure 4.
Effect of DNA end FAM labels. RecF bnding to 20mer DNA substrates presenting variation in their FAM labelling orientation was tested by fluorescence anisotropy. The values plotted represent the mean of reactions carried out in triplicate and the standard deviation obtained for each RecF concentration. The curves represent the Hill slope binding model obtained for each condition. (A) RecF binding to 3FAM ssDNA (empty square), or dsDNA (empty circle) was tested in absence (grey), or in presence of 3 mM ATP (red). (B) RecF binding to dsDNA substrate presenting several ends FAM labelled, i.e. 2 × 5FAM (filled square; solid line), 2 × 3FAM (open square, dashed line), two FAM labels on the same DNA end called 5 + 3FAM (open triangle, dotted line) and 2 FAM labels on both ends (filled triangles; dotted line) were carried out in the presence of 3 mM ATP. Binding curves of multiple labeled DNA are compared to the curves previously obtained for the singly labeled versions (from Figures 1 and 4A) presented with 50% transparency.
Figure 5.
Figure 5.
Effect of ssDNA extensions on RecF binding. Binding to dsDNA substrates with a ssDNA extension composed of 12T on the 5′ or 3′ end, as well as variation in their FAM labelling orientation, was tested by fluorescence anisotropy in the presence of (A) 3 mM ATP or (B) 3 mM ATP and 5 μM RecR. The values represent the mean of reactions carried out in triplicate and the standard deviation obtained for each RecF concentration. The curves represent the Hill slope binding model obtained for each condition. (A) RecF binding to 20mer ds with a 5′ extension is represented as down triangle (solid for 5FAM and open for 3FAM) while binding to 20mer dsDNA with a 3′ extension is represented as top triangle (solid for 5FAM and open for 3FAM). (B) RecF binding to a 20mer (filled triangles; solid lines) and 31mer dsDNA (half-filled circle; dashed lines) without or with either a 5′ or 3 'extension as indicated in the schematic.
Figure 6.
Figure 6.
Effect of ssDNA extensions on the RecF ATPase. The ATPase activity of RecF (2.5 μM) was tested in presence of 31mer dsDNA with or without a 5′ or 3′ extension (ext). When indicated, 5 μM of RecR was added to the reactions. The top panel (A) represents the average traces of reactions carried out in triplicate for the ATP hydrolyzed as function of time and the bottom panel (B) provides average rates obtained for each condition with individual values of the triplicate appearing as dots.
Figure 7.
Figure 7.
RecF and RecFR do not exhibit stronger affinity for DNA substrates containing a CPD lesion. The RecF binding to DNA substrates presenting thymine dimer was tested in presence of 3 mM of ATP alone (red) or in combination with 5 μM RecR protein (blue). The binding was tested for a 31mer dsDNA in which a thymine dimer is in the middle of the sequence (filled circles, solid lines), called 31mer ds CPD and for its variation in which the thymine dimers is present in the 15 nucleotides 5′ extension ssDNA flanking a 16 bp dsDNA region (filled triangles, dotted lines), called 31mer CPD lesion. The binding curves to CPD substrates were compared to the value previously obtained for the 31mer dsDNA (Figure 2), represented here with 50% transparency (half-filled circle, dashed lines).
Figure 8.
Figure 8.
RecF binding to gapped DNA with or without unpaired ssDNA extensions. The RecF binding to DNA substrates presenting a single strand gap with or without an additional 5′ or 3′ extension facing the gap (but not complementary to it), was tested by fluorescence anisotropy in presence of 3mM ATP alone (red) or in combination with 5μM of RecR (blue). The values plotted represent the mean of a triplicate and the standard deviation obtained for each RecF concentration. The curves represent the Hill slope binding model obtained for each condition. (A) The graph represents the binding curves obtained for the RecF binding to a single strand gap formed in between two hairpins and its two modified versions with either with a 5′ or 3′ unpaired ssDNA extension. (B) Binding curves obtained for the RecF binding to circular single strand gaps of 30T internally FAM labeled with a 20 bp dsDNA region and its two modified versions with either with a 5′ or 3′ unpaired ssDNA extension.

References

    1. Rudolph C.J., Upton A.L., Lloyd R.G., Rudolph C.J., Upton A.L., Lloyd R.G.. Replication fork stalling and cell cycle arrest in UV-irradiated Escherichia coli. Genes Dev. 2007; 21:669–681. - PMC - PubMed
    1. Bhattacharyya B., George N.P., Thurmes T.M., Zhou R., Jani N., Wessel S.R., Sandler S.J., Ha T., Keck J.L.. Structural mechanisms of PriA-mediated DNA replication restart. Proc. Natl. Acad. Sci. U.S.A. 2014; 111:1373–1378. - PMC - PubMed
    1. Fu D., Calvo J., Samson L.D.. Balancing repair and tolerance of DNA damage caused by alkylating agents. Nat. Rev. Cancer. 2012; 12:104–120. - PMC - PubMed
    1. Li Z., Zhang W., Chen Y., Guo W., Zhang J., Tang H., Xu Z., Zhang H., Tao Y., Wang F.et al. .. Impaired DNA double-strand break repair contributes to the age-associated rise of genomic instability in humans. Cell Death Differ. 2016; 23:1765–1777. - PMC - PubMed
    1. Xia J., Chiu L.Y., Nehring R.B., Bravo Núñez M.A., Mei Q., Perez M., Zhai Y., Fitzgerald D.M., Pribis J.P., Wang Y.et al. .. Bacteria-to-human protein networks reveal origins of endogenous DNA damage. Cell. 2019; 176:127–143. - PMC - PubMed

Publication types

MeSH terms

LinkOut - more resources