. 2023 Jun 1;34(7):ar74.
doi: 10.1091/mbc.E22-11-0510. Epub 2023 Apr 26.

Megalin, cubilin, and Dab2 drive endocytic flux in kidney proximal tubule cells

Affiliations

Megalin, cubilin, and Dab2 drive endocytic flux in kidney proximal tubule cells

Youssef Rbaibi et al. Mol Biol Cell. .

Abstract

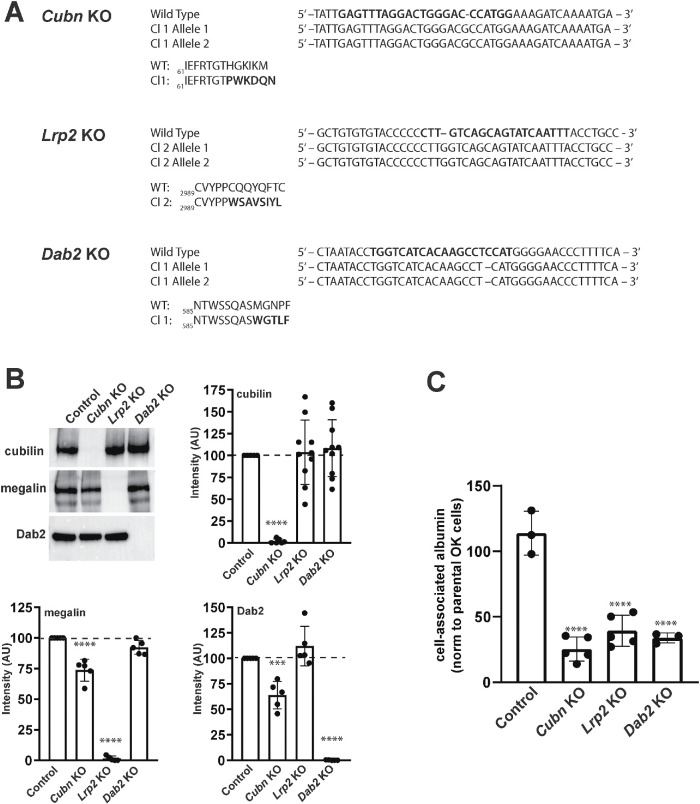
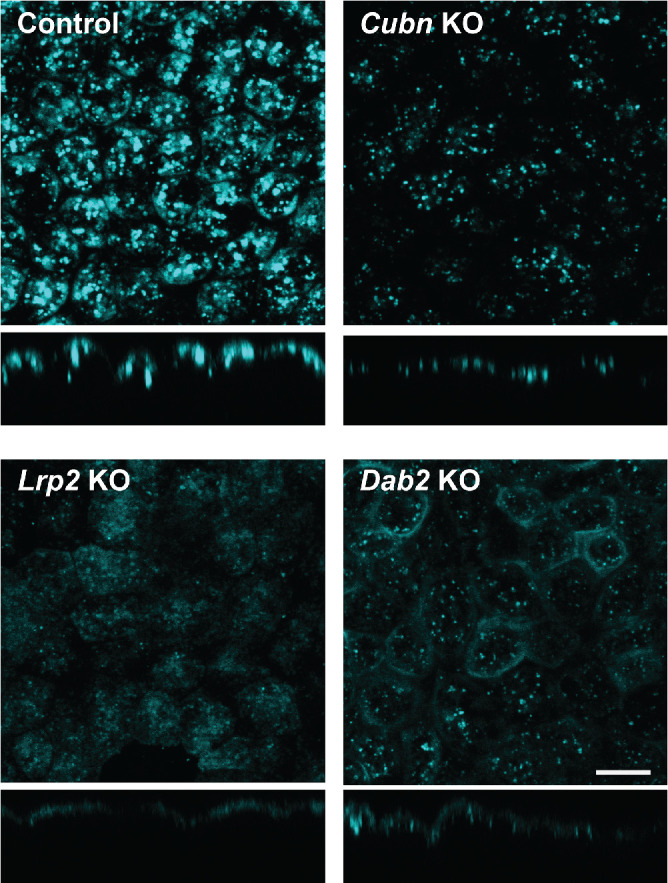
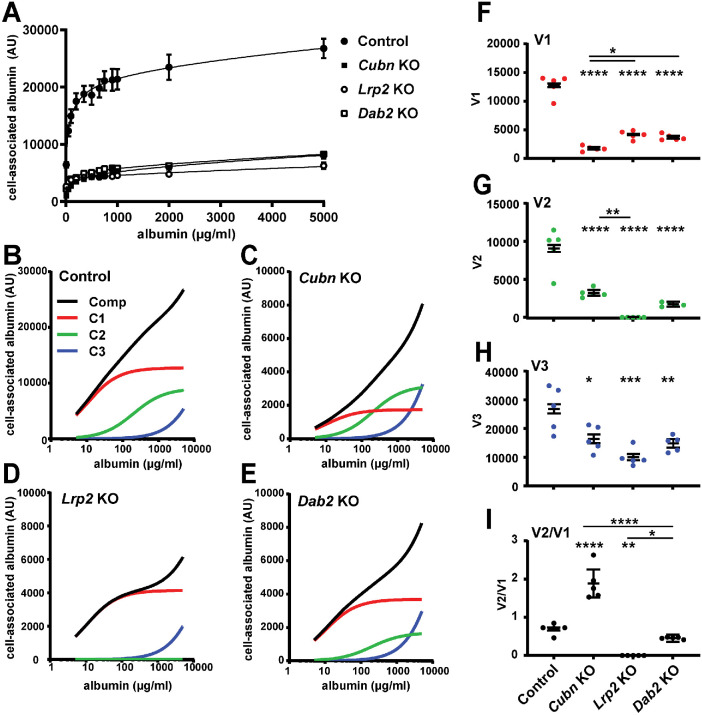
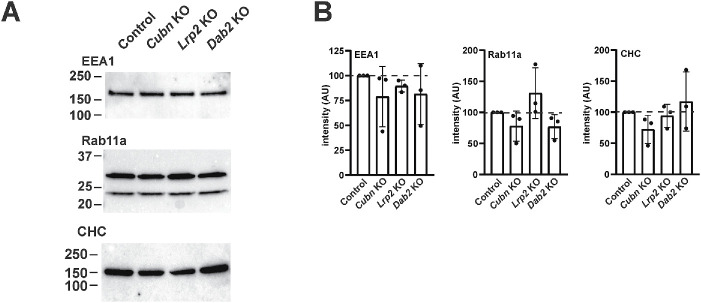
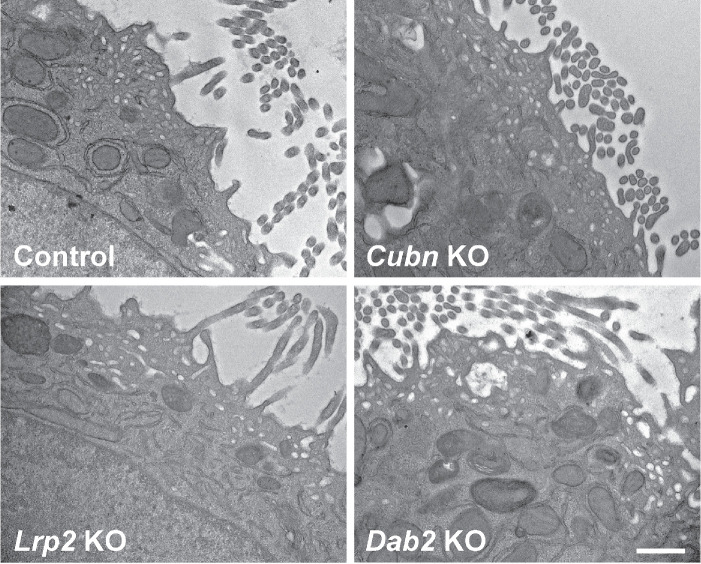
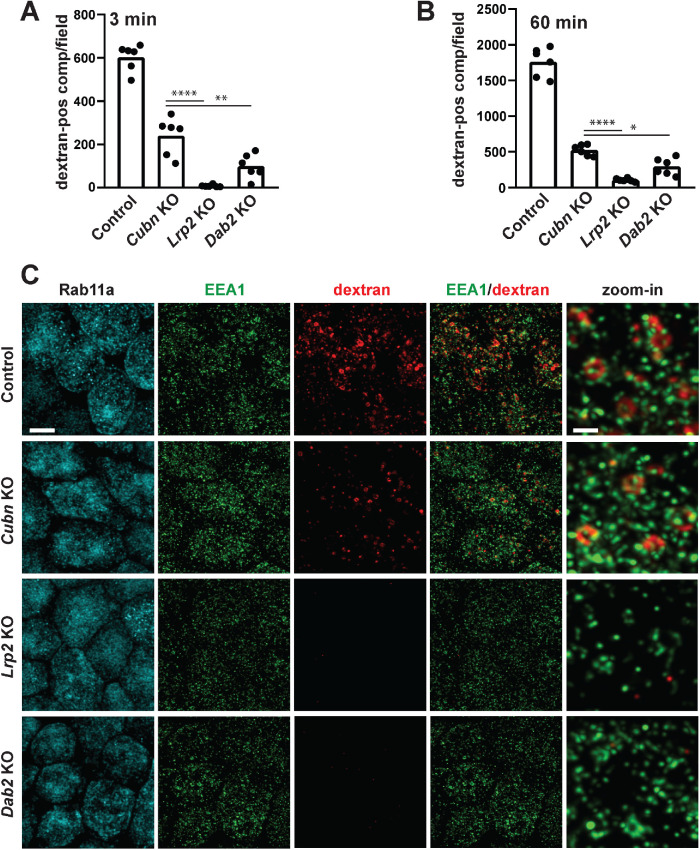
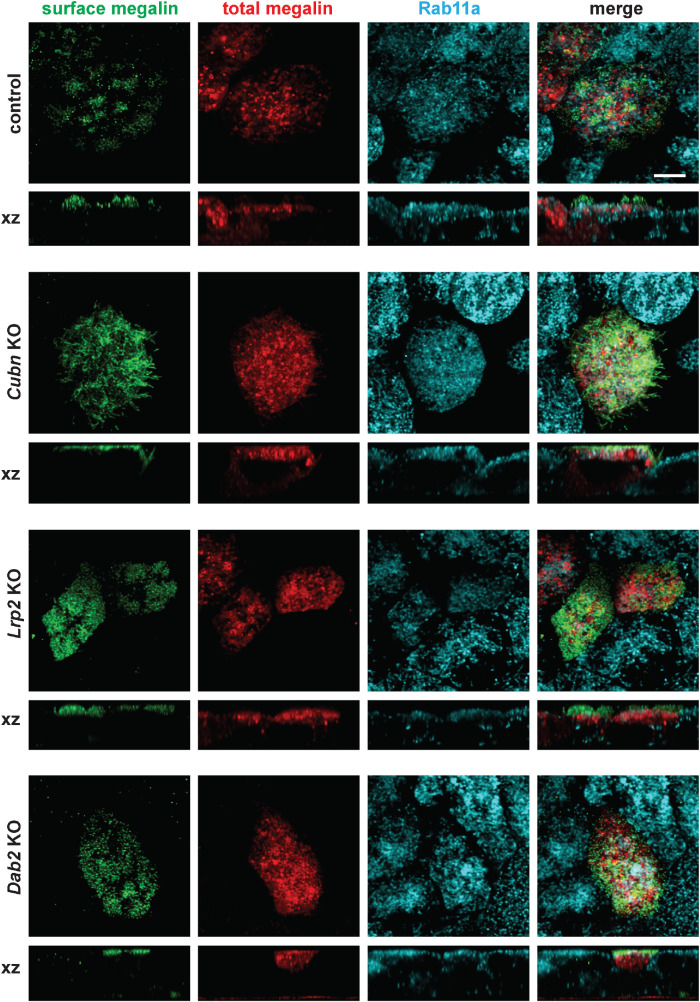
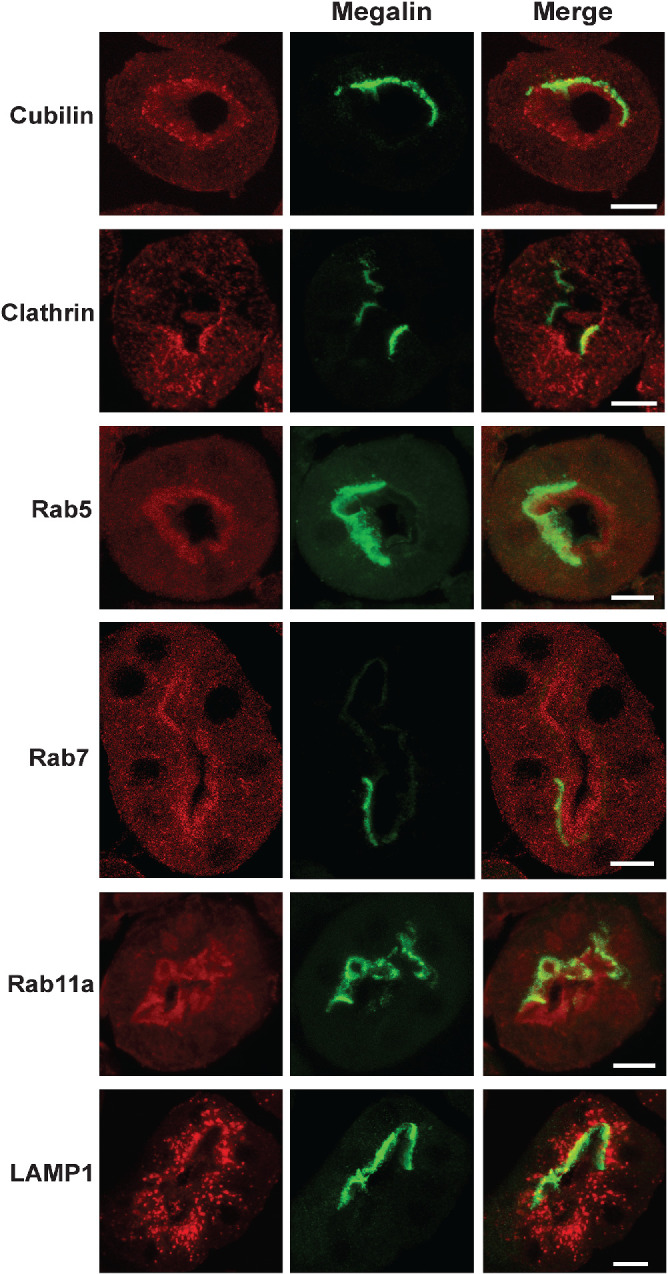
The kidney proximal tubule (PT) elaborates a uniquely high-capacity apical endocytic pathway to retrieve albumin and other proteins that escape the glomerular filtration barrier. Megalin and cubilin/amnionless (CUBAM) receptors engage Dab2 in these cells to mediate clathrin-dependent uptake of filtered ligands. Knockout of megalin or Dab2 profoundly inhibits apical endocytosis and is believed to atrophy the endocytic pathway. We generated CRISPR/Cas9 knockout (KO) clones lacking cubilin, megalin, or Dab2 expression in highly differentiated PT cells and determined the impact on albumin internalization and endocytic pathway function. KO of each component had different effects on the concentration dependence of albumin uptake as well its distribution within PT cells. Reduced uptake of a fluid phase marker was also observed, with megalin KO cells having the most dramatic decline. Surprisingly, protein levels and distribution of key endocytic proteins were preserved in KO PT cell lines and in megalin KO mice, despite the reduced endocytic activity. Our data highlight specific functions of megalin, cubilin, and Dab2 in apical endocytosis and demonstrate that these proteins drive endocytic flux without compromising the physical integrity of the apical endocytic pathway. Our studies suggest a novel model to explain how these components coordinate endocytic uptake in PT cells.


Figures

FIGURE 1:
FIGURE 1:
CRISPR/Cas9 knockout of Lrp2, Cubn, or Dab2 impairs OK cell endocytic uptake of albumin. (A) Allelic indel sequences for CRISPR/Cas9 Cubn KO, Lrp2 KO, and Dab2 KO clones relative to Control nucleotide and amino acid sequences are shown. (B) Equivalent amounts (15 µg) of cell lysates from control, Cubn KO, Lrp2 KO, and Dab2 KO clones were Western blotted with antibodies against cubilin, megalin, and Dab2. Representative blots are shown, along with quantitation of blots from at least three independent experiments with values normalized to intensities in control cells. ****p < 0.0001, ***p < 0.001, by one-way ANOVA relative to control. (C) Parental OK cells and control and KO clones were incubated for 30 min with apically added AlexaFluor-647 albumin and washed, and cell-associated fluorescence was quantified by spectrofluorimetry. Data from three to five independent experiments (mean ± SD, normalized to parental OK cells) are plotted. ****p ≤ 0.0001 by one-way ANOVA.
FIGURE 2:
FIGURE 2:
CRISPR/Cas9 KO cell lines exhibit different patterns of albumin binding and uptake. Control, Cubn KO, Lrp2 KO, and Dab2 KO cells were incubated with 50 µg/ml AlexaFluor-647 albumin for 15 min at 37°C and then fixed and visualized by confocal microscopy. Representative xz sections are shown below each panel. Scale bar: 10 µm.
FIGURE 3:
FIGURE 3:
CRISPR/Cas9 KO of cubilin, megalin, or Dab2 differentially affects concentration-dependent albumin uptake profiles. (A) CRISPR/Cas9 control, Cubn KO, Lrp2 KO, and Dab2 KO clones were incubated with the indicated concentrations of Alexa Fluor-647 albumin for 15 min and then washed, and cell-associated fluorescence was quantified. The mean ± SD of five experiments is plotted, together with the fitted curves for each condition. (B–E) Data from the experiments above were deconvolved and the composite line (Comp, black) and high-affinity (C1, red), low-affinity (C2, green), and nonsaturable (C3, blue) albumin uptake components were plotted on a semilog scale to better visualize the differential effects of Cubn KO on high-affinity albumin uptake (C1) and Lrp2 KO on low-affinity uptake (C2). The capacities of (F) high-affinity (V1), (G) low-affinity (V2,) and (H) nonsaturable (V3, extrapolated to uptake at 20 mg/ml albumin) pathways in each cell line are plotted. (I) The ratio of V2/V1 components is plotted to highlight the changes in albumin affinity profile between the different KO cell lines. The uncertainty of the mean was propagated from the uncertainties of the fitted parameters in each experiment. Asterisks above each condition denote significance vs control; asterisks above the horizontal lines denote significance between other pairs. *p < 0.05; **p < 0.01; ***p < 0.001; ****p < 0.0001 by one-way ANOVA with multiple comparisons.
FIGURE 4:
FIGURE 4:
Expression of endocytic pathway proteins in CRISPR/Cas9 KO clones. (A) Equivalent amounts (15 µg) of cell lysates from CRISPR/Cas9 control, Cubn KO, Lrp2 KO, and Dab2 KO clones were Western blotted with antibodies against CHC, EEA1, and Rab11a. Representative blots are shown, with the migration of molecular mass markers (in kDa) indicated on the left. The upper band in the Rab11a doublet corresponds to the predicted molecular mass. (B) Quantitation of blots from three independent experiments with values normalized to that of control cells is shown. There was no significant difference in protein expression between the four cell lines by two-way ANOVA.
FIGURE 5:
FIGURE 5:
Electron microscopy of CRISPR/Cas9 knockout clones. CRISPR/Cas9 control, Cubn KO, Lrp2 KO, and Dab2 KO clones cultured under orbital shear stress on permeable supports were fixed and processed for electron microscopy as described in Materials and Methods. Representative images are shown. Scale bar: 500 nm.
FIGURE 6:
FIGURE 6:
Reduced apical endocytic flux in CRISPR/Cas9 KO cells. CRISPR/Cas9 control, Cubn KO, Lrp2 KO, and Dab2 KO clones were incubated with apically added AlexaFluor-568 dextran for 3 min (A) or 60 min (B) and then fixed and imaged by confocal microscopy. Six randomly acquired fields of each sample were quantified as described in Materials and Methods to determine the number of early or total dextran-positive compartments. All samples were significantly different from controls by one-way ANOVA with Tukey’s multiple comparisons test (p < 0.0001). Other comparisons that were statistically significant using this analysis are noted by the horizontal bars (*p < 0.05, **p < 0.01, ****p < 0.0001). (C) CRISPR/Cas9 control, Cubn KO, Lrp2 KO, and Dab2 KO clones were incubated with apically added AlexaFluor-568 dextran for 3 min and then fixed and processed to detect EEA1 and Rab11a. Representative confocal images for each fluorophore are shown, as well as merged and zoomed-in images of EEA1/dextran merged images. Note the rapid association of dextran-positive compartments with EEA1 and the formation of larger clusters as these endocytic compartments mature into larger vacuoles. Scale bar: 5 µm; 1 µm for zoom-ins.
FIGURE 7:
FIGURE 7:
A mini-megalin construct is primarily localized to subapical compartments in control and CRISPR/Cas9 Cubn KO, Lrp2 KO, and Dab2 KO cells. Cells were transfected with a construct encoding HA-minimegalin-mCherry. Cells were fixed and incubated on ice with anti-HA antibody to label cell surface megalin, then permeabilized and processed to detect Rab11a. Surface (anti-HA) and total (mCherry) megalin distributions in each cell line are shown. Note the discordance in surface vs. total staining patterns in all cells ,consistent with the preferential localization of megalin to intracellular compartments. Scale bar: 5 µm.
FIGURE 8:
FIGURE 8:
Apical endocytic pathway integrity in maintained in Lrp2 KO mice. EMX-Lrp2 KO mice were stained to detect megalin (green) and either cubilin, clathrin, Rab5, Rab11a, or LAMP1 (red). Individual and merged panels of tubules containing megalin-expressing and -nonexpressing cells are shown. Scale bars: 10 µm. Note the similar staining of all markers in megalin-expressing vs. -nonexpressing cells.

References

    1. Amsellem S, Gburek J, Hamard G, Nielsen R, Willnow TE, Devuyst O, Nexo E, Verroust PJ, Christensen EI, Kozyraki R (2010). Cubilin is essential for albumin reabsorption in the renal proximal tubule. J Am Soc Nephrol 21, 1859–1867. - PMC - PubMed
    1. Beenken A, Cerutti G, Barasch J, Guo Y, Sheng Z, Erdjument-Bromage H, Aziz Z, Robbins-Juarez SY, Chavez EY, Ahlsen G, et al. (2023). Structures of LRP2 reveal a molecular machine for endocytosis. Cell 186, 821–836.e13. - PMC - PubMed
    1. Buss F, Arden SD, Lindsay M, Luzio JP, Kendrick-Jones J (2001). Myosin VI isoform localized to clathrin-coated vesicles with a role in clathrin-mediated endocytosis. EMBO J 20, 3676–3684. - PMC - PubMed
    1. Christensen EI, Birn H, Storm T, Weyer K, Nielsen R (2012). Endocytic receptors in the renal proximal tubule. Physiology (Bethesda) 27, 223–236. - PubMed
    1. Cui S, Guerriero CJ, Szalinski CM, Kinlough CL, Hughey RP, Weisz OA (2010). OCRL1 function in renal epithelial membrane traffic. Am J Physiol Renal Physiol 298, F335–F345. - PMC - PubMed

Publication types

MeSH terms

Substances

LinkOut - more resources