. 2023 May 1;19(5):e1011371.
doi: 10.1371/journal.ppat.1011371. eCollection 2023 May.

Senecavirus A-induced glycolysis facilitates virus replication by promoting lactate production that attenuates the interaction between MAVS and RIG-I

Affiliations

Senecavirus A-induced glycolysis facilitates virus replication by promoting lactate production that attenuates the interaction between MAVS and RIG-I

Huizi Li et al. PLoS Pathog. .

Abstract

Senecavirus A (SVA)-induced porcine idiopathic vesicular disease has caused huge economic losses worldwide. Glucose metabolism in the host cell is essential for SVA proliferation; however, the impact of the virus on glucose metabolism in host cells and the subsequent effects are still unknown. Here, glycolysis induced by SVA is shown to facilitate virus replication by promoting lactate production, which then attenuates the interaction between the mitochondrial antiviral-signaling protein (MAVS) and retinoic acid-inducible gene I (RIG-I). SVA induces glycolysis in PK-15 cells, as indicated by significantly increased expression of hexokinase 2 (HK2), 6-phosphofructokinase (PFKM), pyruvate kinase M (PKM), phosphoglycerate kinase 1 (PGK1), hypoxia-inducible factor-1 alpha (HIF-1α), and superoxide dismutase-2 (SOD2) in a dose-and replication-dependent manner, and enhanced lactate production, while reducing ATP generation. Overexpression of PKM, PGK1, HIF-1α, and PDK3 in PK-15 cells and high glucose concentrations promote SVA replication, while glycolytic inhibitors decrease it. Inhibition of RLR signaling allowed better replication of SVA by promoting lactate production to attenuate the interaction between MAVS and RIG-I, and regulatory effect of glycolysis on replication of SVA was mainly via RIG-I signaling. SVA infection in mice increased expression of PKM and PGK1 in tissues and serum yields of lactate. Mice treated with high glucose and administered sodium lactate showed elevated lactate levels and better SVA replication, as well as suppressed induction of RIG-I, interferon beta (IFNβ), IFNα, interferon-stimulated gene 15 (ISG15), and interleukin 6 (IL-6). The inhibitory effect on interferons was lower in mice administered sodium oxamate and low glucose compared to the high glucose, indicating that RLR signaling was inhibited by SVA infection through lactate in vitro and in vivo. These results provide a new perspective on the relationship between metabolism and innate immunity of the host in SVA infection, suggesting that glycolysis or lactate may be new targets against the virus.


Conflict of interest statement

The authors declare that they have no conflict of interest.

Figures

Fig 1
Fig 1. SVA infection induces glycolysis in PK-15 cells.
(A, B) PK-15 cells were infected with SVA at an MOI of 1. Cell lysates were collected at 48 h.p.i. and the lactate and intracellular ATP levels were measured. (C) PK-15 cells were mock infected or infected with Heat-SVA and SVA at MOIs of 0.1 or 1. Cells were harvested at 48 h.p.i. The mRNA expression of HK2, PFKM, PGK1, PKM, HIF-1α, and SOD2 was analyzed by qRT-PCR. (D) Cells were infected with SVA at an MOI of 1 and lysed in RIPA buffer at 48 h.p.i. The expression levels of PGK1, PKM, and VP2 were analyzed by western blot. (E) The grayscale analysis of PGK1, PKM, and VP2 protein. All data represent the means ± SD (Student’s t test) (*P < 0.05, **P < 0.01, ns, not significant).
Fig 2
Fig 2. Enhanced glycolysis promotes replication of SVA.
PK-15 cells were transfected with pEGFP-PDK3, pEGFP-PGK1, pEGFP-PKM, pEGFP-HIF-1α or co-transfected with all four vectors. Cells were infected with SVA at an MOI of 1. (A-E) The RNA of the cells was harvested and extracted at 6, 12 or 24 h.p.i, and intracellular mRNA levels of the SVA VP2 gene were analyzed by qRT-PCR. β-actin expression was used as an internal control. (F) Virus titers in PK-15 cells were detected using the Reed–Muench method. All data represent the means ± SD (Student’s t test) (*P < 0.05, **P < 0.01, ns, not significant).
Fig 3
Fig 3. Inhibition of glycolysis inhibits replication of SVA.
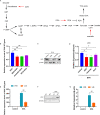
(A) Schematic overview of glucose metabolism and the functional targets of glycolytic inhibitors (2DG, oxamate, and DCA) used in this study. (B) PK-15 cells were infected with SVA at an MOI of 1, incubated in the presence or absence of glycolytic inhibitors, and intracellular mRNA levels of the SVA VP2 gene were analyzed by qRT-PCR at 48 h.p.i. (C) Cells were infected with SVA at an MOI of 1, incubated in the presence or absence of glycolytic inhibitors, and lysed with RIPA at 48 h.p.i. The VP2 protein levels were detected by western blot. (D) The grayscale analysis of the VP2 protein. (E) PK-15 cells were infected with SVA at an MOI of 1, incubated in high (25 mM) or low (5 mM) glucose, and intracellular mRNA levels of SVA VP2 gene were measured by qRT-PCR. (F) Cells were infected with SVA at an MOI of 1, incubated in high (25 mM) or low (5 mM) glucose and lysed with RIPA at 48 h.p.i. VP2 protein levels were determined by western blot. (G) The grayscale analysis of VP2 protein. All data represent the means ± SD (Student’s t test) (*P < 0.05, **P < 0.01, ns, not significant).
Fig 4
Fig 4. Glycolysis induced by SVA infection inhibits RLR signaling.
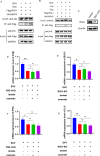
(A-F) PK-15 cells were mock infected or infected with SVA at an MOI of 1 and incubated in the presence or absence of 2DG, DCA, or oxamate. Cells were harvested at 48 h.p.i. The mRNA expression of RIG-I, IFNβ, IFNα, IFIT1, IL-6, and ISG-15 were analyzed by qRT-PCR. (G-L) PK-15 cells were treated with high (25 mM) or low (5 mM) glucose and infected with SVA at an MOI of 1. Cells were harvested at 48 h.p.i. The mRNA expression of RIG-I, IFNβ, IFNα, IFIT1, IL-6, and ISG-15 were analyzed by qRT-PCR. β-actin expression was used as an internal control. All data represent the means ± SD (Student’s t test) (*P < 0.05, **P < 0.01, ns, not significant).
Fig 5
Fig 5. Lactate produced by SVA-induced glycolysis inhibits RLR signaling.
(A-F) PK-15 cells were incubated in the presence or absence of sodium oxamate (10 or 25 mM), in the presence or absence of sodium lactate (5 or 10 mM), and with or without SVA infection at an MOI of 1. (A, B) The expression levels of the SVA VP2 gene were analyzed by qRT-PCR at 48 h.p.i. (C) The intracellular lactate levels were measured using lactate assay kits. (D) VP2 protein levels were measured by western blot. (E) The expression levels of the SVA VP2 gene were analyzed by qRT-PCR at 48 h.p.i. (F) Virus titers in PK-15 cells were detected using the Reed–Muench method. (G-L) The mRNA expression of RIG-I, IFNβ, IFNα, ISG-15, IL-6, and IFIT1 was analyzed by qRT-PCR. β-actin expression was used as an internal control. All data represent the means ± SD (Student’s t test) (*P < 0.05, **P < 0.01, ns, not significant).
Fig 6
Fig 6. Lactate produced by SVA infection inhibits RLR signaling mainly through RIG-I.
(A, B) Lactate inhibits RLR signaling by destabilizing the interaction between MAVS and RIG-I. (C) Expression levels of RIG-I in PK-15 cells and RIG-I-KO PK-15 cells. (D-F) The mRNA expression of IFNβ, ISG15, IFNα, and IL-6 was analyzed by qRT-PCR. All data represent the means ± SD (Student’s t test) (*P < 0.05, **P < 0.01, ns, not significant).
Fig 7
Fig 7. RLR signaling was inhibited by SVA through lactate in mice.
(A) Mice were orally challenged with SVA, treated with high (1.5 g/kg), low (0.2 g/kg), or no (control) glucose, and treated with or without sodium oxamate (750 mg/kg) or sodium lactate (1 g/kg). (B) At 7 d.p.i, the expression of the SVA VP2 gene in the heart, liver, spleen, duodenum, and kidney was analyzed by qRT-PCR. (C) At 7 d.p.i, the serum lactate was measured using lactate assay kits. (D) The expression of PGK1, PKM, and HIF-1α in mouse heart, liver, and spleen tissues was detected by western blot. (E) Grayscale analysis of detected proteins. (F-Q) The expression of the SVA VP2 gene, IFNβ, IFNα, ISG15, RIG-I, and IL-6 was analyzed by qRT-PCR. All data represent the means ± SD (Student’s t test) (*P < 0.05, **P < 0.01, ns, not significant).
Fig 8
Fig 8. Histopathological changes of heart, liver, spleen, kidney and duodenum in mice.
Fig 9
Fig 9. Schematic overview of SVA-induced glycolysis that facilitates virus replication by promoting lactate production, which attenuates the interaction between MAVS and RIG-I.

References

    1. Reddy PS, Burroughs KD, Hales LM, Ganesh S, Jones BH, Idamakanti N, et al.. Seneca Valley virus, a systemically deliverable oncolytic picornavirus, and the treatment of neuroendocrine cancers. J Natl Cancer Inst. 2007;99(21):1623–33. doi: 10.1093/jnci/djm198 . - DOI - PMC - PubMed
    1. Venkataraman S, Reddy SP, Loo J, Idamakanti N, Hallenbeck PL, Reddy VS. Structure of Seneca Valley Virus-001: an oncolytic picornavirus representing a new genus. Structure. 2008;16(10):1555–61. doi: 10.1016/j.str.2008.07.013 . - DOI - PMC - PubMed
    1. Baker KL, Mowrer C, Canon A, Linhares DC, Rademacher C, Karriker LA, et al.. Systematic Epidemiological Investigations of Cases of Senecavirus A in US Swine Breeding Herds. Transbound Emerg Dis. 2017;64(1):11–8. doi: 10.1111/tbed.12598 . - DOI - PubMed
    1. Leme RA, Zotti E, Alcantara BK, Oliveira MV, Freitas LA, Alfieri AF, et al.. Senecavirus A: An Emerging Vesicular Infection in Brazilian Pig Herds. Transbound Emerg Dis. 2015;62(6):603–11. doi: 10.1111/tbed.12430 . - DOI - PubMed
    1. Sun D, Vannucci F, Knutson TP, Corzo C, Marthaler DG. Emergence and whole-genome sequence of Senecavirus A in Colombia. Transbound Emerg Dis. 2017;64(5):1346–9. doi: 10.1111/tbed.12669 . - DOI - PubMed

Publication types

Supplementary concepts