. 2023 Apr 28;9(17):eadf9063.
doi: 10.1126/sciadv.adf9063. Epub 2023 Apr 26.

Monitoring AKT activity and targeting in live tissue and disease contexts using a real-time Akt-FRET biosensor mouse

Affiliations

Monitoring AKT activity and targeting in live tissue and disease contexts using a real-time Akt-FRET biosensor mouse

James R W Conway et al. Sci Adv. .

Abstract

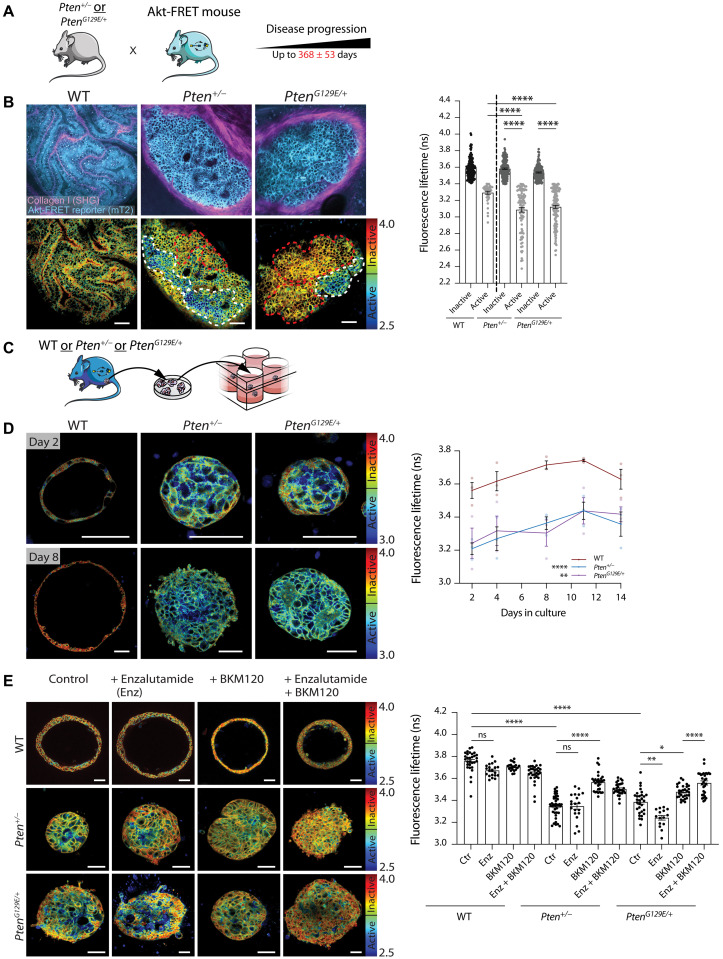
Aberrant AKT activation occurs in a number of cancers, metabolic syndrome, and immune disorders, making it an important target for the treatment of many diseases. To monitor spatial and temporal AKT activity in a live setting, we generated an Akt-FRET biosensor mouse that allows longitudinal assessment of AKT activity using intravital imaging in conjunction with image stabilization and optical window technology. We demonstrate the sensitivity of the Akt-FRET biosensor mouse using various cancer models and verify its suitability to monitor response to drug targeting in spheroid and organotypic models. We also show that the dynamics of AKT activation can be monitored in real time in diverse tissues, including in individual islets of the pancreas, in the brown and white adipose tissue, and in the skeletal muscle. Thus, the Akt-FRET biosensor mouse provides an important tool to study AKT dynamics in live tissue contexts and has broad preclinical applications.


Figures

Fig. 1.
Fig. 1.. Generation of the Akt-FRET biosensor mouse.
(A) Schematic of the Akt-FRET biosensor mouse crossed to various tissue-specific Cre-driver lines and disease models with latencies exceeding up to 400 days. The Eevee-Akt-FRET biosensor that gets phosphorylated by active AKT in the cells can be used in conjunction with optical imaging windows to monitor AKT activity in a spatiotemporally resolved manner in vivo. (B) Targeting of the Akt-FRET biosensor to the ROSA26 locus via recombinase-mediated cassette exchange (RMCE) via heterospecific FRT sites. (C) Schematic of the Eevee-Akt-FRET biosensor comprising mTurquoise2 (mT2) and YPet in its inactive (no FRET) and active (FRET) conformation upon phosphorylation of the substrate peptide by active AKT in cells. (D) Phase-contrast images of embryonic stem cell (ESC) colonies isolated from Akt-FRET biosensor mice cocultured with mouse embryonic fibroblasts (MEFs), before and after EGF stimulation, with corresponding intensity images (mTurquoise2, cyan) and FLIM images. n = 23 to 33 colonies per condition. Results are means ± SEM. P value was determined using Welch’s t test, and significance is compared to untreated control colonies. Scale bars, 50 μm. ****P < 0.0001.
Fig. 2.
Fig. 2.. Suborgan-specific mapping of AKT activity in the pancreas and pancreatic islets as well as PDAC in the context of PTEN loss.
(A) Schematic of suborgan-specific expression of the Akt-FRET biosensor in cells of pancreatic lineage (Pdx1-Cre) or islets (RIP-Cre), showing Akt-FRET biosensor (mTurquoise2, cyan) and second-harmonic generation (SHG; magenta) with corresponding representative intensity-merged maps of mTurquoise2 fluorescence lifetime. n = 2 to 4 mice with six to eight images per islets and 136 cells in total quantified. Results are means ± SEM. (B to E) Increasing AKT activity in KRasG12D-driven (B and C) and KRasG12D + p53R172H–driven (D and E) PanINs and PDAC upon heterozygous loss of Pten as imaged ex vivo. n = 4 to 10 mice per condition and 1460 cells in total quantified. Results are means ± SEM. P values were determined using an ordinary two-way ANOVA with Šídák’s correction for multiple comparisons, and significance is compared to Pten “+/+” mice. Scale bars, 50 μm. ns (not significant), P > 0.05, *P < 0.05, **P < 0.01, and ***P < 0.001.
Fig. 3.
Fig. 3.. Standard of care nonsteroidal antiandrogen therapy enhances AKT signaling in PtenG129E mutant prostate cancer and can be combatted by BKM120 inhibition.
(A) Schematic of crossing the Akt-FRET biosensor mouse to whole-body Pten+/− or PtenG129E/+ mutant mice and indicated latency to disease progression of 368 ± 53 days. (B) Increasing AKT activity in locally restricted zones of prostate cancers following heterozygous PTEN loss (Pten+/−) and mutant PTEN expression (PtenG129E/+). n = 6 mice per genotype, 780 cells in total analyzed (white dotted lines: AKT active cells, red dotted lines: AKT inactive cells, cutoff value for activity at 3.4 ns). Results are means ± SEM. P values were determined using Brown-Forsythe and Welch ANOVA tests for multiple comparisons, and significance is compared to WT prostate active population and Pten+/− and PtenG129E/+ inactive populations, respectively. (C) Isolation schematic of prostate cancer spheroids and culture in Matrigel. (D) Prostate spheroids cultured for up to 14 days with representative images on days 2 and 8 showing maintained increased AKT activity in Pten+/− and PtenG129E/+ spheroids. n = 3 spheroids per condition per time point, 1274 cells in total. Results are means ± SEM. P values were determined using repeated-measures one-way ANOVA with a Geisser-Greenhouse and Dunnett correction for multiple comparisons, and significance is compared to WT spheroids. (E) Treatment of prostate cancer spheroids with enzalutamide (Enz) shows enhanced AKT activation in PtenG129E/+ spheroids. AKT activity is effectively inhibited with BKM120 alone and in combination with enzalutamide. n = 1 to 3 spheroids per condition, 325 cells in total analyzed. Results are means ± SEM. P values were determined using Brown-Forsythe and Welch ANOVA with Dunnett correction for multiple comparisons, and significance is compared to the respective groups indicated in the graph. Scale bars, 50 μm. ns, P > 0.05, *P < 0.05, **P < 0.01, and ****P < 0.0001.
Fig. 4.
Fig. 4.. AKT activity is elevated in mutant PtenG129E/+–driven mammary carcinomas and effectively inhibited by BKM120 treatment in 3D invasion assays.
(A) AKT activity in cell populations of Pten+/−- and mutant PtenG129E/+–driven mammary carcinomas compared to the WT mammary gland. n = 3 to 4 mice per genotype, 335 cells quantified (white dotted lines: AKT active cells, red dotted lines: AKT inactive cells, cutoff value for activity at 3.4 ns). Results are means ± SEM. P values were determined using Brown-Forsythe and Welch ANOVA tests for multiple comparisons, and significance is compared to WT mammary gland active population and the PtenG129E/+ inactive population. Scale bars, 50 μm. (B) Schematic of cell line isolation from primary mammary tumors and setup of 3D organotypic invasion assays. (C) Treatment of a mutant PtenG129E/+ cell line invading on organotypic matrices with BKM120 and rapamycin with corresponding quantifications of AKT activity. n = 3, 333 cells quantified. Results are means ± SEM. P values were determined using ordinary one-way ANOVA. Scale bars, 50 μm. (D) Breakdown of AKT activity in cell populations on top of the matrices or invaded ± treatment with BKM120 [data from (C)]. Results are means ± SEM. P values were determined using ordinary one-way ANOVA, and significance is compared to untreated controls. (E) Representative images of phospho-NDRG1 (pNDRG1) and Ki67 staining performed on a PtenG129E/+ cell line invading on organotypic matrices ± BKM120; rapamycin quantified in (F) and (G). n = 3 per cell line. (H) Normalized invasion index of mutant PtenG129E cells invading on organotypic matrices ± BKM120. n = 3 per treatment condition. Results are means ± SEM. P values were determined using Welch’s t test, and significance is compared to untreated controls. Scale bars, 50 μm. ns, P > 0.05, *P < 0.05, **P < 0.01, ***P < 0.01, and ****P < 0.0001.
Fig. 5.
Fig. 5.. Monitoring of effective inhibition of elevated AKT activity in mutant PtenG129E/+–driven mammary carcinomas by BKM120 treatment in vivo.
(A) Schematic of implantation of optical imaging windows over developed primary mutant PtenG129E/+–driven mammary carcinomas, treatment with BKM120, and imaging time intervals after treatment. (B) Time course of BKM120 treatment (30 mg/kg) imaged through optical imaging windows in primary mammary carcinomas, quantifying AKT activity at 0, 2, 4, 6, and 24 hours after treatment. n = 3 to 4 mice per time point, 609 cells in total quantified. Results are means ± SEM. P values were determined using ordinary one-way ANOVA with Dunnett correction for multiple comparisons, and significance is compared to 0-hour time point. Scale bars, 50 μm. ns, P > 0.05, *P < 0.05, and **P < 0.01.
Fig. 6.
Fig. 6.. Stimulation of islets of the pancreas with glucose, and of fatty tissues and muscles of the hindleg with insulin, results in spatiotemporal AKT activation in vivo.
(A) Surgical implantation of optical imaging window over the native pancreas allows for the monitoring of AKT activity in pancreatic islets of RIP-Cre;Akt-FRET mice. (B) Timeline of implantation of optical imaging window of the primary pancreas and subsequent in vivo imaging of glucose metabolism. (C) In vivo imaging of AKT activity in RIP-Cre;Akt-FRET mice following bolus administration of glucose (1 g/kg) via intraperitoneal injection showing active AKT after 5 min, 2 hours, and 6 hours. n = 2 mice, up to two to three islets imaged per time point, 322 cells quantified in total. Results are means ± SEM. P values were determined using an ordinary one-way ANOVA with Dunnett correction for multiple comparisons, and significance is compared to 0-min time point. (D and E) AKT activation visualized in BAT (D) and WAT (E) following intraperitoneal injection of insulin (1 IU/kg). n = 4 mice per tissue per time point, 214 cells quantified in total. Results are means ± SEM. P values were determined using a Welch’s t test, and significance is compared to 0-min time point. (F) AKT activation visualized ex vivo following stimulation with insulin (60 μU/ml) in the soleus, extensor digitorum longus (EDL), and tibialis anterior (TA) muscles. n = 3 to 5 mice per tissue. Results are means ± SEM. P values were determined using an unpaired t test, and significance is compared to untreated controls. Scale bars, 50 μm. ns, P > 0.05, *P < 0.05, **P < 0.01, and ***P < 0.001.
Fig. 7.
Fig. 7.. Schematic of spatiotemporal AKT activity mapping in several organ systems in vivo.
Optical window–mediated intravital assessment of metabolic and malignancy-mediated AKT signaling in a variety of organs including pancreas, adipose tissue, muscle, mammary, prostate, muscle, and tumor tissue. Scale bars, 50 μm.

References

    1. M. Whitman, D. R. Kaplan, B. Schaffhausen, L. Cantley, T. M. Roberts, Association of phosphatidylinositol kinase activity with polyoma middle-T competent for transformation. Nature 315, 239–242 (1985). - PubMed
    1. K. M. Nicholson, N. G. Anderson, The protein kinase B/Akt signalling pathway in human malignancy. Cell. Signal. 14, 381–395 (2002). - PubMed
    1. J. R. Conway, D. Herrmann, T. J. Evans, J. P. Morton, P. Timpson, Combating pancreatic cancer with PI3K pathway inhibitors in the era of personalised medicine. Gut 68, 742–758 (2019). - PMC - PubMed
    1. N. Komatsu, K. Aoki, M. Yamada, H. Yukinaga, Y. Fujita, Y. Kamioka, M. Matsuda, Development of an optimized backbone of FRET biosensors for kinases and GTPases. Mol. Biol. Cell 22, 4647–4656 (2011). - PMC - PubMed
    1. J. R. W. Conway, S. C. Warren, D. Herrmann, K. J. Murphy, A. S. Cazet, C. Vennin, R. F. Shearer, M. J. Killen, A. Magenau, P. Mélénec, M. Pinese, M. Nobis, A. Zaratzian, A. Boulghourjian, A. M. Da Silva, G. del Monte-Nieto, A. S. A. A. Adam, R. P. Harvey, J. J. Haigh, Y. Wang, D. R. Croucher, O. J. Sansom, M. Pajic, C. E. Caldon, J. P. Morton, P. Timpson, Intravital imaging to monitor therapeutic response in moving hypoxic regions resistant to PI3K pathway targeting in pancreatic cancer. Cell Rep. 23, 3312–3326 (2018). - PMC - PubMed

MeSH terms

Substances