. 2023 Apr 28;9(17):eadf5122.
doi: 10.1126/sciadv.adf5122. Epub 2023 Apr 26.

Bacterial catabolism of membrane phospholipids links marine biogeochemical cycles

Affiliations

Bacterial catabolism of membrane phospholipids links marine biogeochemical cycles

Linda M Westermann et al. Sci Adv. .

Abstract

In marine systems, the availability of inorganic phosphate can limit primary production leading to bacterial and phytoplankton utilization of the plethora of organic forms available. Among these are phospholipids that form the lipid bilayer of all cells as well as released extracellular vesicles. However, information on phospholipid degradation is almost nonexistent despite their relevance for biogeochemical cycling. Here, we identify complete catabolic pathways for the degradation of the common phospholipid headgroups phosphocholine (PC) and phosphorylethanolamine (PE) in marine bacteria. Using Phaeobacter sp. MED193 as a model, we provide genetic and biochemical evidence that extracellular hydrolysis of phospholipids liberates the nitrogen-containing substrates ethanolamine and choline. Transporters for ethanolamine (EtoX) and choline (BetT) are ubiquitous and highly expressed in the global ocean throughout the water column, highlighting the importance of phospholipid and especially PE catabolism in situ. Thus, catabolic activation of the ethanolamine and choline degradation pathways, subsequent to phospholipid metabolism, specifically links, and hence unites, the phosphorus, nitrogen, and carbon cycles.


Figures

Fig. 1.
Fig. 1.. Growth and lipid composition of Phaeobacter sp. MED193 when utilizing phospholipid headgroups as the sole P source.
(A) Growth (n = 3) of prestarved (48 hours) Phaeobacter sp. MED193 wild type on Pi, PE, PC, and no P (−P) as the sole source of P. Error bars denote SD of the mean. (B) Ratio of PtdGro to DGTS in culture samples taken during exponential growth. Error bars represent the SD of the mean. Statistical analyses were performed with one-way analysis of variance (ANOVA) by using three replicates. P values: not significant (ns) > 0.01, ***P < 0.001, ****P < 0.0001; F value, 110.1; degrees of freedom (DF), 8.
Fig. 2.
Fig. 2.. Enzyme kinetics of the PhoX phosphatase on phospholipid headgroups.
(A) Comparison of the mono- and diesterase activity of PhoXMED193 using pNPP as the monoester and pNPPC as the diester substrate, respectively. Enzyme kinetics of PhoXMED193 for (B) pNPP (Km: 97 ± 10.27 μM, Vmax: 191.4 ± 4.53 nmol min−1 mg−1), (C) PC (Km: 62.85 ± 11.27 μM, Vmax: 3.57 ± 0.16 nmol min−1 mg−1), and (D) PE (Km: 953.4 ± 139.6 μM, Vmax: 157.8 ± 6.60 nmol min−1 mg−1). Plots show reaction velocity (nmol min−1 mg−1) against differing substrate concentrations (mM). Lines show fitted Michaelis Menten curves for each substrate. Error bars denote SD of the mean (n = 3).
Fig. 3.
Fig. 3.. Growth of Phaeobacter sp. MED193 wild type, ΔphoX, and ΔphoB mutants on phospholipid headgroups.
Growth (n = 3) of prestarved (18 hours) Phaeobacter sp. MED193 wild type (WT), ΔphoB:Gm, and ΔphoX:Gm on low concentrations (50 μM) of (A) no P (−P control), (B) PC, (C) PE, and (D) Pi as the sole source of P. Error bars denote SD of the mean.
Fig. 4.
Fig. 4.. Proteomic response of prestarved Phaeobacter sp. MED193 cultures to addition of PC and PE.
Volcano plots show the comparison between cultures supplemented with (A) PC or (B) PE and the Pi control. Scatter points represent proteins. The x axis is the fold change for the ratio between growth conditions, and the y axis is the statistical P value. Green dots represent proteins that are significantly up-regulated in PC or PE growth conditions, whereas red dots represent those proteins that are significantly down-regulated.
Fig. 5.
Fig. 5.. Predicted choline and ethanolamine catabolic pathways in Phaeobacter sp. MED193.
(A) Schematic representation of the degradation pathways. (B and C) The genomic environment of genes involved in catabolism of (B) choline and (C) ethanolamine in Phaeobacter sp. MED193. TetR: transcriptional regulator (MED193_21666); BetT: choline transporter (MED193_21671), BetC: choline sulfatase (MED193_21676); BetB: betaine aldehyde dehydrogenase (MED193_21681); BetA: choline dehydrogenase (MED193_21686); ChoW: ABC-type transporter, permease component (MED193_07693); ChoV: ABC-type transporter, ATP-binding component (MED193_07698); ChoX: ABC-type transporter, betaine/carnitine/choline binding protein (MED193_07703); RpiR: RpiR regulator (MED193_10021); GGAH: γ-glutamylglycine amidohydrolase (MED193_10026), EtoV: TRAP transporter, small permease component (MED193_10031); EtoW: TRAP transporter, large permease component (MED193_10036); EtoX: TRAP transporter, ethanolamine binding protein (MED193_10041); ETAGA: ethanolamine γ-glutamylase (MED193_10046); GAADDH: Γ-glutamylacetyl-aldehydeamide dehydrogenase (MED193_10051); GETADH: γ-glutamylethanolamide dehydrogenase (MED193_10056); PstA: ABC transporter, permease component (MED193_04047); PstB: ABC-transporter, permease component (MED193_04052); PstC: ABC-transporter, ATP-binding component (MED193_04057); PstS: ABC-transporter, Pi-binding protein (MED193_04062). (D) MicroScale Thermophoresis analysis defining binding affinity of MED193_10041 to ethanolamine. Purified protein was mixed with serially diluted concentrations of ethanolamine and binding affinity measured. The x axis represents the logarithmic concentration of serially diluted ethanolamine (M); the y axis represents the normalized fluorescence (Fnorm). Binding affinity was calculated with Kd of 7.88 ± 1.88 μM. n = 3.
Fig. 6.
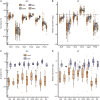
Fig. 6.. The abundance and distribution of substrate binding proteins in both metagenomes and metatranscriptomes of the Tara Oceans database.
Plots are shown as a function of sample depth (A and B) or oceanic sampling site (C and D). BetT and ChoX, choline; EtoX, ethanolamine; TmoX, trimethylamine N-oxide (TMAO); AepX, aminoethylphosphonate; PhnD, phosphonate. Metagenome (MG) abundance was calculated as a percentage of the median abundance of 10 prokaryotic single-copy marker genes (40), whereas metatranscriptome (MT) abundance was calculated as log2 transforms of transcript abundance normalized to the median abundance of the same 10 prokaryotic single-copy marker transcripts. DCM, deep chlorophyll maximum; MES, mesopelagic zone; MIX, mixed layer; SRF, surface water; MS, Mediterranean Sea; RS, Red Sea; NAO, North Atlantic Ocean; SAO, South Atlantic Ocean; IO, Indian Ocean; NPO, North Pacific Ocean; SPO, South Pacific Ocean; AO, Arctic Ocean; SO, Southern Ocean.

References

    1. D. M. Karl, K. M. Björkman, J. E. Dore, L. Fujieki, D. V. Hebel, T. Houlihan, R. M. Letelier, L. M. Tupas, Ecological nitrogen-to-phosphorus stoichiometry at station ALOHA. Deep Sea Res. Part II. 48, 1529–1566 (2001).
    1. W. K. W. Li, Annual average abundance of heterotrophic bacteria and Synechococcus in surface ocean waters. Limnol. Oceanogr. 43, 1746–1753 (1998).
    1. A. Buchan, G. R. LeCleir, C. A. Gulvik, J. M. González, Master recyclers: Features and functions of bacteria associated with phytoplankton blooms. Nat. Rev. Microbiol. 12, 686–698 (2014). - PubMed
    1. B. A. Biddanda, D. Dila, A. Weinke, J. Mancuso, M. Villar-Argaiz, J. M. Medina-Sánchez, J. M. González-Olalla, P. Carrillo, Housekeeping in the hydrosphere: Microbial cooking, cleaning, and control under stress. Life 11, 152 (2021). - PMC - PubMed
    1. F. Azam, T. Fenchel, J. G. Field, J. S. Gray, L. A. Meyer-Reil, F. Thingstad, The ecological role of water-column microbes in the Sea. Mar. Ecol. Prog. Ser. 10, 257–263 (1983).