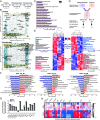
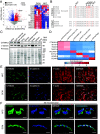
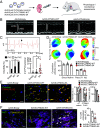
. 2023 May 9;120(19):e2212118120.
doi: 10.1073/pnas.2212118120. Epub 2023 May 1.

Proteomics and phosphoproteomics of failing human left ventricle identifies dilated cardiomyopathy-associated phosphorylation of CTNNA3

Affiliations

Proteomics and phosphoproteomics of failing human left ventricle identifies dilated cardiomyopathy-associated phosphorylation of CTNNA3

Cristine J Reitz et al. Proc Natl Acad Sci U S A. .

Abstract

The prognosis and treatment outcomes of heart failure (HF) patients rely heavily on disease etiology, yet the majority of underlying signaling mechanisms are complex and not fully elucidated. Phosphorylation is a major point of protein regulation with rapid and profound effects on the function and activity of protein networks. Currently, there is a lack of comprehensive proteomic and phosphoproteomic studies examining cardiac tissue from HF patients with either dilated dilated cardiomyopathy (DCM) or ischemic cardiomyopathy (ICM). Here, we used a combined proteomic and phosphoproteomic approach to identify and quantify more than 5,000 total proteins with greater than 13,000 corresponding phosphorylation sites across explanted left ventricle (LV) tissue samples, including HF patients with DCM vs. nonfailing controls (NFC), and left ventricular infarct vs. noninfarct, and periinfarct vs. noninfarct regions of HF patients with ICM. Each pair-wise comparison revealed unique global proteomic and phosphoproteomic profiles with both shared and etiology-specific perturbations. With this approach, we identified a DCM-associated hyperphosphorylation cluster in the cardiomyocyte intercalated disc (ICD) protein, αT-catenin (CTNNA3). We demonstrate using both ex vivo isolated cardiomyocytes and in vivo using an AAV9-mediated overexpression mouse model, that CTNNA3 phosphorylation at these residues plays a key role in maintaining protein localization at the cardiomyocyte ICD to regulate conductance and cell-cell adhesion. Collectively, this integrative proteomic/phosphoproteomic approach identifies region- and etiology-associated signaling pathways in human HF and describes a role for CTNNA3 phosphorylation in the pathophysiology of DCM.

Keywords: bioinformatics; heart failure; intercalated disc; phosphoproteomics; signaling.


Conflict of interest statement

The authors declare no competing interest.

Figures
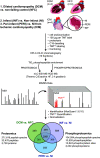
Fig. 1.
Fig. 1.
Overview of experimental workflow with a summary of proteomic and phosphoproteomic data with assigned PSMs and proteins identified. Left ventricular tissues from DCM patients with failing hearts vs. NFC and from infarct, periinfarct, and noninfarct regions sampled from each ICM patient with failing hearts were processed for LC-MS/MS and tagged with 10-plex TMT for relative quantification. Venn diagram depicts all identified proteins and phosphoproteins from each pairwise comparison.
Fig. 2.
Fig. 2.
Perturbed proteome and phosphoproteome in DCM patients and its region-specific manifestation in ICM patients. (A–C) Volcano and principal component analysis plots of the different etiology pairwise comparisons (A, DCM vs. NFC; B, infarct vs. noninfarct in ICM; C, periinfarct vs. noninfarct in ICM). Volcano plots show log-transformed values of proteins (closed circles) and phosphorylation sites (open circles) with differential expression (Student’s t test, < 0.05) between each pairwise comparison of pathological samples and related controls. Proteins/phosphorylation sites up- or down-regulated in pathology were colored red or blue, respectively. Broken lines in volcano plots represent a further permutation-based corrected P-value significance level (q < 0.05). Principal component analysis plots showed distinct clustering of patient sample groups resulting from merged protein and phosphorylation site quantitative information. (D) Overview of selected cardiac-relevant gene annotation distributions in the failing human LV from all (phospho)protein identifications found in at least one of the three pairwise datasets (DCM vs. NFC, infarct vs. noninfarct, and periinfarct vs. noninfarct). GO = gene ontology, BP = biological process, CC = cellular component, MF = molecular function. (E) Global view of hierarchical clustering and coverage comparisons of significantly (q-value < 0.05) over-represented gene annotations between each dataset.
Fig. 3.
Fig. 3.
Significantly altered protein expression and phosphorylation variance in HF according to patient disease. (A) Values denoting significantly (P-value < 0.05) altered proteins, phosphoproteins, and phosphorylation sites in DCM and infarct and Venn diagrams representing the overlap. (B) Differential expression and quantification of commonly identified proteins and phosphorylation sites, respectively, in DCM and infarct by visualizing the difference in means (against controls) of z-scored protein or phosphorylation site intensity values with its significance (P-value < 0.05) denoted in different colors: yellow (significantly altered in both ICM and DCM), light blue (significantly altered in INF alone), and light green (significantly altered in DCM alone). Zoomed panels provided in SI Appendix. (C) Bioinformatics analysis of potential kinases and/or binding partners based on the surrounding sequence of altered phosphorylation sites revealed the 10 most common kinase and/or binding partner substrate motifs detected among significant phosphoproteins in DCM and infarct. (D) Workflow combining the phosphoproteomes and proteomes to yield a merged DCM (phospho)proteome and infarct (phospho)proteome for subsequent gene annotation overrepresentation and gene set enrichment analyses. (E) Hierarchical clustering of z-score normalized intensities of proteins and phosphorylation sites with comparisons of gene sets significantly (q-value < 0.05) enriched in up-regulated proteins (in red) and down-regulated proteins (in blue) in DCM and infarct. Zoomed panels provided in SI Appendix. (F) Top 10 significantly (< 0.05) enriched gene ontology (GO) biological processes (Left), cellular components (Middle), and molecular functions (Right), following analysis of enriched gene annotations in DCM as compared to NFC. Top enriched pathways related to cardiac muscle cell–cell adhesion (in bold). (G) Cardiac muscle cell ICD normalized protein expression in DCM vs. NFC from proteomic data, *< 0.05. (H) Heat map of cardiac ICD protein phosphosites up-regulated (in red) and down-regulated (in blue) in DCM vs. NFC. Hierarchical clustering of these phosphosites is provided in SI Appendix.
Fig. 4.
Fig. 4.
Cardiomyocyte-enriched ICD protein, CTNNA3, is hyperphosphorylated in DCM. (A) Log-transformed P-values of proteins (closed circles) and phosphorylation sites (open circles) up-regulated (red) or down-regulated (blue) in DCM vs. NFC, with CTNNA3 protein and phosphorylation sites designated in black (left; volcano plot is replotted from Fig. 2A), and heat map of CTNNA3 phosphosites (right; expanded view of data from Fig. 3H) with proteins/phosphorylation sites up- or down-regulated in DCM colored red or blue, respectively. Numbers in brackets [e.g., S637 (2)] designate separate peptides used to quantify a particular phosphorylation site, wherein other additional phosphorylation sites were also present on the peptide. (B) Conservation of phosphosites across species between αT-catenin (CTNNA3) and αE-catenin (CTNNA1). Phosphosites are denoted in red, sites with significantly increased phosphorylation in human DCM hearts are bold and underlined. (C) Immunoblot analysis of CTNNA3 expression across mouse tissues demonstrated cardiac-enriched expression. (D) Analysis of an open-access single-cell RNA-seq dataset (GEO accession: GSE109816) from human heart tissue showed cardiac CTNNA3 expression is enriched in the cardiomyocyte. LV = left ventricle, LA = left atria. (E) Confocal imaging of CTNNA3, N-cadherin, and F-actin in human NFC and DCM heart tissue. (Scale bar, 20 µm.) (F) Three-dimensional reconstruction of CTNNA3 and N-cadherin localization at the ICD in cardiac tissue from NFC and DCM patients. (Scale bar, 5 µm.) Images are representative of n=3 independent biological replicates.
Fig. 5.
Fig. 5.
CTNNA3 phosphorylation regulates cardiomyocyte ICD organization and cell–cell adhesion. (A) Schematic of CTNNA3 mutant constructs: WT, 5-site phosphonull (5A), and 5-site phosphomimetic (5D). (B) Immunoblot analysis of lentivirus-mediated overexpression of FLAG-tagged CTNNA3 constructs in adult mouse cardiomyocytes. Asterisks indicate three protein bands observed in overexpressing cells based on molecular weight analyses. (C) Confocal imaging of adult mouse cardiomyocytes stained with CTNNA3 and FLAG 48 h postlentiviral transduction. (Scale bar, 20 µm.) (D) Line scan analysis of confocal images in C demonstrated peak expression at the ICDs in WT and 5D, with internalized CTNNA3 expression in 5A cells. (E) Quantification of CTNNA3-FLAG localization at the cardiomyocyte ICD as a percent of the total cell intensity. (F) Confocal imaging of N-cadherin in adult mouse cardiomyocytes 48 h postlentiviral transduction with CTNNA3-FLAG constructs showed (G) significant internalization of N-cadherin in 5A-expressing cells vs. control, WT, and 5D. (Scale bar, 20 µm.) (H) Cell–cell adhesion assay by mechanical disruption. Brightfield images of cell fragments (Left) and quantification (Right), corresponding to the number of macroscopic fragments counted after shaking. (Scale bar, 100 µm.) All images shown are representative of 40 to 60 cells captured per condition, from = 3 independent biological replicates.
Fig. 6.
Fig. 6.
In vivo overexpression of phosphonull CTNNA3 leads to left ventricular contractile dysfunction and electrical abnormalities. (A) Schematic illustration of mouse model of CTNNA3 phosphomutant overexpression. (B) Representative M-mode echocardiography recordings at 12 wk post-AAV9 injection. (C) Representative ECG recording of premature ventricular contraction (PVC; arrow) following isoproterenol administration. AAV9-CTNNA3-5A mice showed increased susceptibility to isoproterenol-induced PVCs over a continuous 30-min ECG recording following isoproterenol bolus (AAV9-Empty = 9, AAV9-CTNNA3-WT = 13, AAV9-CTNNA3-5A = 13). *< 0.05 by Fisher’s exact test (inducibility) or by one-way ANOVA and Tukey post hoc test (# of PVCs/animal). (D) Representative isochronal activation maps of optically mapped (di-4-ANEPPS) isolated hearts at sinus rhythm (Top) and paced at 11 Hz from the left ventricular free wall (Middle) showing time to activation of the ventricle from the site of stimulation. Average conduction velocities of hearts in sinus rhythm or paced from the left ventricular free wall showed conduction slowing in AAV9-CTNNA3-5A hearts under pacing (Bottom). = 6 hearts/group. *< 0.05 vs. all other groups, by one-way ANOVA and Tukey post hoc test. (E) Confocal imaging of mouse myocardium stained for total αT-catenin and CTNNA3-FLAG at 12 wk postinjection (Left) showed overexpression of total CTNNA3 and FLAG-tagged constructs (Middle), as well as internalization of the CTNNA3-5A protein (Right). (Scale bar, 20 µm.) *< 0.05 by one-way ANOVA and Tukey post hoc test. (F) Confocal imaging of connexin 43 (Cx43), F-actin, and CTNNA3-FLAG in the heart at 12 wk postinjection (Left) showed internalization/lateralization (arrowheads) of Cx43 signal and reduced colocalization with FLAG (Right) in AAV9-CTNNA3-5A myocardium. (Scale bar, 10 µm.) All images shown are representative of 10 fields of view per heart, from = 4 mice per group. See SI Appendix for individual channel images.
Fig. 7.
Fig. 7.
Remodeling of the ICD in AAV9-CTNNA3-5A hearts. (A) Representative transmission electron microscopy of the ICD in hearts from mice 12 wk post-AAV9 injection. Widening of the fascia adherens (arrowheads) was found in AAV9-CTNNA3-5A hearts. Images taken at 28,000× magnification. (Scale bar, 500 nm.) Confocal imaging of (B) N-cadherin, (C) β-catenin, and (D) plakophilin 2 (PKP2) in mouse myocardium at 12 wk post-AAV9 injection showed reduced percentage of the fluorescent signal at the ICD and colocalization with CTNNA3-FLAG by Pearson correlation coefficient (PCC). *< 0.05 by one-way ANOVA and Tukey post hoc test (% ICD) or by unpaired Student’s t test (PCC). (Scale bar, 10 µm.) All images shown are representative of 10 fields of view per heart, from = 4 mice per group. See SI Appendix for individual channel images. (E) Co-immunoprecipitation assays using FLAG (Left) and N-cadherin (Right) showed overexpression and pull-down of the CTNNA3-FLAG construct in both AAV9-CTNNA3-WT and AAV9-CTNNA3-5A hearts, and interaction with β-catenin, connexin 43 (Cx43), and N-cadherin. Images are representative of at least = 3 independent biological replicates.

References

    1. G. B. o. D. S. Collaborators, Global, regional, and national incidence, prevalence, and years lived with disability for 301 acute and chronic diseases and injuries in 188 countries, 1990 to 2013: A systematic analysis for the global burden of disease study 2013. Lancet 386, 743–800 (2015). - PMC - PubMed
    1. Benjamin E. J., et al. , Heart disease and stroke statistics-2017 update: A report from the american heart association. Circulation 135, e146–e603 (2017). - PMC - PubMed
    1. Cook C., Cole G., Asaria P., Jabbour R., Francis D. P., The annual global economic burden of heart failure. Int. J. Cardiol. 171, 368–376 (2014). - PubMed
    1. Ambrosy A. P., et al. , The global health and economic burden of hospitalizations for heart failure: Lessons learned from hospitalized heart failure registries. J. Am. Coll. Cardiol. 63, 1123–1133 (2014). - PubMed
    1. Gajanana D., et al. , Mortality in systolic heart failure revisited: Ischemic versus non-ischemic cardiomyopathy. Int. J. Cardiol. 224, 15–17 (2016). - PubMed

Publication types

Grants and funding