. 2023 May 9;120(19):e2221542120.
doi: 10.1073/pnas.2221542120. Epub 2023 May 1.

Application of a quantitative framework to improve the accuracy of a bacterial infection model

Affiliations

Application of a quantitative framework to improve the accuracy of a bacterial infection model

Gina R Lewin et al. Proc Natl Acad Sci U S A. .

Abstract

Laboratory models are critical to basic and translational microbiology research. Models serve multiple purposes, from providing tractable systems to study cell biology to allowing the investigation of inaccessible clinical and environmental ecosystems. Although there is a recognized need for improved model systems, there is a gap in rational approaches to accomplish this goal. We recently developed a framework for assessing the accuracy of microbial models by quantifying how closely each gene is expressed in the natural environment and in various models. The accuracy of the model is defined as the percentage of genes that are similarly expressed in the natural environment and the model. Here, we leverage this framework to develop and validate two generalizable approaches for improving model accuracy, and as proof of concept, we apply these approaches to improve models of Pseudomonas aeruginosa infecting the cystic fibrosis (CF) lung. First, we identify two models, an in vitro synthetic CF sputum medium model (SCFM2) and an epithelial cell model, that accurately recapitulate different gene sets. By combining these models, we developed the epithelial cell-SCFM2 model which improves the accuracy of over 500 genes. Second, to improve the accuracy of specific genes, we mined publicly available transcriptome data, which identified zinc limitation as a cue present in the CF lung and absent in SCFM2. Induction of zinc limitation in SCFM2 resulted in accurate expression of 90% of P. aeruginosa genes. These approaches provide generalizable, quantitative frameworks for microbiological model improvement that can be applied to any system of interest.

Keywords: Pseudomonas aeruginosa; calprotectin; cystic fibrosis; epithelial cell model; preclinical model.


Conflict of interest statement

The authors declare no competing interest.

Figures
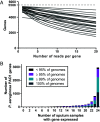
Fig. 1.
Fig. 1.
P. aeruginosa gene expression in human CF sputum metatranscriptomes. (A) Coverage of the P. aeruginosa PAO1 genome. Each line represents the depth of coverage for PAO1 genes for an individual human sputum metatranscriptome, demonstrating sufficient coverage for all metatranscriptomes used in this study. The dashed line shows the 5,586 total protein coding genes in the PAO1 genome. (B) PAO1 gene expression across the 24 human sputum metatranscriptomes, relative to their prevalence in the P. aeruginosa pangenome. The pangenome was built using 291 complete P. aeruginosa genomes. The 5,147 genes included in all downstream analyses include those present in at least 95% of the P. aeruginosa genomes and/or expressed in 95% (23 or 24) of the metatranscriptomes.
Fig. 2.
Fig. 2.
P. aeruginosa growth and epithelial cell integrity in the epiSCFM2 model. (A) Experimental timeline for epiSCFM2. (B) Epithelial integrity measurement in epiSCFM2 model over 8-hr time course, as assessed by TEER. N = 3. (CP. aeruginosa biofilm growth in epiSCFM2 over time. Apical, SCFM2 aggregates in airway lumen; epithelial, aggregates associated with CF airway epithelial cells at end of assay. N = 4. (D) Fluorescence imaging of bacterial aggregates in epiSCFM2. Blue, Hoechst staining of CF airway epithelial nuclei; purple, phalloidin staining of CF airway epithelial cell actin cytoskeleton; green, PAO1 P. aeruginosa expressing GFP. Representative images of 3 biological replicates are shown. (E) Distribution of P. aeruginosa aggregates in epiSCFM2. (Left) frequency distribution; (Right) % of total biomass for each aggregate size category. N = 3. Abbreviation: CFU = colony forming unit.
Fig. 3.
Fig. 3.
Increased accuracy by combining the airway epithelial model and SCFM2 to make epiSCFM2. (A) AS2 for each replicate of each model. Significant differences are shown using Kruskal-Wallis and Dunn’s Multiple Comparison Tests. (B) Venn diagram showing the shared and unique accurate genes in each model. (C) AS2 for TIGRFAM subcategories for P. aeruginosa PAO1 in SCFM2, the airway epithelial cell model, and epiSCFM2. The color in the middle represents the average AS2 across individual replicates for all PAO1 genes (those with and without TIGRFAM designations). The next level out from the middle of the circle contains TIGRFAM “meta roles”, the next contains TIGRFAM “main roles”, and the outer-most layer contains TIGRFAM “sub roles”. The area of each category is proportional to the number of genes in that category. See SI Appendix, Fig. S3 for plots P. aeruginosa gene expression in the apical supernatant and epithelial surface of epiSCFM2. (D) The average z-score for each gene in each condition is shown, and genes are colored based on the conditions in which they are accurate. Genes are considered accurate when their z-score is between −2 and 2. Annotations are shown for genes of interest.
Fig. 4.
Fig. 4.
Addition of calprotectin improves the accuracy of SCFM2. (A) Variance stabilizing transformation (VST)-normalized expression during growth in CF sputum, SCFM2, and low zinc (znuA mutant) for 10 genes previously identified using a supervised learning model as the most diagnostic for P. aeruginosa growth in humans (6, 23). Asterisks indicate genes with accurate gene expression during zinc-limitation (|z-score| < 2). (B) VST-normalized expression during growth in CF sputum, SCFM2, SCFM2-Mutant Calprotectin, and SCFM2-Calprotectin for 10 genes previously identified using a supervised learning model as the most diagnostic for P. aeruginosa growth in humans (6). Asterisks indicate genes with accurate gene expression in SCFM2-Calprotectin (|z-score| < 2). (C) AS2 for each replicate of each model. Significant differences are shown using Kruskal-Wallis and Dunn’s Multiple Comparison Tests. (D) Venn diagram showing the shared and unique accurate genes in each model. (E) The average z-score for each gene in SCFM2-Mutant Calprotectin and SCFM2-Calprotectin, demonstrating how the addition of metal-binding calprotectin alters the accuracy of PAO1 genes. Genes are considered accurate when their z-score is between −2 and 2. Genes are colored based on the conditions in which they are accurate, and annotations are shown for select genes. (F) AS2 for TIGRFAM subcategories for P. aeruginosa PAO1 in SCFM2, SCFM2-Mutant Calprotectin, and SCFM2-Calprotectin. The color in the middle represents the average AS2 across individual replicates for all PAO1 genes (those with and without TIGRFAM designations). The next level out from the middle of the circle contains TIGRFAM meta roles, the next contains TIGRFAM main roles, and the outer-most layer contains TIGRFAM sub roles. The area of each category is proportional to the number of genes in that category.
Fig. 5.
Fig. 5.
Elusive genes across 18 growth conditions and two strains. (A) Venn diagram showing the shared and unique inaccurate genes across SCFM2-Calprotectin and epiSCFM2 (7). (B) The mean VST-normalized expression of P. aeruginosa genes in human CF sputum and a range of experimental models for the 16 genes that are inaccurate in all conditions. The error bars for human CF sputum represent ± two SDs, which is the range considered accurate. Other SCFM2 modifications include SCFM1, use of Casamino acids instead of defined amino acids, addition of yeast extract, addition of hemin and removal of iron, addition of polymyxin B, and addition of vitamins. Other media includes MOPS-succinate and LB. Note that there are no data for rsmN for the strain P. aeruginosa LESB58-SED21 in SCFM2, MOPS-succinate, LB, or the mouse lung model, as this gene was not included in the analyses in ref. .

References

    1. Hanley J. G., Models and microbiology: Pasteur and the body. Can Bull Med. Hist 20, 419–435 (2003). - PubMed
    1. Masemann D., Ludwig S., Boergeling Y., Advances in transgenic mouse models to study infections by human pathogenic viruses. Int. J. Mol. Sci. 21, 9289 (2020). - PMC - PubMed
    1. Swearengen J. R., Choosing the right animal model for infectious disease research. Animal Model Exp. Med. 1, 100–108 (2018). - PMC - PubMed
    1. Zengler K., et al. , EcoFABs: Advancing microbiome science through standardized fabricated ecosystems. Nat Methods 16, 567–571 (2019). - PMC - PubMed
    1. Zhalnina K., Zengler K., Newman D., Northen T. R., Need for laboratory ecosystems to unravel the structures and functions of soil microbial communities mediated by chemistry. mBio 9, e01175-18 (2018). - PMC - PubMed

Publication types