. 2023 May 9;120(19):e2122168120.
doi: 10.1073/pnas.2122168120. Epub 2023 May 1.

Direct neuronal reprogramming by temporal identity factors

Affiliations

Direct neuronal reprogramming by temporal identity factors

Camille Boudreau-Pinsonneault et al. Proc Natl Acad Sci U S A. .

Abstract

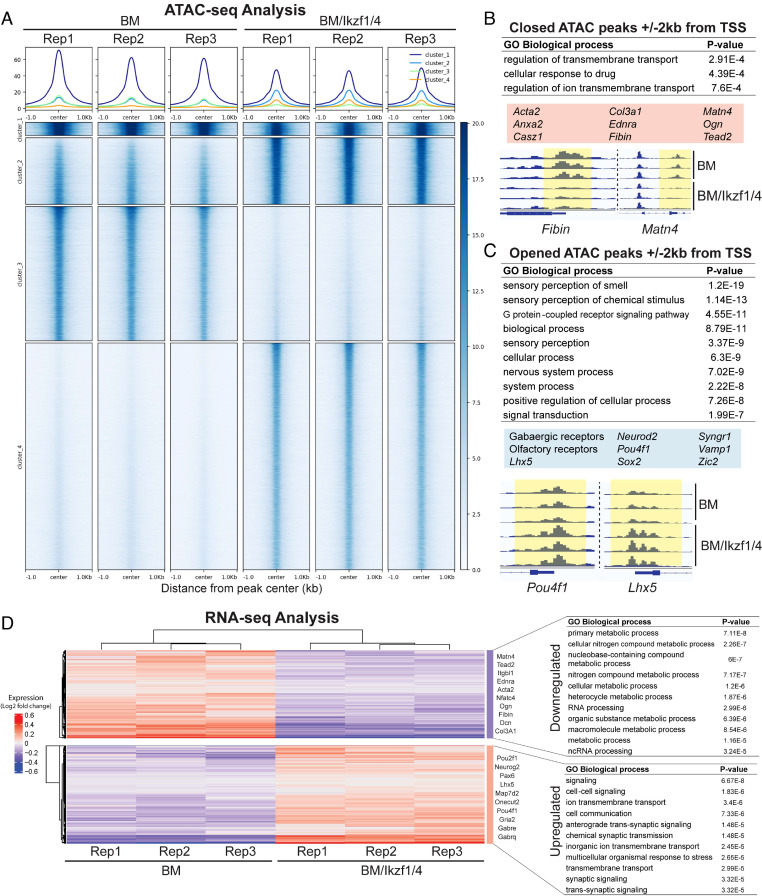
Temporal identity factors are sufficient to reprogram developmental competence of neural progenitors and shift cell fate output, but whether they can also reprogram the identity of terminally differentiated cells is unknown. To address this question, we designed a conditional gene expression system that allows rapid screening of potential reprogramming factors in mouse retinal glial cells combined with genetic lineage tracing. Using this assay, we found that coexpression of the early temporal identity transcription factors Ikzf1 and Ikzf4 is sufficient to directly convert Müller glial (MG) cells into cells that translocate to the outer nuclear layer (ONL), where photoreceptor cells normally reside. We name these "induced ONL (iONL)" cells. Using genetic lineage tracing, histological, immunohistochemical, and single-cell transcriptome and multiome analyses, we show that expression of Ikzf1/4 in MG in vivo, without retinal injury, mostly generates iONL cells that share molecular characteristics with bipolar cells, although a fraction of them stain for Rxrg, a cone photoreceptor marker. Furthermore, we show that coexpression of Ikzf1 and Ikzf4 can reprogram mouse embryonic fibroblasts to induced neurons in culture by rapidly remodeling chromatin and activating a neuronal gene expression program. This work uncovers general neuronal reprogramming properties for temporal identity factors in terminally differentiated cells.

Keywords: cell therapy; regeneration; reprogramming; retina; transcription factors.


Conflict of interest statement

C.B.-P., A.J., M.F., P.M., and M.C. are inventors on a patent application related to this work filed by Adaerata LP (No. US62/755,657). The other authors declare no competing interest.

Figures

Fig. 1.
Fig. 1.
Ikzf1/4 expression induces morphological reprogramming of MG ex vivo. (A) Summary diagram of ex vivo screen protocol. Lightning bolt represents electroporation. HT: hydroxytamoxifen. CDS: coding sequence. (B) List of conditions screened for MG reprogramming. (C) Representative images of retinal sections electroporated with control, Ikzf1, Ikzf4, and combined Ikzf1/4 conditions immunostained for YFP. Dotted lines show the ONL, where photoreceptors reside. Circles in the Ikzf1/4 condition point to cells with altered morphology located in the ONL. (Scale bars: 17 µm). (D) Representative image of retinal sections from electroporated regions with control (empty pCALM vector) and Ikzf1/4 constructs immunostained for YFP. Circles point to MG-derived cells in the ONL. Dotted lines show the ONL. (Scale bars: 38 µm). ONL: outer nuclear layer/photoreceptor layer. (E) Localization of cell bodies of YFP+/mCherry+ cells for control (n = 6) and Ikzf1/4 (n = 6) conditions. ***P < 0.001, unpaired t test. (F) Representative images of Ikzf1/4-electroporated retinas ex vivo, immunostained for YFP and cell-specific markers as indicated. Most reprogrammed cells in the ONL (circled) are negative for the MG markers Lhx2 or Sox2 but are positive for the cone marker Rxrg. The YFP+ cells in Ikzf1/4 conditions also display rounded and photoreceptor-like morphologies. Dotted lines define the ONL thickness. (Scale bars: 10 µm). ONL: outer nuclear layer/photoreceptor layer. (G) Quantifications of morphologies of control and Ikzf1/4 YFP+/mCherry+ cells. **P = 0.0022, Mann–Whitney U test, control (n = 6) and Ikzf1/4 (n = 6). (H) Quantification of marker expression in control- and Ikzf1/4-electroporated retinas. **P = 0.0022, Mann–Whitney U test, control (n = 5) and Ikzf1/4 (n = 5). Graphs show means ± SD.
Fig. 2.
Fig. 2.
Ikzf1/4 reprogram MG to iONL cells in vivo. (A) Summary diagram of the MG reprogramming in vivo experimental protocol. IP: intraperitoneal injection. CDS: coding sequence. Lightning bolt represents electroporation. (B and C) In vivo retinal sections from control (B) and Ikzf1/4 (C) electroporations stained for YFP and the MG marker Lhx2 (Top) or the cone cell marker Rxrg (Bottom). Dotted circle in (C) points to a cell magnified in the bottom right corners. Dotted lines identify the ONL. (Scale bars: 38 µm). ONL: outer nuclear layer/photoreceptor layer. (D) Representative images of retinal sections immunostained for YFP and the cone marker Rxrg 3 wk after Ikzf1/4 expression in vivo. Reprogrammed cells in the ONL (circled) stain positive for Rxrg. Bottom row: Arrowhead shows an Rxrg+ cell in the INL. Dotted lines identify the ONL thickness. (Scale bars: 5 µm). (E and F) Several representative images of retinal sections immunostained for YFP and the MG markers Lhx2 (E) and Sox2 (F) 3 wk after Ikzf1/4 expression in vivo. Ikzf1/4-reprogrammed cells in the ONL (circled) do not express MG markers. (Scale bars: 5 µm). (G) Quantifications of reprogrammed cells in control- and Ikzf1/4-electroporated retinas at 3 and 5 wk after tamoxifen injection. Graph represents mean ± SD. ns - nonsignificant: *P < 0.05; **P < 0.01; Mann–Whitney U test. Control (3 wk: n = 5; 5 wk: n = 4) and Ikzf1/4 (3 wk: n = 5; 5 wk: n = 5). (H) Immunostaining for YFP and Sox2 on retinal sections 3 wk after expression of Ikzf1/4. Some YFP+/mCherry+ cells (circled) in the INL show varying levels of Sox2, whereas reprogrammed cell in the ONL (arrowhead) is negative for Sox2. (Scale bar: 5 µm).
Fig. 3.
Fig. 3.
scRNA-seq identifies reprogrammed cells as bipolar-like cells. (A) UMAP of integrated 3-wk control (yellow) and 3-wk Ikzf1/4 (blue)-transfected cells isolated by flow sorting. (B) Individual cell-type annotation using a deep-learning model coupled with a weighted graph neural network (GNN) via scDeepSort; the model was trained on the Clark et al. scRNA-seq atlas (49). (C) Yfp and mCherry transcript expression in the integrated dataset. (D) UMAP of confirmed YFP-expressing control (yellow) and Ikzf1/4 (blue)-transfected cells; YFP-negative and mCherry-positive cells were removed. (E) UMAP of confirmed YFP-expressing control and Ikzf1/4 cells annotated by cell type using scDeepSort. (F) Count of annotated cell types (Left) and statistical enrichment (Right) as determined by permutation and bootstrapping tests. (G) Expression matrix of bipolar and MG markers for control and Ikzf1/4 conditions. Blue denotes high expression, and the circle size denotes the fraction of expressing cells within the cluster.
Fig. 4.
Fig. 4.
Multiome analysis of early-phase MG reprogramming. (A) UMAP generated from composite scRNA-seq and scATAC-seq data from 48 h control (yellow) and 48h Ikzf1/4 (blue)-transfected cells isolated by flow cytometry. (B) Individual cell-type annotation using a deep-learning model coupled with a weighted GNN via scDeepSort; the model was trained on the Clark et al. scRNA-seq atlas (49). (C) YFP and mCherry expression detected solely from the scRNA-seq data. (D) UMAP of confirmed YFP RNA-expressing control (yellow) and Ikzf1/4 (blue)-transfected cells isolated by flow cytometry and visualized according to the transfection condition. (E) UMAP of confirmed YFP RNA-expressing control and Ikzf1/4-transfected cells annotated by cell type. (F) Count of annotated cell types (Left) and statistical enrichment (Right) as determined by permutation and bootstrapping tests. (G) Integration of differential accessibility (Y axis) versus RNA expression (X axis) for YFP RNA-expressing cells annotated as MG. Circle size denotes the number of peaks per gene, while color indicates the −log10(P value). See Dataset S1 for full integrated data. (H) GO terms for the 201 differential genes plotted in terms of P value and overlap. Circle color indicates the P value, while size indicates the frequency of the GO term in the GO Annotation database. (I) Normalized pseudobulk ATAC-seq signal, pseudobulk ATAC-seq peaks, and snRNA-seq expression data for Foxp2 in control versus Ikzf1/4 in YFP RNA-expressing cells annotated as MG.
Fig. 5.
Fig. 5.
Ikzf1/4 increase chromatin accessibility and activate a neuronal gene expression program in MEFs. (A) ATAC signal aligned at peak center of all significantly (P < 0.05) enriched or depleted ATAC peaks in BM/Ikzf1/4 (Right) compared to BM (Left). Clusters 1 and 3 show peaks with decreased signal in BM/Ikzf1/4 (closing of chromatin), and clusters 2 and 4 show peaks with increased signal in BM/Ikzf1/4 (opening of chromatin). Top graphs show mean signal for each cluster. Scale represents peak coverage with no coverage in white and maximum coverage in dark blue. Columns represent replicates (Rep) per infection condition. (B and C) Closed (B) or opened (C) chromatin regions located ±2 kb from the TSS represented as a table of GO term classification. Genes were classified using GREAT algorithm. Examples of genes associated with closed or opened chromatin regions are shown in red (B) and blue (C) boxed areas, respectively. See Dataset S2 for complete list of genes. TSS genomic tracks for Fibin and Matn4 (B) or Pou4f1 and Lhx5 (C) are shown in the bottom panels. (D) Heatmap of log2 expression fold change and GO term classification of the most significantly up-regulated and down-regulated genes in MEFs 48 h after BM (Left)- or BM/Ikzf1/4 (Right)-induced expression. Parameters used for scoring significant genes were Log2FC > 0.25 and P-value < 0.05. High expression is denoted by red, whereas low expression is denoted by blue. Each replicate is represented as a column (n = 3). Examples of down-regulated fibroblast genes and up-regulated neuronal genes in BM/Ikzf1/4 compared to BM are listed on the right side of the heatmap. GOrilla classification of GO terms is represented as a table on the right.
Fig. 6.
Fig. 6.
Summary of findings. (A) Ikzf1/4 expression in MG through electroporation, represented by lightning bolt and dotted arrow, induces reprogramming (arrow) into iONL cells located in the photoreceptor layer. The reprogrammed cells turn off glial gene expression and start expressing some neuronal cell markers found in bipolars and cones. (B) BM/Ikzf1/4 expression in MEFs through lentiviral vectors, represented by dotted line and red virus cartoon, reprograms (arrow) these cells to induced neurons (iNs) by decreasing accessibility and expression of fibroblast genes (represented in blue) and increasing accessibility and expression of neuronal genes (represented in red).

References

    1. Barker R. A., Gotz M., Parmar M., New approaches for brain repair-from rescue to reprogramming. Nature 557, 329–334 (2018). - PubMed
    1. Li H., Chen G., In vivo reprogramming for CNS repair: Regenerating neurons from endogenous glial cells. Neuron 91, 728–738 (2016). - PMC - PubMed
    1. Goldman D., Muller glial cell reprogramming and retina regeneration. Nat. Rev. Neurosci. 15, 431–442 (2014). - PMC - PubMed
    1. Lenkowski J. R., Raymond P. A., Muller glia: Stem cells for generation and regeneration of retinal neurons in teleost fish. Progress Retinal Eye Res. 40, 94–123 (2014). - PMC - PubMed
    1. Jorstad N. L., et al. , Stimulation of functional neuronal regeneration from Muller glia in adult mice. Nature 548, 103–107 (2017). - PMC - PubMed

Publication types

Substances

LinkOut - more resources