. 2023 May 9;120(19):e2216268120.
doi: 10.1073/pnas.2216268120. Epub 2023 May 1.

Surge of neurophysiological coupling and connectivity of gamma oscillations in the dying human brain

Affiliations

Surge of neurophysiological coupling and connectivity of gamma oscillations in the dying human brain

Gang Xu et al. Proc Natl Acad Sci U S A. .

Abstract

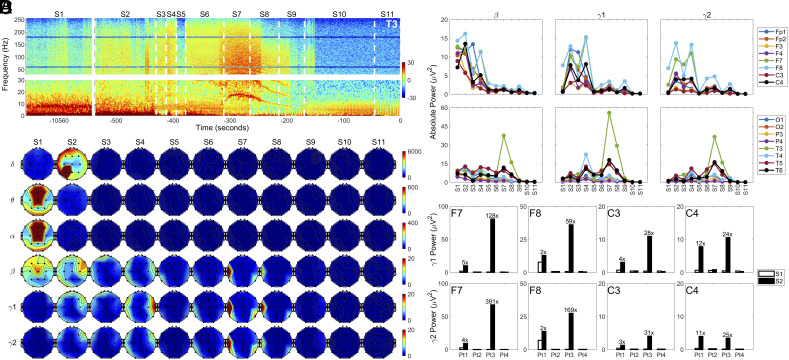
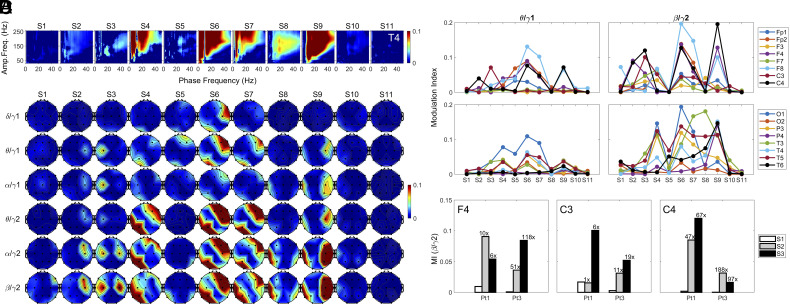
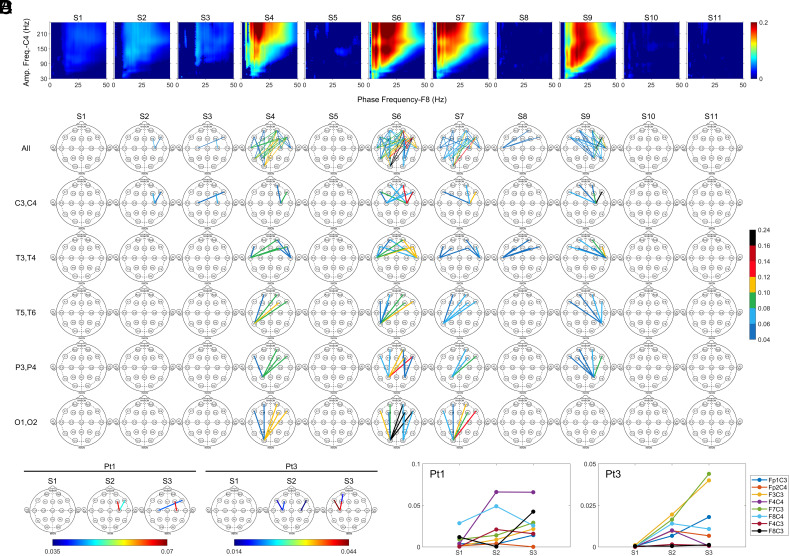
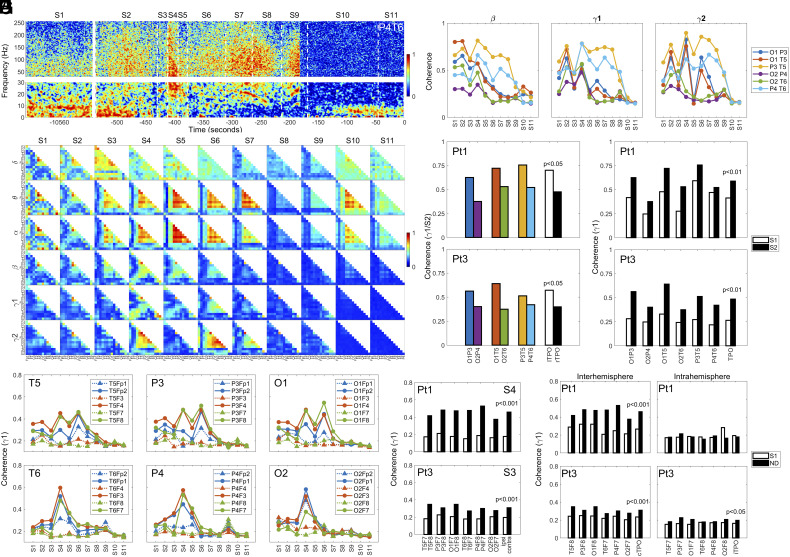
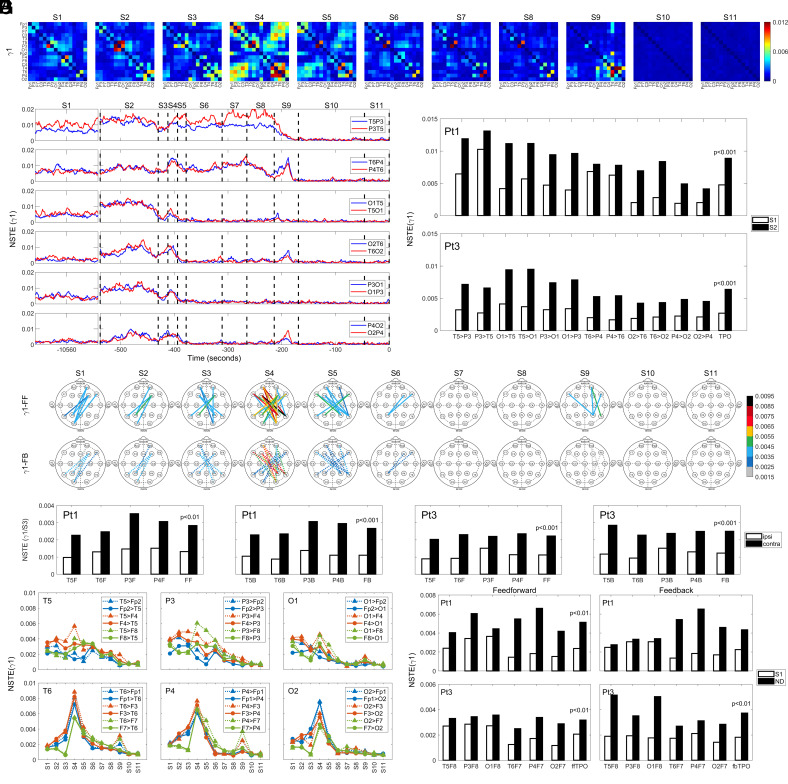
The brain is assumed to be hypoactive during cardiac arrest. However, animal models of cardiac and respiratory arrest demonstrate a surge of gamma oscillations and functional connectivity. To investigate whether these preclinical findings translate to humans, we analyzed electroencephalogram and electrocardiogram signals in four comatose dying patients before and after the withdrawal of ventilatory support. Two of the four patients exhibited a rapid and marked surge of gamma power, surge of cross-frequency coupling of gamma waves with slower oscillations, and increased interhemispheric functional and directed connectivity in gamma bands. High-frequency oscillations paralleled the activation of beta/gamma cross-frequency coupling within the somatosensory cortices. Importantly, both patients displayed surges of functional and directed connectivity at multiple frequency bands within the posterior cortical "hot zone," a region postulated to be critical for conscious processing. This gamma activity was stimulated by global hypoxia and surged further as cardiac conditions deteriorated in the dying patients. These data demonstrate that the surge of gamma power and connectivity observed in animal models of cardiac arrest can be observed in select patients during the process of dying.

Keywords: cross-frequency coupling; directed connectivity; functional connectivity; gamma oscillations; global hypoxia.


Conflict of interest statement

The authors declare no competing interest.

Figures

Fig. 1.
Fig. 1.
Global hypoxia-induced surge of high-frequency oscillations in the brain of dying patients. (A) Absolute power of left anterior-mid temporal lobe (T3) before (S1) and after (S2 to S11) the withdrawal of ventilatory support in Pt1. The power spectrogram was presented in two separate parts (Bottom: 0 to 30 Hz; Top: 30 to 256 Hz) to highlight potentially unique features in slow waves (delta-beta). (B) Spatial and temporal dynamics of absolute power at baseline (S1) and at near-death stages (S2 to S11) in six frequency bands: delta (0 to 4 Hz), theta (4 to 8 Hz), alpha (8 to 13 Hz), beta (13 to 25 Hz), gamma1 (25 to 55 Hz), and gamma2 (80 to 150 Hz) in Pt1. (C) Temporal changes of beta, gamma1, and gamma2 power in 16 EEG loci (excluding the midline areas covered by Fz, Cz, and Pz electrodes) in Pt1. (D) Gamma power in four cortical regions (F7, F8, C3, and C4) in the four patients at baseline (S1) and after the termination of breathing support in S2.
Fig. 2.
Fig. 2.
Hypoxia-induced surge of PAC in the dying brain. (A) Cross-frequency coupling between the phase of lower frequency bands (0 to 50 Hz) and amplitude of higher frequency waves (30 to 250 Hz) in the right anterior-mid temporal lobe (T4) in Pt1. (B) Spatial and temporal distribution of phase-amplitude coupling (PAC) between gamma (gamma1 and gamma2) and lower frequency (delta, theta, alpha, and beta) bands in Pt1 at baseline (S1) and near-death (S2 to S11). (C) Temporal changes of theta/gamma1 and beta/gamma2 coupling in Pt1 in 16 cortical regions at near-death. (D) Beta-gamma2 PAC in somatosensory cortices (C3 and C4) and right dorsal lateral prefrontal cortex (F4) in both Pt1 and Pt3 at baseline (S1) and during the early dying phase (S2, S3).
Fig. 3.
Fig. 3.
Surge of crPAC in the dying brain. (A) crPAC of gamma oscillations (30 to 250 Hz) in the right somatosensory cortex (C4) with the lower frequency (1 to 50 Hz) waves in the right ventrolateral prefrontal cortex (F8) displayed for Pt1. (B) Spatial and temporal dynamics of crPAC was displayed between amplitude of gamma2 wave in the posterior brain (C3, C4, T3, T4, T5, T6, P3, P4, O1 and O2) and phase of beta wave in the prefrontal lobes (Fp1, F7, F3, Fp2, F4, F8) in Pt1. The color bar indicates the strength of the beta/gamma2 coupling. (C) crPAC during the initial phase of the near-death states (S2 and S3) is readily detectable only between the somatosensory cortices (C3 and C4) and the prefrontal (Fp1, F7, F3, F4, F8) areas in both Pt1 and Pt3. (D) Beta-gamma2 crPAC between somatosensory cortices (C3 and C4) and the frontal areas of the brain at early stages of dying process in both Pt1 and Pt3.
Fig. 4.
Fig. 4.
Surge of functional connectivity across multiple frequency bands in the dying patients. (A) Temporal dynamics of functional connectivity between the right posterior temporal lobe (T6) and the right parietal lobe (P4) of Pt1. (B) Spatial and temporal dynamics of functional connectivity across the dying brain over six indicated frequency bands in Pt1. (C) Temporal changes of functional connectivity in beta, gamma1, and gamma2 bands for the six indicated combinations within the TPO junctions are shown for Pt1 for the entire duration (S1 to S11). (D) Gamma1 coherence in S2 within the left (lTPO) and right (rTPO) TPO junctions for both Pt1 (P < 0.05) and Pt3 (P < 0.05). Two-tailed unpaired t tests were carried out to determine the statistical significance between the averaged coherence within the left TPO junctions (O1P3, O1T5, P3T5) and those within the right TPO junctions (O2P4, O2T6, P4T6). (E) Gamma1 coherence within the TPO junctions before (S1) and following ventilator withdrawal (S2) in both Pt1 (P < 0.01) and Pt3 (P < 0.01). Two-tailed paired t tests were carried out on the averaged TPO coherence between S1 and S2. (F) Long-range gamma1 synchrony between each of the TPO components (temporal, parietal, and occipital lobes) and each of the prefrontal lobes at near-death in Pt1. The interhemispheric coherence pairs are displayed as solid circles and lines, whereas the intrahemipheric coherence pairs as solid triangles and dashed lines. (G) Interhemispheric (contra; solid black boxes) versus intrahemispheric (ipsi; open boxes) gamma1 coherence at near death (S4 for Pt1, S3 for Pt3) in both Pt1 (P < 0.001) and Pt3 (P < 0.001). The interhemispheric coherence was compared with intrahemispheric coherence using two-sided unpaired t tests. (H) Long-range gamma1 coherence at baseline (S1) and near-death (ND, S4 for Pt1, S3 for Pt3) within the same hemisphere (Intrahemisphere) or cross the midline (Interhemisphere) for Pt1 and Pt3. (P < 0.001). Two-sided paired t tests were carried out for the statistic values displayed.
Fig. 5.
Fig. 5.
Surge of gamma1 directed connectivity across the brain of the dying patients. (A) Spatial and temporal dynamics of directed connectivity in gamma1 band in the dying brain in Pt1. Direction of connectivity is listed from an electrode listed in the y axis to an electrode in the x axis. Black boxes indicate null interactions (with self); warmer color denotes higher connectivity. (B) Temporal progression of gamma1 directed connectivity within TPO junctions in the dying brain of Pt1. T5P3, for instance, indicates directed connectivity from T5 to P3, whereas P3T5 denotes directed connectivity from P3 to T5. (C) Directed connectivity in gamma1 oscillations shows marked and significant increase within the TPO junctions in S2 for both Pt1 (P < 0.001) and Pt3 (P < 0.001). (D) Long-range gamma1 directed connectivity between the TPO junctions and the prefrontal lobes in Pt1 in both feedforward [FF; from the left (T5, P3, O1) and right (T6, P4, O2) TPO clusters to the prefrontal areas] and feedback (FB; from the prefrontal areas to the TPO clusters) directions. (E) Interhemispheric (contra) and intrahemispheric (ipsi) gamma1 directed connectivity between the temporal (T5, T6), parietal (P3, P4) lobes and the prefrontal (F); Fp1, F7, F3, Fp2, F4, F8) lobes at near-death (S3) in both Pt1 (P < 0.01) and Pt3 (P < 0.001). T5F indicates the averaged NSTE values of T5 with each of the prefrontal (F) lobes of either the same hemisphere (ipsi; Fp1, F7, and F3; open boxes) or the contralateral hemisphere (contra; Fp2, F4, and F8; solid black boxes). (F), Long-range interhemispheric gamma1 directed connectivity between the TPO zones and ventrolateral prefrontal (VLPFC) lobes at near-death (S4, S9) for Pt1. Feedforward connectivity is shown as dashed lines and triangles, whereas feedback connectivity as solid lines and circles. (G) Interhemispheric feedforward (ff) and feedback (fb) connectivity between the TPO zone (TPO) and left (F7) and right (F8) VLPFC for both Pt1 (P < 0.01) and Pt3 (P < 0.01) at baseline (S1) and near-death (ND, S4 for Pt1, S3 for Pt3). The open boxes indicate the connectivity at baseline, the solid black boxes indicate the connectivity at near-death. The interhemispheric feedback connectivity (ffTPO and fbTPO) values were compared between baseline and near-death stages using two-sided paired t tests (P < 0.01).

Comment in

References

    1. Moody R. A., Life After Life (Bantam Books, 1975).
    1. Greyson B., Varieties of near-death experience. Psychiatry 56, 390–399 (1993). - PubMed
    1. van Lommel P., van Wees R., Meyers V., Elfferich I., Near-death experience in survivors of cardiac arrest: A prospective study in the Netherlands. Lancet 358, 2039–2045 (2001). - PubMed
    1. Parnia S., et al. , Guidelines and standards for the study of death and recalled experiences of death–a multidisciplinary consensus statement and proposed future directions. Ann. NY Acad. Sci. 1511, 5–21 (2022). - PubMed
    1. Sabom M., Light and Death: One Doctor's Fascinating Account of Near-death Experiences (Zondervan, 1998), pp.240.