. 2023 May 9;120(19):e2222081120.
doi: 10.1073/pnas.2222081120. Epub 2023 May 1.

High sensitivity top-down proteomics captures single muscle cell heterogeneity in large proteoforms

Affiliations

High sensitivity top-down proteomics captures single muscle cell heterogeneity in large proteoforms

Jake A Melby et al. Proc Natl Acad Sci U S A. .

Abstract

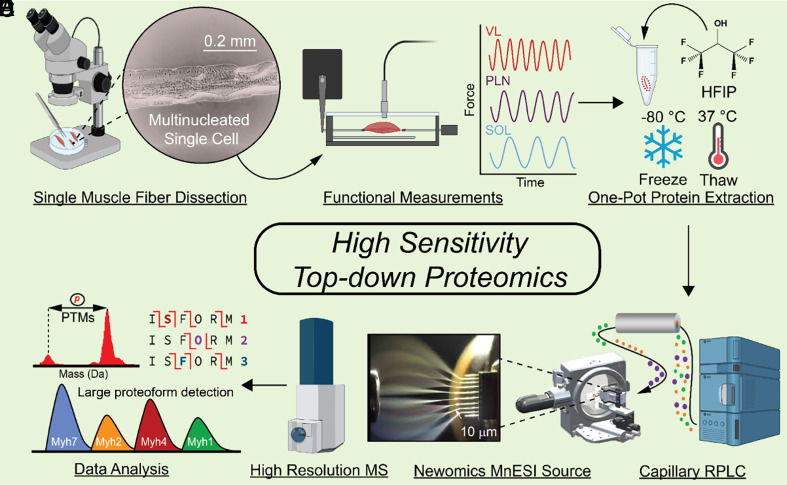
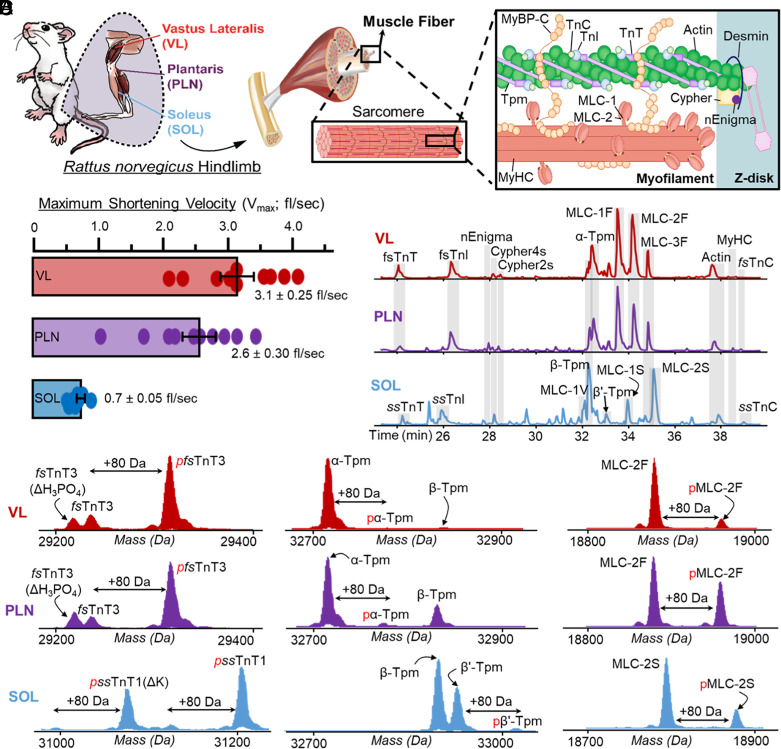
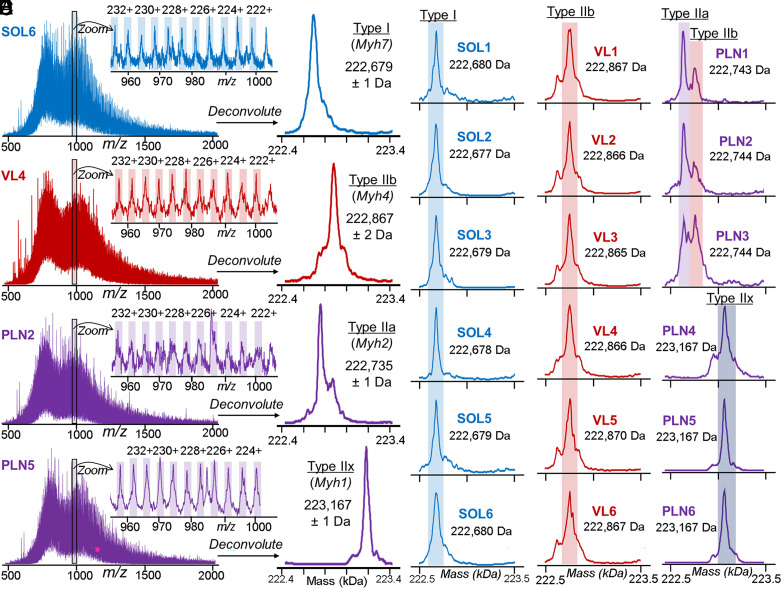
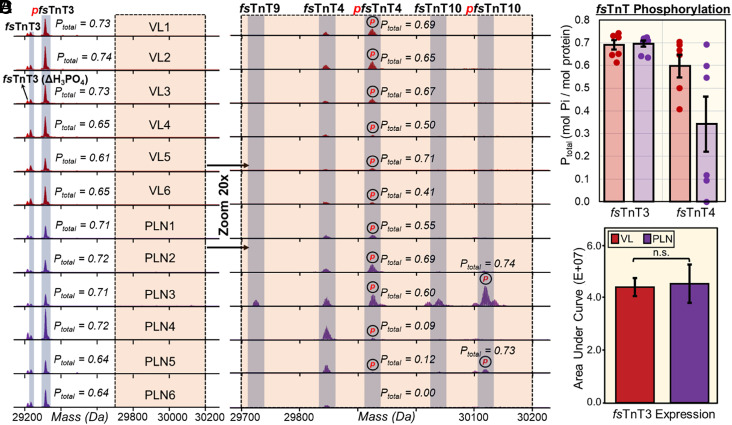
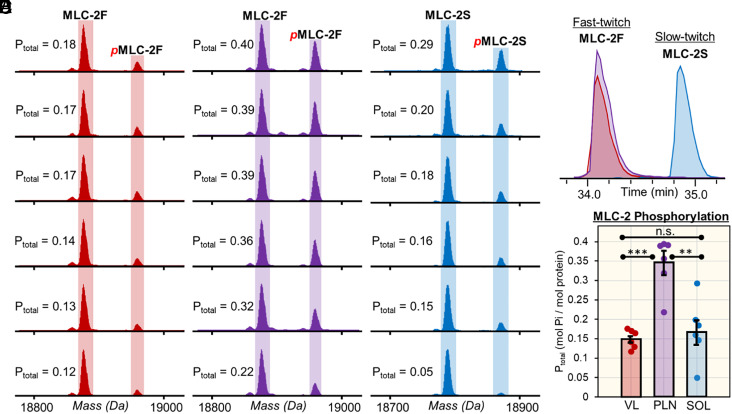
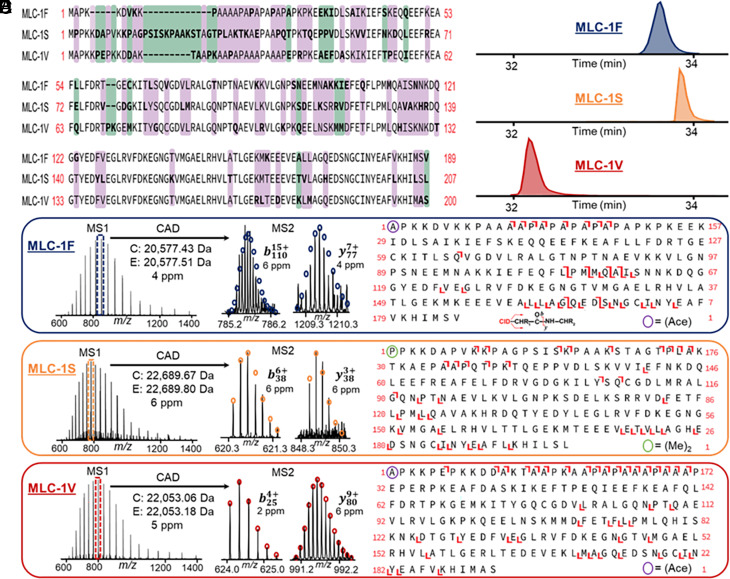
Single-cell proteomics has emerged as a powerful method to characterize cellular phenotypic heterogeneity and the cell-specific functional networks underlying biological processes. However, significant challenges remain in single-cell proteomics for the analysis of proteoforms arising from genetic mutations, alternative splicing, and post-translational modifications. Herein, we have developed a highly sensitive functionally integrated top-down proteomics method for the comprehensive analysis of proteoforms from single cells. We applied this method to single muscle fibers (SMFs) to resolve their heterogeneous functional and proteomic properties at the single-cell level. Notably, we have detected single-cell heterogeneity in large proteoforms (>200 kDa) from the SMFs. Using SMFs obtained from three functionally distinct muscles, we found fiber-to-fiber heterogeneity among the sarcomeric proteoforms which can be related to the functional heterogeneity. Importantly, we detected multiple isoforms of myosin heavy chain (~223 kDa), a motor protein that drives muscle contraction, with high reproducibility to enable the classification of individual fiber types. This study reveals single muscle cell heterogeneity in large proteoforms and establishes a direct relationship between sarcomeric proteoforms and muscle fiber types, highlighting the potential of top-down proteomics for uncovering the molecular underpinnings of cell-to-cell variation in complex systems.

Keywords: mass spectrometry; proteoform; proteomics; single cell; single muscle fiber.


Conflict of interest statement

A co-author, Dr. Daojing Wang, is an employee of Newomics, owns the stocks of Newomics, and is the founder and CEO of Newomics.

Figures

Fig. 1.
Fig. 1.
High-sensitivity top–down proteomics of single muscle fibers (SMFs), multinucleated single muscle cells. (A) SMFs were mechanically dissociated from their constituent muscles in relaxation buffer using fine-point tweezers and a microscope to visualize the fibers. (B) SMFs from each muscle were placed in a force transducer to measure their shortening velocity (n = 10 fibers per muscle). (C) A separate group of SMFs were placed directly into individual low protein binding microcentrifuge tubes for top–down proteomics measurements (n = 6 fibers per muscle). Proteins were extracted from SMFs using hexafluoro-2-propanol (HFIP) and a freeze–thaw lysis. (D) Proteins from SMF extracts were loaded onto a capillary reversed phased liquid chromatography (RPLC) column and separated based on their hydrophobicity. (E) Eluting proteins from SMFs were ionized with a Newomics microflow nanospray electrospray ion (MnESI) source and analyzed using a Bruker maXis II mass spectrometer. (F) Analysis of the resultant top–down proteomics data included posttranslational modification (PTM) measurements, isoform characterization using tandem mass spectrometry (MS/MS), as well as detection of large proteoforms.
Fig. 2.
Fig. 2.
SMFs obtained from skeletal muscles have unique contractile properties and sarcomere proteoform landscapes. (A) Schematic representation of skeletal muscle structure, which are made up of SMFs. Within SMFs are the sarcomeres, which contain the proteins necessary for contraction and relaxation including thin filament proteins (TnT, TnI, TnC, Tpm, and Actin), thick filament proteins (MLC-1, MLC-2, MyHC), and Z-disk proteins (e.g., Cypher2s, Cypher 4s, and nEnigma). (B) Measurement of the maximum shortening velocity (Vmax; fiber lengths (fl)/s) of SMFs isolated from the VL, PLN, and SOL muscles (n = 10 fibers per muscle). (C) Separation and detection of major sarcomeric proteoforms detected in SMFs from VL, PLN, and SOL muscles via LC-MS/MS; base peak chromatograms (BPCs) shown (n = 6 fibers per muscle). (D) Representative deconvoluted mass spectra displaying proteoforms from VL (fast-twitch), PLN (mixed fast- and slow-twitch), and SOL (slow-twitch) single fibers. Monophosphorylation is indicated by red “p”, “ΔH3PO4” indicates a loss of phosphate from pfsTnT3, and “-K” indicates loss of a lysine residue from ssTnT1 or pssTnT1.
Fig. 3.
Fig. 3.
Myosin heavy chain (MyHC) isoforms detected from SMFs. (A) Representative MS1 scans of MyHC isoforms from SMFs obtained from SOL, VL, and PLN muscles. Zoom-in of 960 to 1,000 m/z region shows the highly charged ions characteristic of large proteins with high accuracy mass measurements (1 to 2 Da). (B) Low-resolution maximum entropy deconvolution of representative VL, PLN, and SOL SMFs reveals four distinct masses from the MS1 spectra presumably corresponding to type I, type IIa, type IIb, and type IIx MyHC isoforms. (CE) Deconvoluted mass spectra for all SMFs from SOL, VL, and PLN muscles (n = 6 fibers per muscle). (C) SOL, type I; (D) VL, type IIb; and (E) PLN, type IIa, type IIb, and Type IIx. SOL, VL, and PLN muscles (n = 6 fibers per muscle). (C) SOL, type I; (D) VL, type IIa and type IIb; and (E) PLN, type IIa, type IIb, and type IIx.
Fig. 4.
Fig. 4.
Altered phosphorylation of low-abundance fast skeletal troponin T (fsTnT) isoforms and proteoforms from fiber-to-fiber. (A) Representative deconvoluted mass spectra of fast skeletal troponin 3 (fsTnT3) from SMFs isolated from fast-twitch VL (red) and PLN (purple) muscles. All the spectra are normalized to 1,000,000 intensity units. Mono-phosphorylation is denoted with red “p”; “ΔH3PO4” indicates phosphate loss from pfsTnT3. (B) 20× magnitude zoom-in on 29,700 Da to 30,200 Da region of spectra reveals several low-abundance fsTnT isoforms (fsTnT4, fsTnT9, fsTnT10) in SMFs from fast-twitch VL (red) and PLN (purple) muscles. All the spectra are normalized to 50,000 intensity units. Monophosphorylation is denoted with red “p”. (C) Total phosphorylation (Ptot) calculated as mol Pi/mol protein for fsTnT3 and fsTnT4 from each fiber (n = 6). (D) Extracted ion chromatograms (EICs; top 5 most abundant ions) of fsTnT3 were made and the area under the curve was integrated to calculate the fsTnT3 expression. Groups were considered statistically different at P < 0.05; “n.s.” indicates statistically not significant by the paired Student t test.
Fig. 5.
Fig. 5.
Proteoform heterogeneity in myosin light chain 2 (MLC-2) isoforms across different SMFs. (A) EICs (top 5 most abundant ions) for fast and slow isoforms of myosin light chain 2 (MLC-2F and MLC-2S, respectively) obtained from SMFs from VL, PLN, and SOL muscles. (B and C) Deconvoluted mass spectra of MLC-2F from SMFs from fast-twitch VL and PLN muscles. (D) Deconvoluted mass spectra of MLC-2S from SMFs from slow-twitch SOL muscles. (E) Total phosphorylation (Ptot) calculated by mol Pi/mol protein for MLC-2F and MLC-2S for SMFs from VL, PLN, and SOL muscles (n = 6 fibers per muscle). Groups were considered statistically different at P < 0.05; “n.s.” indicates statistically not significant by the paired Student t test.
Fig. 6.
Fig. 6.
Top–down MS characterization of myosin light chain 1 (MLC-1) isoforms from SMFs. (A) Sequence alignment of the fast, slow, and ventricular isoforms of myosin light chain 1 (MLC-1F, MLC-1S, and MLC-1V, respectively). Purple indicates no residues shared in common between the isoforms, green indicates at least one residue is shared between the isoforms, and no color indicates sequence homology between the isoforms. (B) Representative extracted ion chromatograms (EICs) for MLC-1 isoforms. The EICs of MLC-1F, as well as MLC-1S and MLC-1V, are from SMFs from VL and SOL muscles, respectively. (CE) Online LC–MS/MS of MLC-1 isoforms. Precursor ions were selected for online collisionally activated dissociation resulting in signature b and y ions that are characteristic of MLC-1F (C), MLC-1S (D), and MLC-1V (E). The bond cleavages of MLC-1F (11 b ions, 23 y ions, P value: 5.1 × 10−21), MLC-1S (18 b ions, 24 y ions, P value: 4.5 × 10⁻³³), and MLC-1V (18 b ions, 35 y ions, P value: 2.5 × 10−37) were 14.4%, 19.5%, and 25.3%, respectively. “(Ace)-” denotes Nα-acetylation, “(Me)2-” denotes Nα-dimethylation. Circles represent the theoretical isotopic abundance distribution corresponding to the assigned mass and based on the averagine model.

References

    1. Perkel J. M., Single-cell analysis enters the multiomics age. Nature 595, 614–616 (2021).
    1. R. Elmentaite, C. Domínguez Conde, L. Yang, S. A. Teichmann, Single-cell atlases: Shared and tissue-specific cell types across human organs. Nat. Rev. Genet. 23, 395–410 (2022). - PubMed
    1. Stuart T., Satija R., Integrative single-cell analysis. Nat. Rev. Genet. 205, 257–272 (2019). - PubMed
    1. Slavov N., Unpicking the proteome in single cells. Science 367, 512–513 (2020). - PMC - PubMed
    1. Alfaro J. A., et al. , The emerging landscape of single-molecule protein sequencing technologies. Nat. Methods 18, 604–617 (2021). - PMC - PubMed

Publication types

MeSH terms

LinkOut - more resources