. 2023 Jun;14(3):1569-1582.
doi: 10.1002/jcsm.13246. Epub 2023 May 1.

Impairment of aryl hydrocarbon receptor signalling promotes hepatic disorders in cancer cachexia

Affiliations

Impairment of aryl hydrocarbon receptor signalling promotes hepatic disorders in cancer cachexia

Adeline Dolly et al. J Cachexia Sarcopenia Muscle. 2023 Jun.

Abstract

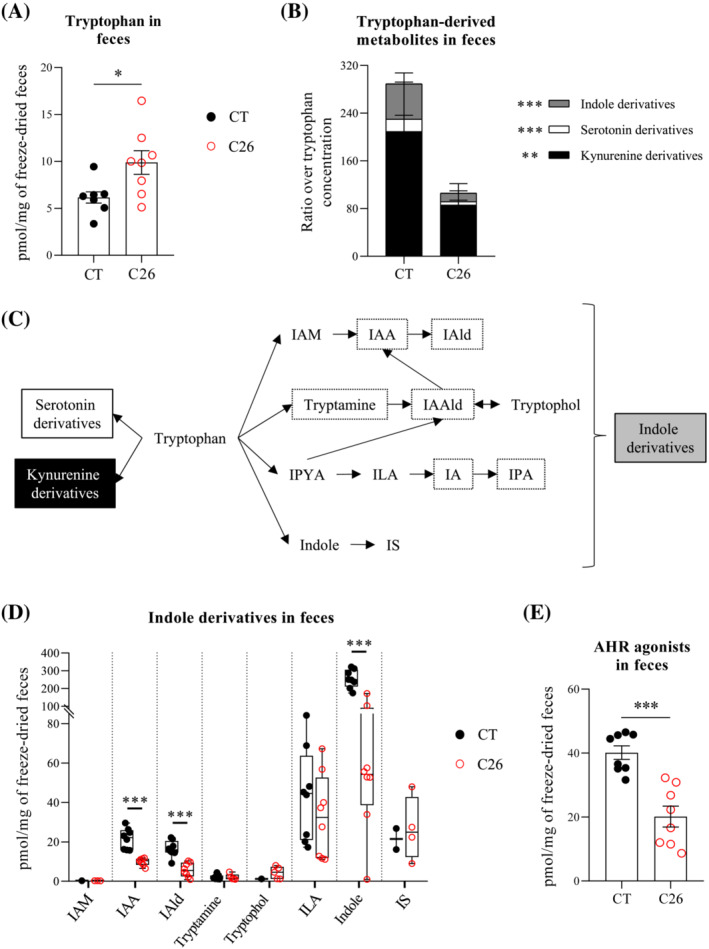
Background: The aryl hydrocarbon receptor (AHR) is expressed in the intestine and liver, where it has pleiotropic functions and target genes. This study aims to explore the potential implication of AHR in cancer cachexia, an inflammatory and metabolic syndrome contributing to cancer death. Specifically, we tested the hypothesis that targeting AHR can alleviate cachectic features, particularly through the gut-liver axis.

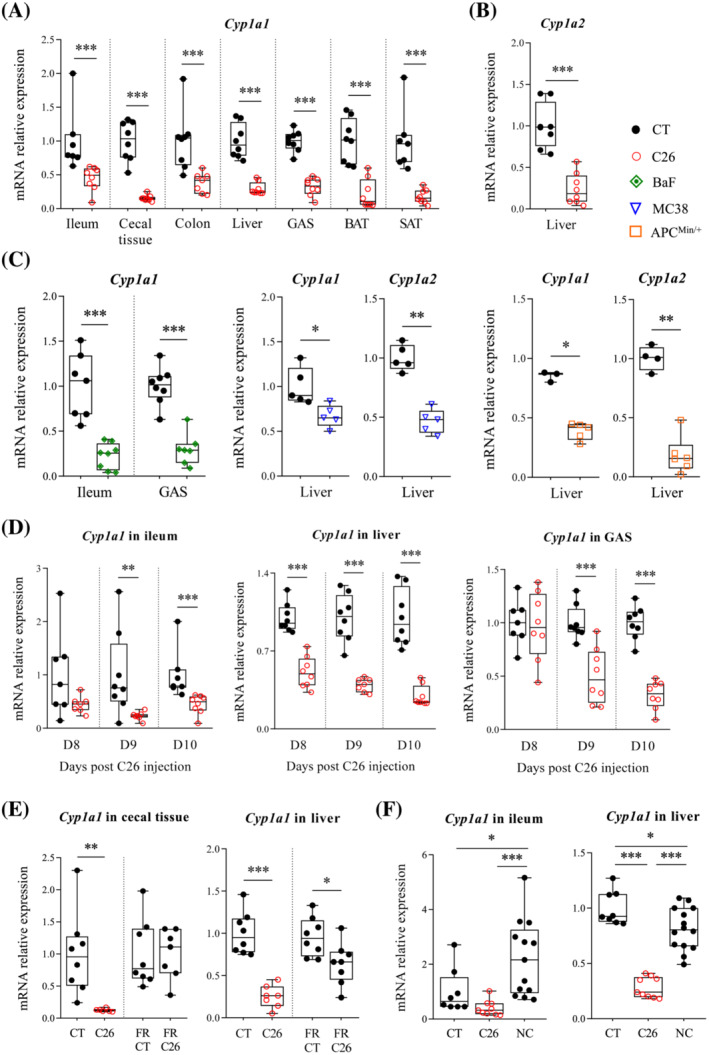
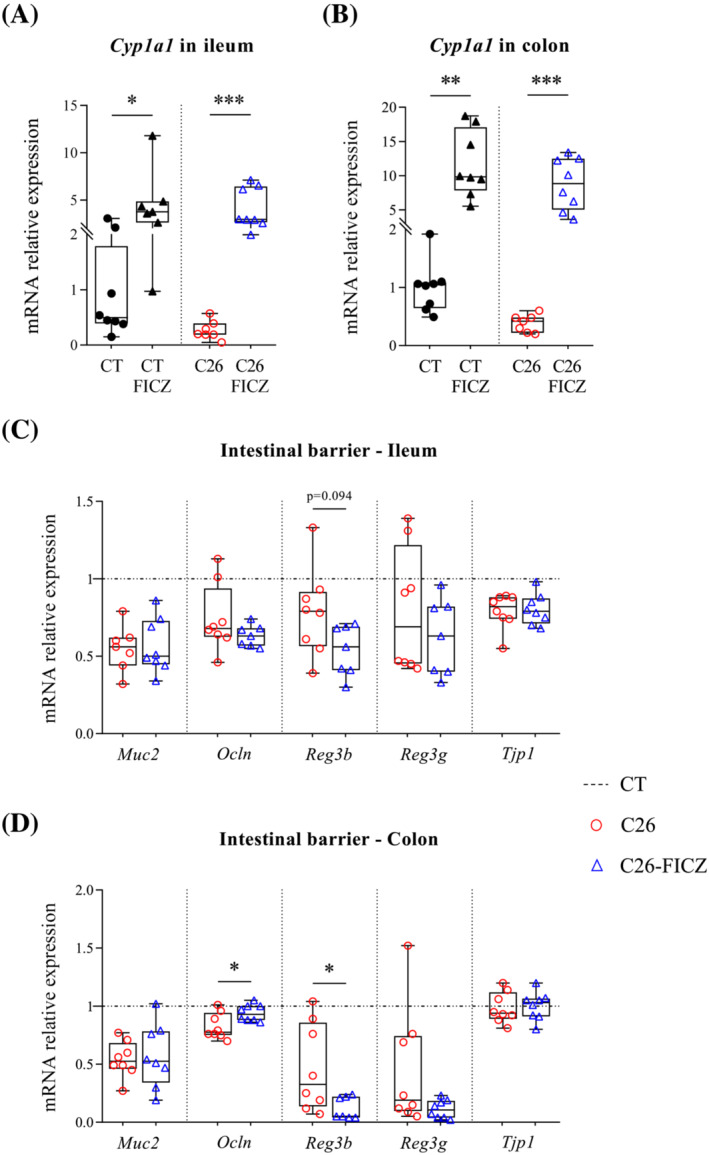
Methods: AHR pathways were explored in multiple tissues from four experimental mouse models of cancer cachexia (C26, BaF3, MC38 and APCMin/+ ) and from non-cachectic mice (sham-injected mice and non-cachexia-inducing [NC26] tumour-bearing mice), as well as in liver biopsies from cancer patients. Cachectic mice were treated with an AHR agonist (6-formylindolo(3,2-b)carbazole [FICZ]) or an antibody neutralizing interleukin-6 (IL-6). Key mechanisms were validated in vitro on HepG2 cells.

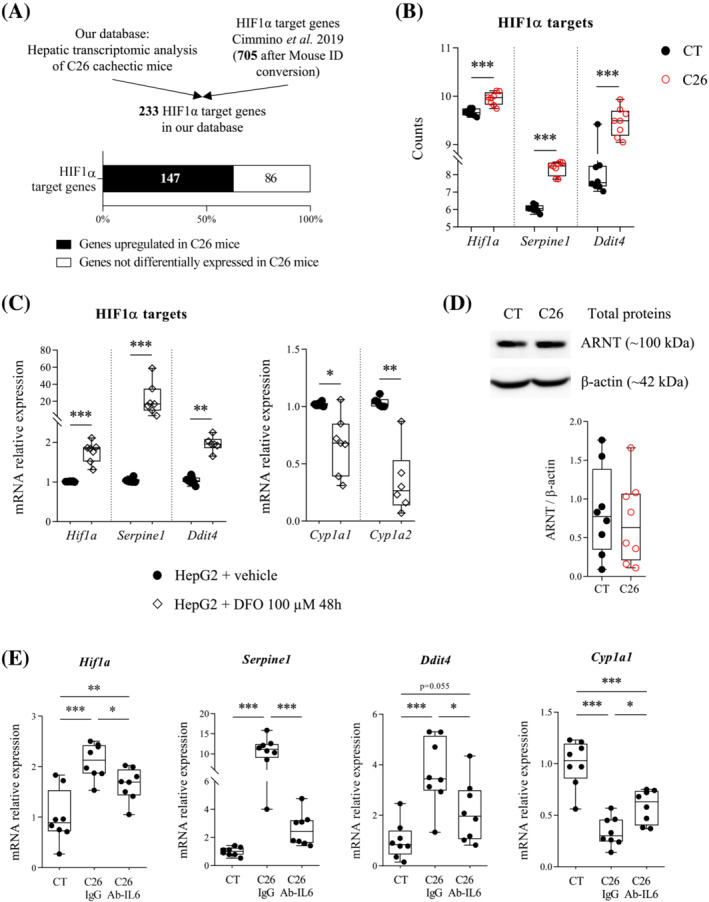
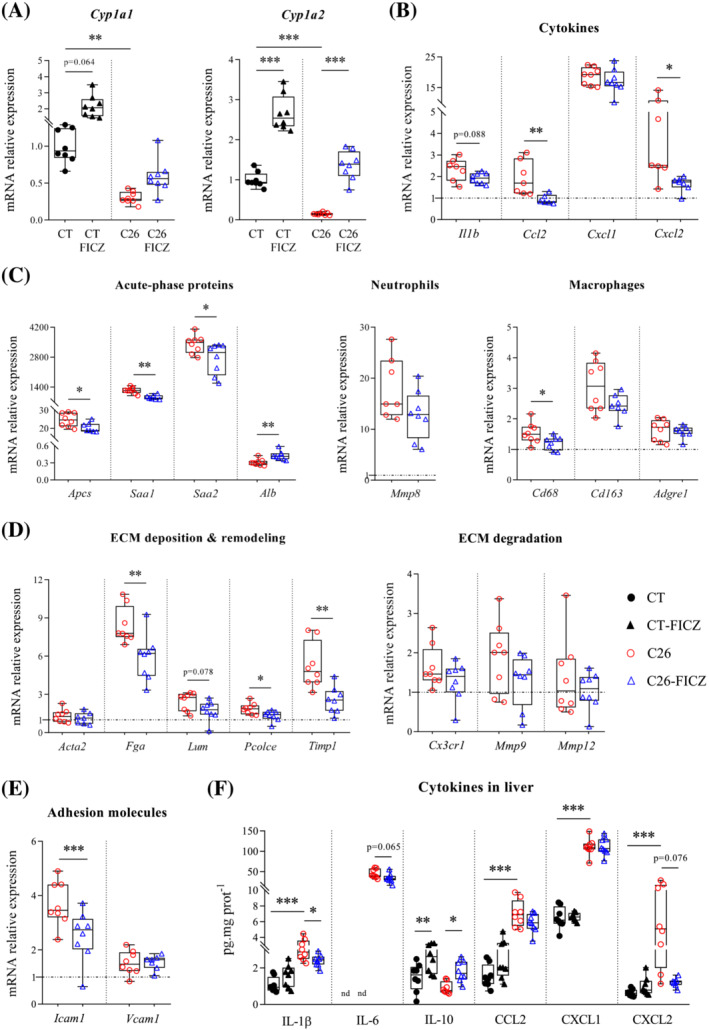
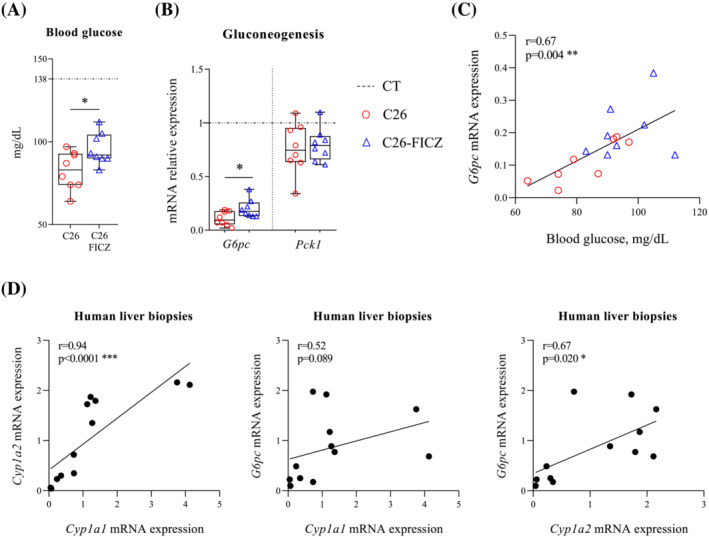
Results: AHR activation, reflected by the expression of Cyp1a1 and Cyp1a2, two major AHR target genes, was deeply reduced in all models (C26 and BaF3, P < 0.001; MC38 and APCMin/+ , P < 0.05) independently of anorexia. This reduction occurred early in the liver (P < 0.001; before the onset of cachexia), compared to the ileum and skeletal muscle (P < 0.01; pre-cachexia stage), and was intrinsically related to cachexia (C26 vs. NC26, P < 0.001). We demonstrate a differential modulation of AHR activation in the liver (through the IL-6/hypoxia-inducing factor 1α pathway) compared to the ileum (attributed to the decreased levels of indolic AHR ligands, P < 0.001), and the muscle. In cachectic mice, FICZ treatment reduced hepatic inflammation: expression of cytokines (Ccl2, P = 0.005; Cxcl2, P = 0.018; Il1b, P = 0.088) with similar trends at the protein levels, expression of genes involved in the acute-phase response (Apcs, P = 0.040; Saa1, P = 0.002; Saa2, P = 0.039; Alb, P = 0.003), macrophage activation (Cd68, P = 0.038) and extracellular matrix remodelling (Fga, P = 0.008; Pcolce, P = 0.025; Timp1, P = 0.003). We observed a decrease in blood glucose in cachectic mice (P < 0.0001), which was also improved by FICZ treatment (P = 0.026) through hepatic transcriptional promotion of a key marker of gluconeogenesis, namely, G6pc (C26 vs. C26 + FICZ, P = 0.029). Strikingly, these benefits on glycaemic disorders occurred independently of an amelioration of the gut barrier dysfunction. In cancer patients, the hepatic expression of G6pc was correlated to Cyp1a1 (Spearman's ρ = 0.52, P = 0.089) and Cyp1a2 (Spearman's ρ = 0.67, P = 0.020).

Conclusions: With this set of studies, we demonstrate that impairment of AHR signalling contributes to hepatic inflammatory and metabolic disorders characterizing cancer cachexia, paving the way for innovative therapeutic strategies in this context.

Keywords: CYP1A1; CYP1A2; HIF1α; TIPARP; fibroblast growth factor 21.


Conflict of interest statement

The authors declare that the research was conducted in the absence of any commercial or financial relationships that could be construed as a potential conflict of interest.

Figures

Figure 1
Figure 1
Aryl hydrocarbon receptor (AHR) agonists levels are decreased in the faeces of C26 cachectic mice. (A) Faecal level of tryptophan in sham‐injected mice (CT) and mice injected with cachexia‐inducing C26 colon carcinoma cells (C26). (B) Stacked plot displaying the sum of the metabolites of indole, serotonin or kynurenine pathway over tryptophan concentration in the faeces of CT and C26 mice. n = 8 per group. (C) Schematic view of tryptophan metabolism, with particular emphasis on indole/AHR pathway and AHR agonists (framed in dotted lines). From top left to bottom right: indole‐3‐acetamide (IAM), indole acetic acid (IAA), indole‐3‐aldehyde (IAld), indole‐3‐acetaldehyde (IAAld), indole‐3‐pyruvate (IPYA), indole‐3‐lactic acid (ILA), indoleacrylic acid (IA), indole‐3‐propionic acid (IPA) and indole‐sulfonic acid (IS). (D) Quantification of indole pathway metabolites in the faeces of CT and C26 mice. (E) AHR agonist quantification in the faeces of CT and C26 mice. A list of AHR agonists was made based on a literature search,, , S16 and the levels of AHR agonists detected in C26 mice (IAA, IAld and tryptamine) were summed up. In (A) and (E), data are presented as mean ± SEM. In (D), data are presented with inter‐quartile range (IQR) box and min‐to‐max whiskers. *P < 0.05. ** P < 0.01. *** P < 0.001.
Figure 2
Figure 2
Decreased aryl hydrocarbon receptor (AHR)‐regulated CYP1A gene transcripts in preclinical models of cancer cachexia. (A) mRNA expression levels of cytochrome P450 family 1 subfamily A member 1 (Cyp1a1) in the ileum, caecal tissue, colon, liver, gastrocnemius muscle (GAS), brown adipose tissue (BAT) and subcutaneous adipose tissue (SAT) of sham‐injected mice (CT) and mice injected with cachexia‐inducing C26 colon carcinoma cells (C26). (B) Hepatic mRNA expression levels of cytochrome P450 family 1 subfamily A member 2 (Cyp1a2) in CT and C26 mice. (C) mRNA expression levels of Cyp1a1 in the ileum and GAS of CT and leukaemic BaF mice; hepatic mRNA expression levels of Cyp1a1 and Cyp1a2 in CT mice and mice injected with MC38 colon carcinoma cells (MC38) and in CT mice and APCMin/+ mice, which are predisposed to intestinal adenoma formation. (D) Evolution of Cyp1a1 mRNA expression levels in the ileum, liver and GAS of CT and C26 mice, 8, 9 and 10 days after injection. (E) mRNA expression levels of Cyp1a1 in the caecal tissue and liver of CT mice, C26 mice and healthy mice sham injected and food restricted to the amount of food consumed by either the CT group (FR‐CT mice) or the C26 group (FR‐C26 mice). (F) mRNA expression levels of Cyp1a1 in the ileum and liver of CT mice, C26 mice and mice injected with non‐cachexia‐inducing C26 colon carcinoma cells (NC). Data are presented with inter‐quartile range (IQR) box and min‐to‐max whiskers. *P < 0.05. ** P < 0.01. *** P < 0.001.
Figure 3
Figure 3
Interleukin‐6 (IL‐6)/hypoxia‐inducing factor 1α (HIF1α) pathway is involved in the decrease in aryl hydrocarbon receptor (AHR) activation in the liver of C26 cachectic mice. (A) Stacked plot displaying HIF1α target genes identified in an existing experimentally determined dataset upregulated or not differentially expressed in the liver of C26 mice. Data were analysed with Fisher's exact test on a 2 × 2 contingency table. (B) Hepatic RNAseq data expressed in counts of three HIF1α targets in sham‐injected mice (CT) and mice injected with cachexia‐inducing C26 colon carcinoma cells (C26). Hypoxia‐inducible factor 1, alpha subunit (Hif1a) (log2 fold change [L2FC]: 0.42); serine (or cysteine) peptidase inhibitor, clade E, member 1 (Serpine1) (L2FC: 3.92); and DNA‐damage‐inducible transcript 4 (Ddit4) (L2FC: 1.91). (C) mRNA expression levels of Hif1a, Serpine1, Ddit4, cytochrome P450 family 1 subfamily A member 1 (Cyp1a1) and cytochrome P450 family 1 subfamily A member 2 (Cyp1a2) in HepG2 cells treated with or without 100‐μM desferrioxamine (DFO), a hypoxia‐mimetic agent inducing HIF1α, for 48 h. (D) Total protein expression levels of aryl hydrocarbon receptor nuclear translocator (ARNT) in the liver of CT and C26 mice, normalized to β‐actin. (E) mRNA expression levels of Hif1a, Serpine1, Ddit4 and Cyp1a1 in the liver of sham‐injected mice (CT), cachectic mice treated with a neutralizing antibody targeting IL‐6 (C26 Ab‐IL6) or an isotype control (C26‐IgG). Data are presented with inter‐quartile range (IQR) box and min‐to‐max whiskers. *P < 0.05. ** P < 0.01. *** P < 0.001.
Figure 4
Figure 4
6‐Formylindolo(3,2‐b)carbazole (FICZ) treatment does not improve altered intestinal permeability in C26 cachectic mice. mRNA expression levels of cytochrome P450 family 1 subfamily A member 1 (Cyp1a1) in (A) the ileum and (B) colon of sham‐injected mice (CT), sham‐injected mice treated with FICZ (CT‐FICZ), mice injected with cachexia‐inducing C26 colon carcinoma cells (C26) and mice injected with cachexia‐inducing C26 colon carcinoma cells and treated with FICZ (C26‐FICZ). mRNA expression levels of five markers of intestinal barrier: mucin 2 (Muc2), occluding (Ocln), regenerating islet‐derived 3 beta (Reg3b), regenerating islet‐derived 3 gamma (Reg3g) and tight junction protein 1 (Tjp1), in (C) the ileum and (D) colon of CT, C26 and C26‐FICZ mice. Mean expression of CT mice = 1 (dotted line). Data are presented with inter‐quartile range (IQR) box and min‐to‐max whiskers. *P < 0.05. ** P < 0.01. *** P < 0.001.
Figure 5
Figure 5
6‐Formylindolo(3,2‐b)carbazole (FICZ) treatment improves hepatic inflammation in C26 cachectic mice. (A) Hepatic mRNA expression levels of cytochrome P450 family 1 subfamily A member 1 (Cyp1a1) and cytochrome P450 family 1 subfamily A member 2 (Cyp1a2) in sham‐injected mice (CT), sham‐injected mice treated with FICZ (CT‐FICZ), mice injected with cachexia‐inducing C26 colon carcinoma cells (C26) and mice injected with cachexia‐inducing C26 colon carcinoma cells and treated with FICZ (C26‐FICZ). Hepatic mRNA expression levels of (B) one cytokine: interleukin 1 beta (Il1b), and three chemokines: chemokine (C–C motif) ligand 2 (Ccl2), C–X–C motif chemokine ligand 1 (Cxcl1) and C–X–C motif chemokine ligand 2 (Cxcl2); (C) three positive and one negative acute‐phase proteins: amyloid P component, serum (Apcs), serum amyloid A 1 (Saa1), serum amyloid A 2 (Saa2) and albumin (Alb); one marker of neutrophil recruitment: matrix metallopeptidase 8 (Mmp8); three markers of macrophages: CD68 antigen (Cd68), CD163 antigen (Cd163) and adhesion G protein‐coupled receptor E1 (Adgre1); (D) one marker of hepatic stellate cell activation: actin alpha 2, smooth muscle, aorta (Acta2); four markers of extracellular matrix deposition and remodelling: fibrinogen alpha chain (Fga), lumican (Lum), procollagen C‐endopeptidase enhancer protein (Pcolce) and tissue inhibitor of metalloproteinase 1 (Timp1); three markers of extracellular matrix degradation: chemokine (C–X3–C motif) receptor 1 (Cx3cr1), matrix metallopeptidase 9 (Mmp9) and matrix metallopeptidase 12 (Mmp12); and (E) two adhesion molecules: intercellular adhesion molecule 1 (Icam1) and vascular cell adhesion molecule 1 (Vcam1) in CT, C26 and C26‐FICZ mice. Mean expression of CT mice = 1 (dotted line). (F) Hepatic levels of cytokines and chemokines in CT, CT‐FICZ, C26 and C26‐FICZ mice. IL‐6, interleukin‐6; IL‐10, interleukin‐10; nd, not detected. Data are presented with inter‐quartile range (IQR) box and min‐to‐max whiskers. *P < 0.05. ** P < 0.01. *** P < 0.001.
Figure 6
Figure 6
6‐Formylindolo(3,2‐b)carbazole (FICZ) treatment improves glycaemic disorders in C26 cachectic mice through regulation of hepatic gluconeogenesis. Concordantly, aryl hydrocarbon receptor (AHR) activation and gluconeogenesis markers correlate together in liver biopsies from cancer patients. (A) Blood glucose levels in sham‐injected mice (CT), mice injected with cachexia‐inducing C26 colon carcinoma cells (C26) and mice injected with cachexia‐inducing C26 colon carcinoma cells and treated with FICZ (C26‐FICZ). Mean blood glucose level of CT mice = 138 (dotted line). (B) Hepatic mRNA expression levels of two markers of gluconeogenesis: glucose‐6‐phosphatase (G6pc), catalytic; phosphoenolpyruvate carboxykinase 1 (Pck1), cytosolic in CT, C26 and C26‐FICZ mice. Mean expression of CT mice = 1 (dotted line). Data are presented with inter‐quartile range (IQR) box and min‐to‐max whiskers. *P < 0.05. (C) Pearson correlation between hepatic mRNA expression levels of G6pc and blood glucose levels in C26 and C26‐FICZ mice. (D) Spearman correlations between mRNA expression levels of cytochrome P450 family 1 subfamily A member 1 (Cyp1a1), cytochrome P450 family 1 subfamily A member 2 (Cyp1a2) and G6pc, measured in liver biopsies from cancer patients.

References

    1. Roman ÁC, Carvajal‐Gonzalez JM, Merino JM, Mulero‐Navarro S, Fernández‐Salguero PM. The aryl hydrocarbon receptor in the crossroad of signalling networks with therapeutic value. Pharmacol Ther 2018;185:50–63. - PubMed
    1. Shivanna B, Chu C, Moorthy B. The aryl hydrocarbon receptor (AHR): a novel therapeutic target for pulmonary diseases? Int J Mol Sci 2022;23:1516. - PMC - PubMed
    1. Carambia A, Schuran FA. The aryl hydrocarbon receptor in liver inflammation. Semin Immunopathol 2021;43:563–575. - PMC - PubMed
    1. Oost LJ, Kustermann M, Armani A, Blaauw B, Romanello V. Fibroblast growth factor 21 controls mitophagy and muscle mass. J Cachexia Sarcopenia Muscle 2019;10:630–642. - PMC - PubMed
    1. Hankinson O. The aryl hydrocarbon receptor complex. Annu Rev Pharmacol Toxicol 1995;35:307–340. - PubMed

Publication types