. 2023 Jun 14;43(24):4390-4404.
doi: 10.1523/JNEUROSCI.0103-23.2023. Epub 2023 May 1.

Structural Preservation Does Not Ensure Function at Sensory Ia-Motoneuron Synapses following Peripheral Nerve Injury and Repair

Affiliations

Structural Preservation Does Not Ensure Function at Sensory Ia-Motoneuron Synapses following Peripheral Nerve Injury and Repair

Travis M Rotterman et al. J Neurosci. .

Abstract

Injury that severs peripheral nerves often results in long-lasting motor behavioral deficits and in reorganization of related spinal motor circuitry, neither of which reverse even after nerve regeneration. Stretch areflexia and gait ataxia, for example, emerge from a combination of factors including degeneration of Ia-motoneuron synapses between peripherally damaged Ia muscle spindle afferents and motoneurons. Based on evidence that nerve injury acts via immune responses to induce synapse degeneration, we hypothesized that suppressing inflammatory responses would preserve Ia-motoneuron connectivity and aid in restoring normal function. We tested our hypothesis by administering the anti-inflammatory agent minocycline in male and female rats following axotomy of a peripheral nerve. The connectivity of Ia-motoneuron synapses was then assessed both structurally and functionally at different time points. We found that minocycline treatment overcame the physical loss of Ia contacts on motoneurons which are otherwise lost after axotomy. While necessary for functional recovery, synaptic preservation was not sufficient to overcome functional decline expressed as smaller than normal stretch-evoked synaptic potentials evoked monosynaptically at Ia-motoneuron connections and an absence of the stretch reflex. These findings demonstrate a limited capacity of minocycline to rescue normal sensorimotor behavior, illustrating that structural preservation of synaptic connectivity does not ensure normal synaptic function.SIGNIFICANCE STATEMENT Here we demonstrate that acute treatment with the semisynthetic tetracycline anti-inflammatory agent minocycline permanently prevents the comprehensive loss of synaptic contacts made between sensory neurons and spinal motoneurons following peripheral nerve injury and eventual regeneration. Treatment failed, however, to rescue normal function of those synapses or the reflex circuit they mediate. These findings demonstrate that preventing synaptic disconnection alone is not sufficient to restore neural circuit operation and associated sensorimotor behaviors.

Keywords: Ia afferents; degeneration; motoneurons; peripheral nerve injury; sensorimotor.


Figures

Figure 1.
Figure 1.
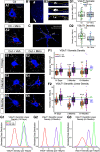
Minocycline treatment preserves VGluT1 contacts on axotomized motoneurons following peripheral nerve injury. A1, A2, Confocal image stacks of retrogradely labeled motoneurons innervating the MG muscle in control (Ctl, A1) and controls treated with minocycline (Ctl + Mino, A2). Tissue sections were immunolabeled for VGluT1 to identify Ia afferent synapses (red arrows, white boutons). B1, B2, VGluT1 boutons in direct contact with the soma (B1) or dendritic arbor (B2) were identified and quantified. The image series in B2 shows a synapse above the dendrite (top), then contacting the dendrite (middle), and below the dendrite (bottom). Yellow solid line indicates the dendritic surface. C, Confocal image stacks were uploaded to Neurolucida, and motoneurons were reconstructed in 3D to quantify VGluT1 somatic and dendritic linear densities. The reconstruction example in C represents the motoneuron presented in A1. D1, D2, Box plots represent the comparison of the somatic surface area density (VGluT1 per 1000 µm2, D1) and dendritic linear density (VGluT1 per 100 µm, D2) between Ctl and Ctl + Mino rats. Each individual dot represents a single motoneuron color coordinated by animal (Ctl: n = 7 rats, 9 or 10 cells per rat, Ctl + Mino: n = 4 rats, 9 or 10 cells per rat). Box represents the 25th-75th percentile. Horizontal line indicates the median. Bottom vertical lines indicate the minimal values defined by 25th percentile – 1.5 × interquartile range. Top vertical line indicates the maximum value defined by 75th percentile + 1.5 × interquartile range. No significant differences were detected for either VGluT1 somatic density (D1) or dendritic linear density (D2) between Ctl and Ctl + Mino. Soma – Lmem Wald F test: F = 4.8961, p = 0.0007 (Ctl vs Ctl + Mino): estimate = 0.0682, t.ratio = 0.116, p = 1.000. Dendritic – Lmem Walk F test: F = 9.8183, p < 0.0001 (Ctl vs Ctl + Mino): estimate = 1.408, t.ratio = 1.516, p = 0.7937. E1-E6, Image stacks representing retrogradely labeled motoneurons and VGluT1 immunoreactivity 14 d (E1,E2), 3 months (E3,E4), and 6+ months (6-12 months) (E5,E6) for Cut + Vehicle (Cut + Veh) and Cut + minocycline (Cut + Mino). F1, F2, Comparison of VGluT1 somatic and dendritic linear density at 14 d, 3 months, and 6+ months following MG nerve cut-repair in vehicle- and minocycline-treated rats. Graphs are as described for D1, D2. Green dashed line indicates the median from Ctl. Blue dashed line indicates the median from Ctl + Mino rats. VGluT1 synapses are significantly depleted at both 3 and 6+ months in Cut + Veh. However, in Cut + Mino, VGluT1 synapses are preserved and retained on motoneurons (14 d; Cut + Veh: n = 4 rats, Cut + Mino: n = 5 rats, 3 months; Cut + Veh: n = 4 rats, Cut + Mino: n = 4 rats, 6+ months; Cut + Veh: n = 6 rats, Cut + Mino: n = 7 rats. 8-10 motoneurons reconstructed per rat). Soma – (3 month Ctl vs Cut +Veh): estimate = 2.5571, t.ratio = 4.348, p = 0.0028 (3 month Ctl + Mino vs Cut + Mino): estimate = 0.7196, t.ratio = 1.085, p = 0.9556 (6 month Ctl + Cut + Veh): estimate = 1.9403, t.ratio = 3.717, p = 0.0152 (6 month Ctl + Mino vs Cut + Mino): estimate = 1.1824, t.ratio = 2.009, p = 0.4913. Dendritic – (3 month Ctl vs Cut +Veh): estimate = 5.760, t.ratio = 6.199, p < 0.0001 (3 month Ctl + Mino vs Cut + Mino): estimate = 0.207, t.ratio = 0.197, p = 1.000 (6 month Ctl + Cut + Veh): estimate = 4.550, t.ratio = 5.517, p = 0.0001 (6 month Ctl + Mino vs Cut + Mino): estimate = 1.230, t.ratio = 1.323, p = 0.8834. G1-G3, VGluT1 dendritic linear densities were simulated at three time points following injury using a generative statistical model. At each time point, the distribution for Cut + Veh (red curve) is shifted to the left and shows little to no overlap with the minocycline-treated cohort (purple curve), further supporting an enhanced preservation of VGluT1 synapses with minocycline delivery. **p < 0.01. ***p < 0.001.
Figure 2.
Figure 2.
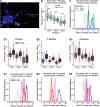
VGluT1 synapses are preserved on the proximal dendritic arbor of motoneurons following Cut + Mino. A, Sholl analyses were conducted on Neurolucida motoneuron 3D reconstructions (bin size = 50 µm starting from center of the cell body). Synapses on the soma are not included in these data (grayed out cell body). B, VGluT1 dendritic linear density comparison (per 100 µm) between Ctl (green) and Ctl + Mino rats (blue) at 50, 100, and 150 µm from the soma center point. No significant differences were detected in any of the three compartments between Ctl and Ctl + Mino. Each individual dot represents a single motoneuron and is color coordinated by animal (Ctl: n = 7 rats, 9 or 10 cells per rat, Ctl + Mino: n = 4 rats, 9 or 10 cells per rat). Green dashed lines indicate Ctl median. Blue dashed lines indicate Ctl + Mino median. Linear mixed effect (lme) Emmeans pairwise: 50 µm – estimate = 1.58, t.ratio = 0.962, p = 0.7719; 100 µm – estimate = 0.663, t.ratio = 0.591, p = 0.9337; 150 µm – estimate = −1.033, t.ratio = −1.034, p = 0.7319. C, Generative model simulation distributions comparing all three bins between Ctl (green) and Ctl + Mino (blue) are presented here. Thickest line indicates the 50 µm bin. Middle dashed line indicates the 100 µm bin. Thinnest hashed line indicates the 150 µm bin. The predicted distribution for each bin size overlaps substantially for the two control conditions, suggesting that the model is unable to distinguish between the two. D1-D3, Each of the three bins was compared at 14 d (D1), 3 months (D2), and 6+ months (D3) between Cut + Veh and Cut + Mino. At 14 d, synaptic density trended toward a decrease in Cut + Veh, although this did not reach a level of significance in any of the three bins. However, by 3 and 6+ months, Cut + Veh-treated animals showed significance VGluT1 loss in the 50 and 100 µm bins compared with controls and Cut + Mino. 14 days (Ctl vs Cut + Veh): 50 µm – estimate = 3.713, t.ratio = 2.353, p = 0.1275; 100 µm – estimate = 1.319, t.ratio = 1.365, p = 0.5376; 150 µm – estimate = 1.817, t.ratio = 1.846, p = 0.2870. 14 days (Ctl + Mino vs Ctl + Mino): 50 µm – estimate = −0.471, t.ratio = −0.279, p = 0.9921; 100 µm – estimate = −1.671, t.ratio = −1.613, p = 0.3993. 150 µm – estimate = 0.703, t.ratio = 0.708, p = 0.8924. 3 months (Ctl vs Cut + Veh): 50 µm – estimate = 7.926, t.ratio = 5.063, p = 0.0007; 100 µm – estimate = 4.103, t.ratio = 4.749, p = 0.0013; 150 µm – estimate = 1.609, t.ratio = 1.896, p = 0.2710. 3 months (Ctl + Mino vs Ctl + Mino): 50 µm – estimate = −0.425, t.ratio = −0.241, p = 0.9949; 100 µm – estimate = −0.198, t.ratio = −0.203, p = 0.9969; 150 µm – estimate = −0.0239, t.ratio = −0.025, p = 1.000. 6 months (Ctl vs Cut + Veh): 50 µm – estimate = 6.02, t.ratio = 4.127, p = 0.0027; 100 µm – estimate = 3.254, t.ratio = 3.268, p = 0.0185; 150 µm – estimate = 1.250, t.ratio = 1.414, p = 0.5058. 6 months (Ctl + Mino vs Ctl + Mino) 50 µm – estimate = 1.57, t.ratio = 0.956, p = 0.7756; 100 µm – estimate = 1.150, t.ratio = 1.025, p = 0.7372; 150 µm – estimate = 1.489, t.ratio = 1.490, p = 0.4618. E1-E3, A generative statistical model was also used to compare densities among the three bins for Cut + Veh (red lines) and Cut + Mino (purple lines). At 14 d post injury (E1), there is a decrease in predicted density (left shift) compared with Ctl and the Cut + Mino animals, suggesting a decrease in predicted densities. This trend continues at 3 months with an even more drastic loss in synaptic density (E2). At 6+ months, there is a modest improvement in predicted synaptic density, but it remains less than those animals treated with minocycline (E3). *p < 0.05. **p < 0.01. ***p < 0.001.
Figure 3.
Figure 3.
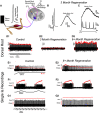
Regenerated motoneurons produce muscle force at 3 months; Ia afferents encode muscle stretch by 6 months post injury. A, Graphic represents the in vivo electrophysiology preparation. The MG muscle is attached to a servo motor to apply a muscle stretch (i.e., vibration). Silver bipolar electrodes are placed under the corresponding rootlet to record extracellular sensory afferent activity in response to vibration; and in a subset of experiments, a sharp electrode was used to penetrate single Ia afferents. Antidromically stimulated MG motoneurons were also penetrated and recorded intracellularly with sharp electrodes. B, Suprathreshold current injection into regenerated MG motoneurons produce single motor unit twitches in the corresponding muscle. C, Injected current steps can elicit repetitive firing, resulting in summation of muscle force (top trace). These electrophysiological properties indicate successful motor axon recovery 3 months following Cut + Mino. D1-D3, Dorsal root recordings were obtained to indicate afferent response to stretch. At 3 months post Cut + Mino, no dorsal root potentials were detected in response to vibration (n = 4 rats); however, by 6 months, sensory Ia axons have regenerated and recovered their ability to encode stretch. Each trace is a single raw record (black) with a rectified and integrated overlaying trace on top (red). These data also indicate that, even when Ia afferents remain functionally disconnected peripherally, synaptic contacts are retained centrally on motoneurons. E1, E2, F1, F2, G1, G2, Single Ia afferent intra-axonal recordings from Ctl (E1,F1,G1) and 6 months after Cut + Mino (E2,F2,G2) in response to ramp, triangle stretch, and vibration to classify single Ia afferents. Black traces represent examples of action potential firing in response to the stretch perturbation. Red dots represent instantaneous firing frequency. Ia afferent firing rates in response to different muscle stretch paradigms recover 6+ months after Cut + Mino. A, Graphic was partially created with www.BioRender.com.
Figure 4.
Figure 4.
Neither functional connectivity nor synaptic efficacy is improved through monosynaptic pathways in rodents treated with vehicle or minocycline after nerve cut. A, Intracellular records were obtained from MG motoneurons and classified as either “responders” or “nonresponders” in response to tendon vibration. B, Percent of responder motoneurons are compared across the four groups (Ctl: n = 36, Ctl + Mino: n = 27, Cut + Veh: n = 37, Cut + Mino: n = 36). In Ctl and Ctl + Mino, a detectable SSP was elicited in 100% of all trials. However, after nerve Cut + Veh, connectivity decreased to 37.8% and even further down to 22.2% in Cut + Mino. C, A generative model was also used to predict vibration response rates across the three groups. In Ctl, response rate remained ∼100%. The model predicts no differences between Cut + Veh or Cut + Mino as their distributions overlap substantially, suggesting no improvements with minocycline treatment. D1-D4, Representative averaged raw synaptic potential traces for each of the groups in response to vibration (100 Hz, 1 s duration). D1, Dotted rectangle outlines initial spikes in raw trace for inset in E1 and E2. E1, E2, Amplitudes of the first (E1) and third peak (E2) were compared across groups. Inset, Raw trace displaying the first and third peak measured indicated by the red arrows. Each individual dot represents a single motoneuron and is color coordinated by animal (Ctl: n = 16 rats, Ctl + Mino: n = 5 rats, Cut + Veh = 9, Cut + Mino = 10). Statistical comparisons were performed using a nonparametric approach (Kruskal–Wallis test) because of the small number of motoneurons that responded in Cut + Veh and Cut + Mino. These data demonstrate a significantly smaller amplitude in response to vibration in both injured groups compared with their respective control cohorts. There was no statistical difference between the two control groups. Kruskal–Wallis ANOVA by Ranks: Vib1 – H(3, N = 84) = 33.2861, p < 0.0001 (Ctl vs Ctl + Mino) p = 0.1161, (Ctl + Cut + Veh) p = 0.0023, (Ctl + Mino vs Cut + Mino) p = 0.0008. Vib3: – H(3, N = 83) = 32.4811, p < 0.0001 (Ctl vs Ctl + Mino) p = 0.6474, (Ctl + Cut + Veh) p = 0.0002, (Ctl + Mino vs Cut + Mino) p = 0.0036. F1, F2, The generative statistical model shows substantial overlap in the distributions for both the first and third peak amplitude responses in vehicle- and minocycline-treated rats following injury, suggesting no difference in predicted response between these two cohorts. **p < 0.01. ***p < 0.001.
Figure 5.
Figure 5.
The monosynaptic stretch reflex remains absent in rodents treated with minocycline after peripheral nerve injury. A1-A3, Reflex force traces measured in response to vibration stimulation (100 Hz). The smoothed force trace is dispayed for 6 consecutive trials (black curve) along with corresponding EMG (blue trace) for Ctl (A1), Cut + Veh (A2), and Cut + Mino (A3) 6+ months following injury. B, Force response to tetanic stimulation of the ipsilateral sural nerve demonstrates the capacity of MG motor unit recruitment in response to cutaneous stimulation. C, Quantification of force: the integral of each individual smoothed force trace was computed and averaged across all trials for each animal. Force is reported in grams (g). D1, D2, The average percent of trials that produced a reflex in Ctl (n = 5 rats), Cut + Veh (n = 6 rats), and Cut + Mino (n = 4 rats) at both resting background force (10 g) and at 20 g. Error bars indicate SE. In Ctl (green dots), almost every trial produced a reflex at 10 g in each trial and 100% of the time when background force increases to 20 g (D2). In Cut + Veh animals (red dots), no animal produced a reflex at either 10 or 20 g. Determination of the presence of reflex was first gated on the detection of an EMG signal. In Cut + Mino, only one rat displayed low-level EMG activity in response to vibration at 20 g. E1, E2, Average reflex forces at both 10 g (E1) and 20 g (E2). No statistical comparisons were conducted on these data as only one single animal, among the nerve injured cohorts, produced any reflex at all.
Figure 6.
Figure 6.
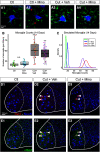
Minocycline does not prevent microglia proliferation following nerve injury nor the release of CSF1 from axotomized motoneurons. A1-A4, Confocal image stacks (63×) containing retrogradely labeled MG motoneurons (fast blue) immunolabeled with Iba1 (green) to identify microglia/macrophages in Ctl (A1), Ctl + Mino (A2), Cut + Veh (A3), and Cut + Mino (A4) 14 d post injury. A2, Red arrows indicate reactive microglia morphology in response to sharp electrode insertion during motoneuron recording. B, The total number of Iba1+ cells were quantified in 1024 × 1024 pixel confocal image stacks 50 µm thick and compared between the four groups. Each individual dot represents a count from a single section and are color coordinated by animal (Ctl: n = 4 rats, Ctl + Mino: n = 4 rats, Cut + Veh = 4, Cut + Mino = 5, 9, or 10 sections per animal). No differences in number of microglia were detected between Ctl and Ctl + Mino. However, microglia proliferation significantly increased similarly in both Cut + Veh and Cut + Mino 14 d post injury. Lmem Wald F test: F = 19.6859, p < 0.0001 (Ctl vs Ctl + Mino): estimate = −2.77, t.ratio = −0.513, p = 0.9545 (Ctl vs Cut + Mino): estimate = −33.41, t.ratio = −6.168, p = 0.0002 (Ctl + Mino vs Cut + Mino): estimate = −23.54, t.ratio = −4.578, p = 0.0025. C, Generative modeling demonstrates no differences in microglia distributions between Ctl (green trace) and Ctl + Mino (blue trace). These simulations predict a similar increase in number of microglia in both Cut + Veh and Cut + Mino with overlapping distributions. D1-D3, Confocal image stack displaying immunolabeling against NeuN (blue) and CSF1 (red) in the ventral horn in Ctl (D1) and 14 d post Cut + Veh (D2) and Cut + Mino (D3). The white solid line separates the white and gray matter. Dashed white line indicates LIX. E1-E3, Images in D1-D3 merged with Iba1 (green) labeling to identify surrounding microglia/macrophages. These images show no detectable CSF1 expression in motoneurons under baseline conditions; however, white arrows highlight expression specifically in motoneurons following nerve injury in both the Cut + Veh and Cut + Mino.

References

    1. Akhter ET, Rotterman TM, English AW, Alvarez FJ (2019) Sciatic nerve cut and repair using fibrin glue in adult mice. Bio Protoc 9:e3363. - PMC - PubMed
    1. Alvarez FJ, Bullinger KL, Titus HE, Nardelli P, Cope TC (2010) Permanent reorganization of Ia afferent synapses on motoneurons after peripheral nerve injuries. Ann NY Acad Sci 1198:231–241. 10.1111/j.1749-6632.2010.05459.x - DOI - PMC - PubMed
    1. Alvarez FJ, Titus-Mitchell HE, Bullinger KL, Kraszpulski M, Nardelli P, Cope TC (2011) Permanent central synaptic disconnection of proprioceptors after nerve injury and regeneration: I. Loss of VGLUT1/IA synapses on motoneurons. J Neurophysiol 106:2450–2470. 10.1152/jn.01095.2010 - DOI - PMC - PubMed
    1. Alvarez FJ, Rotterman TM, Akhter ET, Lane AR, English AW, Cope TC (2020) Synaptic plasticity on motoneurons after axotomy: a necessary change in paradigm. Front Mol Neurosci 13:68. 10.3389/fnmol.2020.00068 - DOI - PMC - PubMed
    1. Berg A, Zelano J, Thams S, Cullheim S (2013) The extent of synaptic stripping of motoneurons after axotomy is not correlated to activation of surrounding glia or downregulation of postsynaptic adhesion molecules. PLoS One 8:e59647. 10.1371/journal.pone.0059647 - DOI - PMC - PubMed

Publication types