

Faster and more accurate pathogenic combination predictions with VarCoPP2.0
- PMID: 37127601
- PMCID: PMC10152795
- DOI: 10.1186/s12859-023-05291-3
Faster and more accurate pathogenic combination predictions with VarCoPP2.0
Abstract
Background: The prediction of potentially pathogenic variant combinations in patients remains a key task in the field of medical genetics for the understanding and detection of oligogenic/multilocus diseases. Models tailored towards such cases can help shorten the gap of missing diagnoses and can aid researchers in dealing with the high complexity of the derived data. The predictor VarCoPP (Variant Combinations Pathogenicity Predictor) that was published in 2019 and identified potentially pathogenic variant combinations in gene pairs (bilocus variant combinations), was the first important step in this direction. Despite its usefulness and applicability, several issues still remained that hindered a better performance, such as its False Positive (FP) rate, the quality of its training set and its complex architecture.
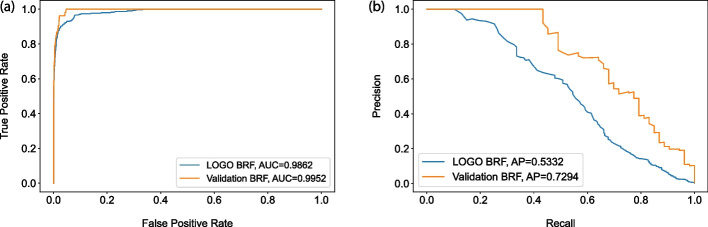
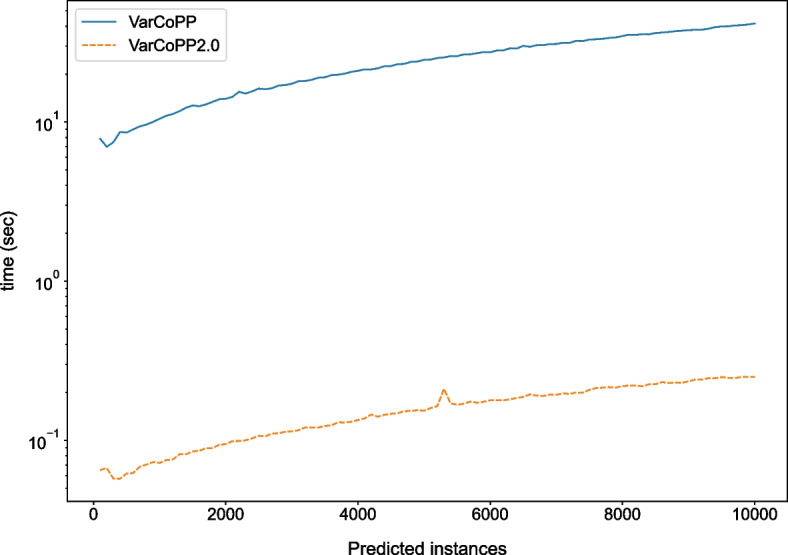
Results: We present VarCoPP2.0: the successor of VarCoPP that is a simplified, faster and more accurate predictive model identifying potentially pathogenic bilocus variant combinations. Results from cross-validation and on independent data sets reveal that VarCoPP2.0 has improved in terms of both sensitivity (95% in cross-validation and 98% during testing) and specificity (5% FP rate). At the same time, its running time shows a significant 150-fold decrease due to the selection of a simpler Balanced Random Forest model. Its positive training set now consists of variant combinations that are more confidently linked with evidence of pathogenicity, based on the confidence scores present in OLIDA, the Oligogenic Diseases Database ( https://olida.ibsquare.be ). The improvement of its performance is also attributed to a more careful selection of up-to-date features identified via an original wrapper method. We show that the combination of different variant and gene pair features together is important for predictions, highlighting the usefulness of integrating biological information at different levels.
Conclusions: Through its improved performance and faster execution time, VarCoPP2.0 enables a more accurate analysis of larger data sets linked to oligogenic diseases. Users can access the ORVAL platform ( https://orval.ibsquare.be ) to apply VarCoPP2.0 on their data.
Keywords: Balanced random forest; Oligogenic diseases; Pathogenicity predictor; Variant combinations.
© 2023. The Author(s).
Conflict of interest statement
The authors declare that they have no competing interests.
Figures


References
-
- Robinson JF, Katsanis N. Oligogenic disease. 2010;243–62. Chap. 7. 10.1007/978-3-540-37654-5.
-
- Okazaki A, Ott J. Machine learning approaches to explore digenic inheritance. Trends Genet. 2022. - PubMed
Grants and funding
- 2010235-ARIAC/Service Public de Wallonie
- 2010235-ARIAC/Service Public de Wallonie
- 2010235-ARIAC/Service Public de Wallonie
- 2020 RDIR 55b/Innoviris
- 2020 RDIR 55b/Innoviris
- 2020 RDIR 55b/Innoviris
- 40008622/Fonds De La Recherche Scientifique - FNRS
- 35276964/Fonds De La Recherche Scientifique - FNRS
- 40005602/Fonds De La Recherche Scientifique - FNRS
- 27.002.53.01.4524/European Regional Development Fund
- 27.002.53.01.4524/European Regional Development Fund
- 27.002.53.01.4524/European Regional Development Fund
- I002819N/Fonds Wetenschappelijk Onderzoek
- I002819N/Fonds Wetenschappelijk Onderzoek
LinkOut - more resources
Full Text Sources
Miscellaneous
