. 2023 May 1;13(1):7072.
doi: 10.1038/s41598-023-33657-3.

Plasmodium falciparum gametocyte carriage in longitudinally monitored incident infections is associated with duration of infection and human host factors

Affiliations

Plasmodium falciparum gametocyte carriage in longitudinally monitored incident infections is associated with duration of infection and human host factors

Chiara Andolina et al. Sci Rep. .

Abstract

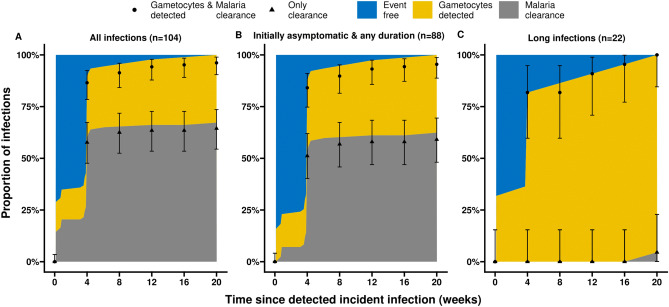
Malaria transmission depends on the presence of Plasmodium gametocytes that are the only parasite life stage that can infect mosquitoes. Gametocyte production varies between infections and over the course of infections. Infection duration is highly important for gametocyte production but poorly quantified. Between 2017 and 2019 an all-age cohort of individuals from Tororo, eastern Uganda was followed by continuous passive and routine assessments. We longitudinally monitored 104 incident infections from 98 individuals who were sampled once every 28 days and on any day of symptoms. Among infections that lasted ≥ 3 months, gametocyte appearance was near-universal with 96% of infections having detectable gametocytes prior to clearance. However, most infections were of much shorter duration; 55.7% of asymptomatic infections were detected only once. When considering all asymptomatic infections, regardless of their duration, only 36.3% had detectable gametocytes on at least one time-point prior to parasite clearance. Infections in individuals with sickle-cell trait (HbAS) were more likely to have gametocytes detected (Hazard Rate (HR) = 2.68, 95% CI 1.12, 6.38; p = 0.0231) and had gametocytes detected at higher densities (Density Ratio (DR) = 9.19, 95% CI 2.79, 30.23; p = 0.0002) compared to infections in wildtype (HbAA) individuals. Our findings suggest that a large proportion of incident infections is too short in duration and of too low density to contribute to onward transmission.


Conflict of interest statement

The authors declare no competing interests.

Figures

Figure 1
Figure 1
The duration of incident infections. Kaplan–Meier survival curves are shown for all incident infections (yellow) and for all incident infections that were initially asymptomatic (blue). The y-axis shows the probability of remaining infected (i.e. not clearing infection) before a given time (in weeks) reflected on the x-axis. Time to clearance was defined as either the time of onset of clinical symptoms (when the infection was interrupted by treatment) or the first parasite-free visit. From all 104 incident infections, 16 were symptomatic at the initial visit; these were immediately treated and considered cleared; whereas 17% (15/88) of initially asymptomatic infections (and 14.4% (15/104) of all infections) did not clear by the end of follow-up, with the longest follow-up from the initial detection of infection being 96 weeks. This is reflected by the steep drop in persistence for all infections (yellow) at time point 0. We also observed a steep descent in the probability of remaining infected at the 4 weeks visit 71% (35/49) of initially asymptomatic infections that were only detected once(at t = 0) were considered cleared at exactly this time point.
Figure 2
Figure 2
First detection of gametocytes and malaria infection clearance over time. These stacked plots show the Aalen–Johansen estimated cumulative proportion of infections that either carry detectable gametocytes (yellow) or resolve their malaria without detectable gametocytes over time -in weeks- (grey). Shown in blue is the proportion of infections that are event free over time, i.e. that have a detectable infection without detectable gametocytes. (A) Includes all 104 incident infections, symptomatic and asymptomatic. The percentage of infections having detectable gametocytes at the time of initial parasite detection (0 weeks) and by 4 weeks was 14% and 29%, respectively. (B) Includes 88 infections that were initially asymptomatic. The percentage of infections having detectable gametocytes between 0 and 4 weeks was 15.9% and 33.7%, respectively. (C) Includes 22 infections that were initially asymptomatic and had long duration of infection ( 12 weeks). The percentage of long-duration infections that had detectable gametocytes at 0 weeks, between 0–4 weeks and 0–12 weeks was 31.8%, 81.8% and 90.9%, respectively. Triangles represent observed cumulative prevalences of malaria infection clearance over time; dots represent the summed cumulative prevalences of both the first detection of gametocytes and malaria clearance (to compare with the corresponding estimates in the stacked plot). 95% confidence intervals are presented in error bars. Right-censored infection times ((infections where gametocytes were not detected or malaria clearance was not observed) were not accounted for in the numerator of the observed prevalences, hence the underestimation in the cumulative incidence compared with the stack plot in (A) and (B). Long infections (C) did not have any right-censored observations.
Figure 3
Figure 3
Gametocyte densities at different time intervals during infections. On the x-axis time in intervals is presented: T = 0 moment of infection detection (purple), 0–4 weeks (blue), 4–8 weeks (petrol), 8–12 weeks (green), 12–96 weeks (light green) post infection detection. On the y-axis are presented the observed gametocyte densities per µl. Overall gametocyte density (i.e. over the entire duration of follow-up) is presented in yellow. Gametocyte densities are presented for initially asymptomatic and gametocyte positive observations only (i.e. 32 incident infections with 155 gametocyte positive visits across them). Multiple observations from the same infection (multiple dots) may be included in the same violin plot if there were more than one gametocyte positive visit in the interval. Dots indicate raw data. The number of observations for each of the violin plots was: 14 (t = 0), 22 (t = 0–4), 17 (t = 4–8), 19 (t = 8–12), 83 (t = 12–96) at 155 (overall). Time points following parentheses are not included in the interval while those directly before square brackets are included. So the blue violin plot (0, 4] includes values from time 0 + 1 (not including 0) up to and including week 4.
Figure 4
Figure 4
Parasite density, gametocyte density and gametocyte fraction over the course of incident infections. Three separate characteristics of infections are presented: parasite density (A), gametocyte density (B) and gametocyte fraction (C). Gametocyte fraction is defined as the proportion of parasites that are gametocytes, estimated as the proportion of the total parasite biomass (i.e. varATS parasite density by qPCR. Since this assay targets DNA and thus not discriminate between life-stages, this reflects the combined density of asexual parasites and gametocytes) that consists of gametocytes (estimated by gametocyte-specific qRT-PCR that targets Ccp4 and PfMGET mRNA). All estimates are presented over time since first detection of incident infection; all associations are best described by non-linear mixed-effects models, where a random intercept is used to account for correlation between measurements from the same infection. The dots represent the raw geometric mean parasite densities averaged after the previous timepoint and up to and including the timepoint where they are indicated (i.e. the dot at week 8 represents all values from week 4 + 1 day up to (and including) week 8). (A) The y-axis shows the estimated parasite density; on x-axis the time from first detection of infection presented in weeks. Parasite density is, on average, at highest levels at the detection of incident malaria and it rapidly declines until ~ 6 weeks after detection, thereafter a slow and steady decline is observed. (B) Gametocyte densities are, on average, very low at first detection of incident malaria infections, but rapidly increase until 8 weeks later, thereafter a steady decrease is observed. (C) Over the course of an infection an increasing trend is seen for the ratio of gametocyte density over parasite density. An estimated decrease is seen at later time-points but this trend is highly uncertain, reflected in wide confidence intervals which also support an increase or a plateau.
Figure 5
Figure 5
First detection of gametocytes in relation to parasite density and infection duration. Panel (A) shows the non-linear association between parasite density/µl (natural log (ln) transformed axis) and the incidence of detectable gametocytes (per person-day), adjusted for duration of infection. Higher parasite densities are associated with higher gametocyte incidence rates up to parasite densities of ~ 5 parasites/µL. While the association is seemingly negative after this point, the wide confidence intervals (grey shaded areas) indicate high levels of uncertainty. Panel (B) presents the association between parasite density and the duration of incident infection with the cumulative incidence of gametocyte positivity. In (B), on the y axis the parasite density is expressed per µl on a natural log (ln) transformed axis, while the x axis describes the time in weeks since the first detection of infection. Low cumulative incidence is shown in blue, whilst cumulative incidences closer to 100% are shown in yellow. Expected cumulative incidences for gametocyte positivity are presented over the full duration of an infection if parasite densities would be maintained at the level given on the y-axis; the likelihood of having detectable gametocytes increases with increasing parasite density and longer time since infection.
Figure 6
Figure 6
Gametocyte density and gametocyte fraction in relation to parasite density. Parasite density/µl is plotted in natural log (ln) scale within the range of the data. In panel (A), the association of parasite density with gametocyte density is presented, adjusted for the duration of infection. We observe a positive association between total parasite density and gametocyte density. In panel (B), the association of parasite density with gametocyte fraction is presented, adjusted for the duration of infection. Higher parasite densities are associated with lower gametocyte fraction at any given moment in time. Visits when the infection was detected without detectable gametocytes were included in these analyses.

References

    1. WHO. World malaria report 2021 (Geneva, 2021).
    1. Heuschen AK, et al. Public health-relevant consequences of the COVID-19 pandemic on malaria in sub-Saharan Africa: A scoping review. Malar. J. 2021;20:339. doi: 10.1186/s12936-021-03872-2. - DOI - PMC - PubMed
    1. Uwimana A, et al. Emergence and clonal expansion of in vitro artemisinin-resistant Plasmodium falciparum kelch13 R561H mutant parasites in Rwanda. Nat. Med. 2020;26:1602–1608. doi: 10.1038/s41591-020-1005-2. - DOI - PMC - PubMed
    1. Kleinschmidt I, et al. Implications of insecticide resistance for malaria vector control with long-lasting insecticidal nets: A WHO-coordinated, prospective, international, observational cohort study. Lancet Infect. Dis. 2018;18:640–649. doi: 10.1016/S1473-3099(18)30172-5. - DOI - PMC - PubMed
    1. Eichner M, et al. Genesis, sequestration and survival of Plasmodium falciparum gametocytes: Parameter estimates from fitting a model to malariatherapy data. Trans. R Soc. Trop. Med. Hyg. 2001;95:497–501. doi: 10.1016/S0035-9203(01)90016-1. - DOI - PubMed

Publication types