. 2023 May;4(5):608-628.
doi: 10.1038/s43018-023-00548-5. Epub 2023 May 1.

The immunopeptidome landscape associated with T cell infiltration, inflammation and immune editing in lung cancer

Affiliations

The immunopeptidome landscape associated with T cell infiltration, inflammation and immune editing in lung cancer

Anne I Kraemer et al. Nat Cancer. 2023 May.

Abstract

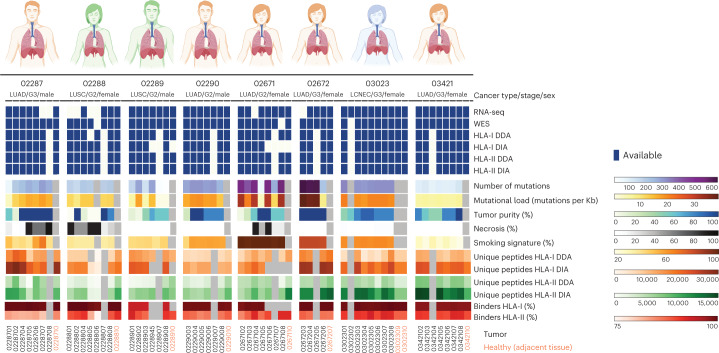
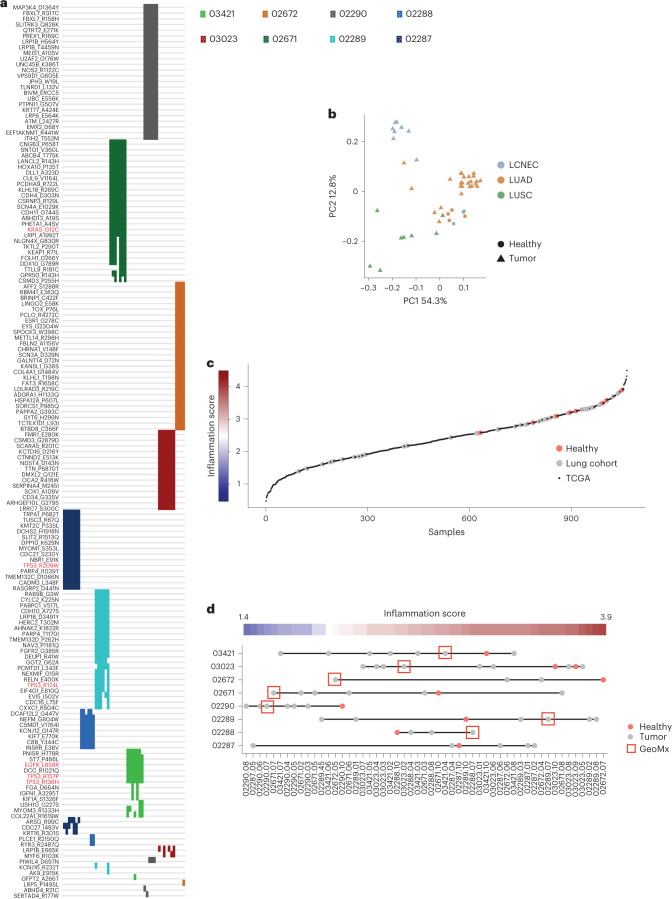
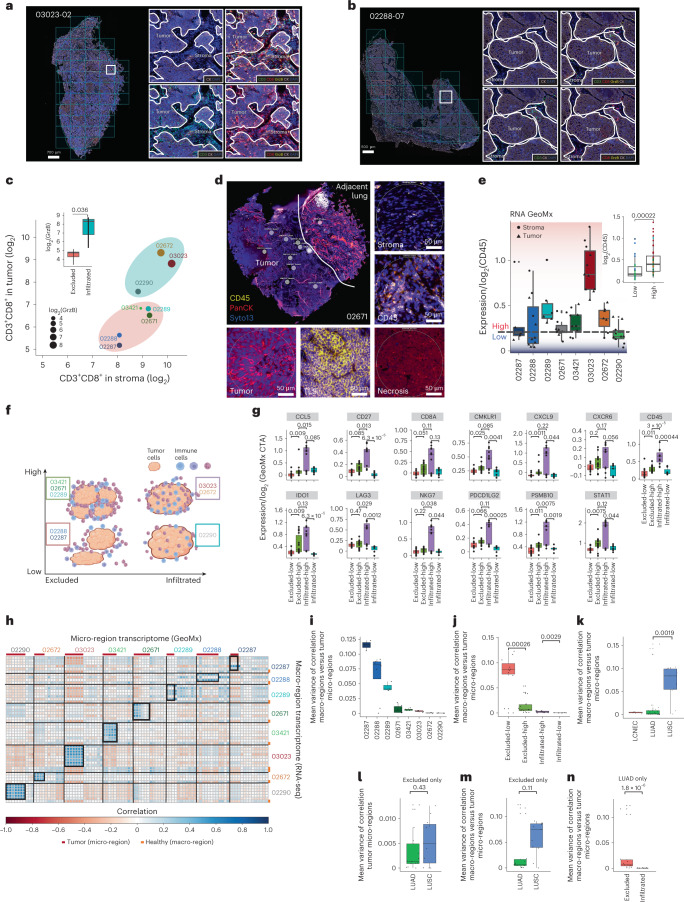
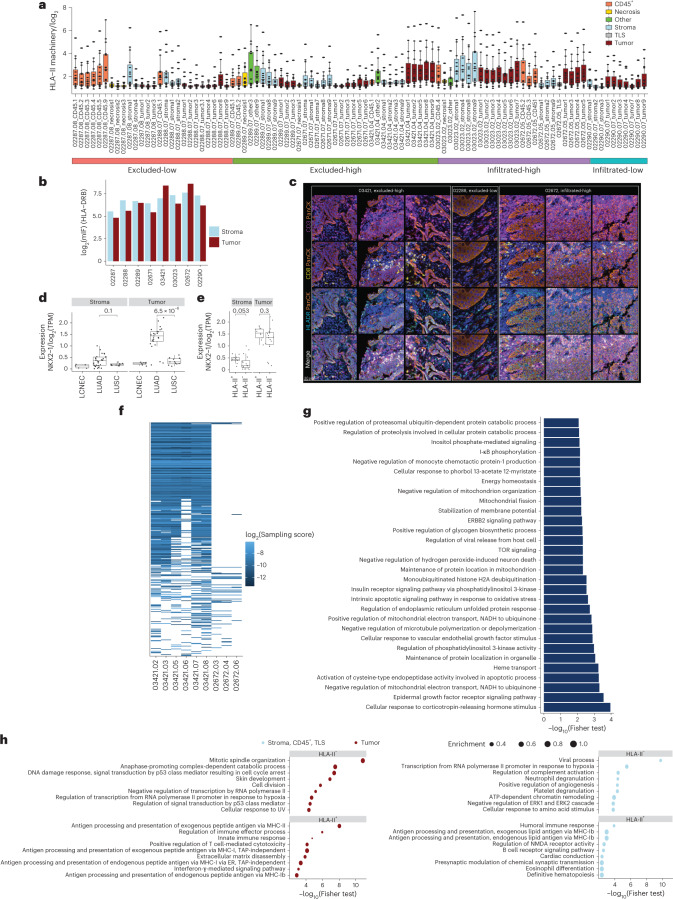
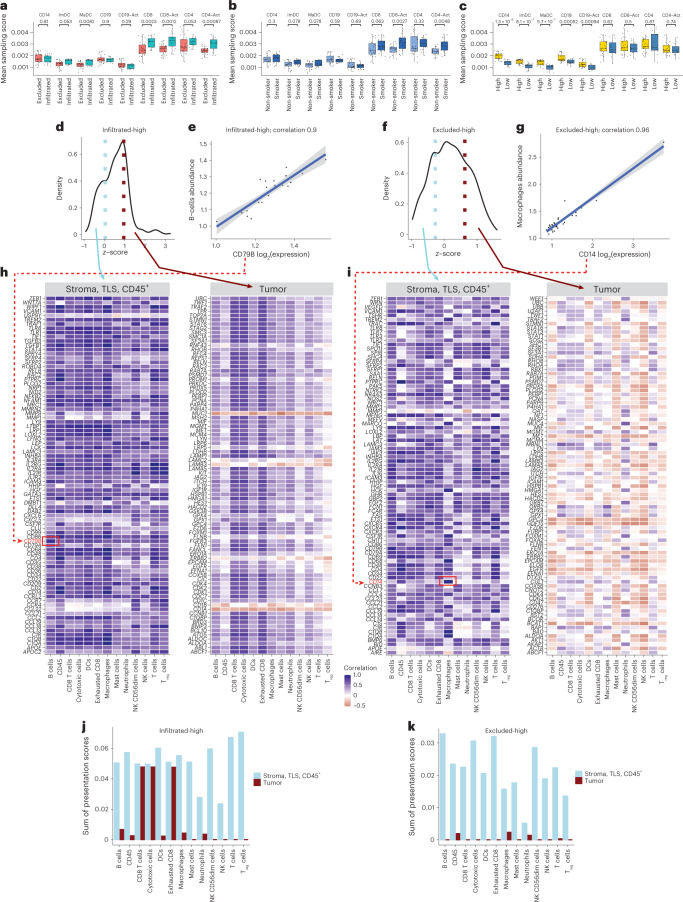
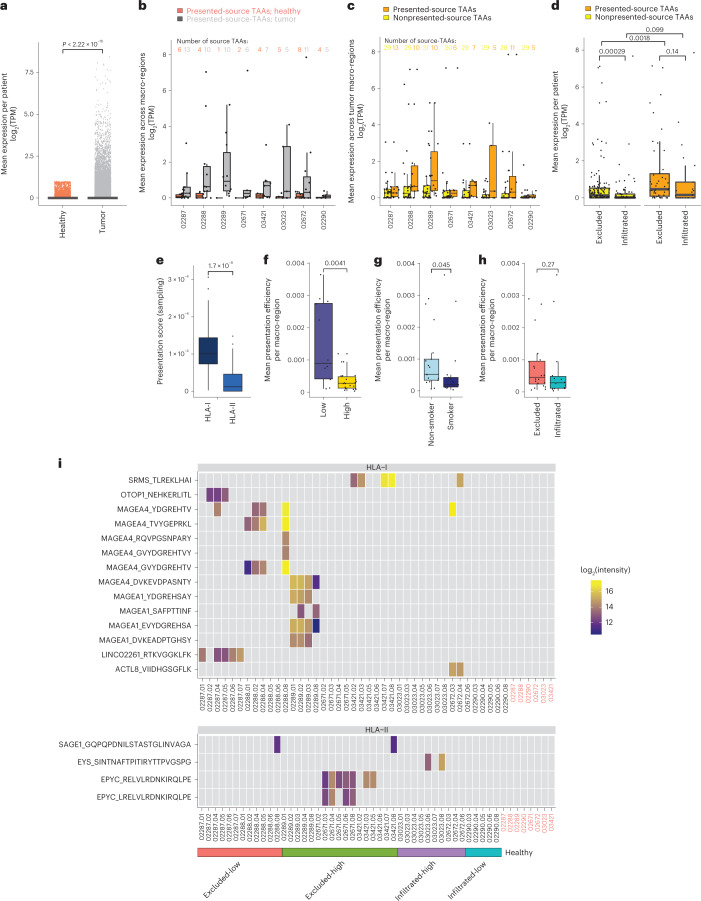
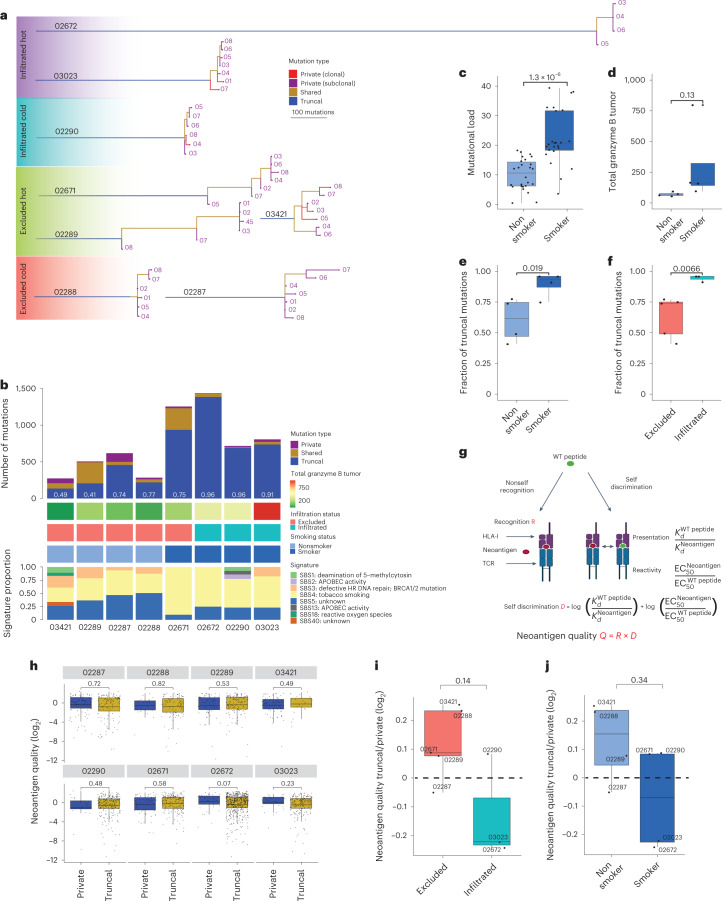
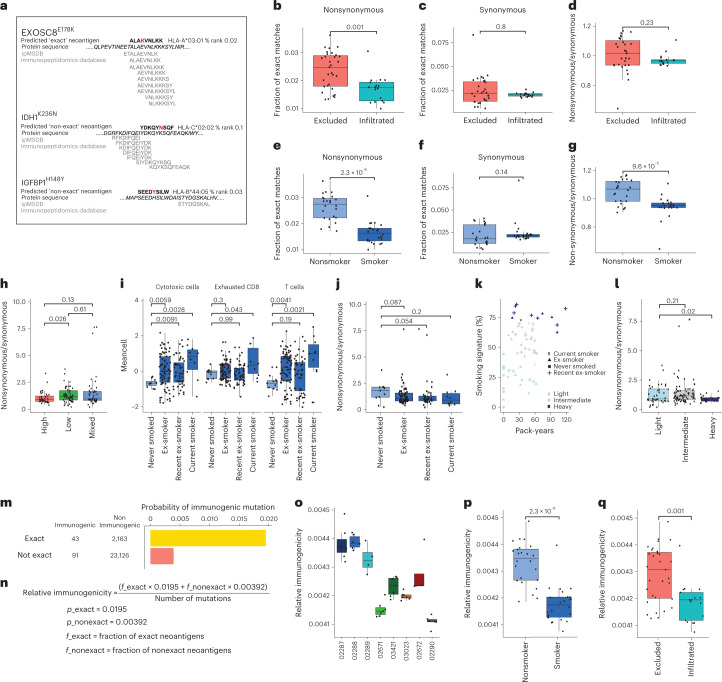
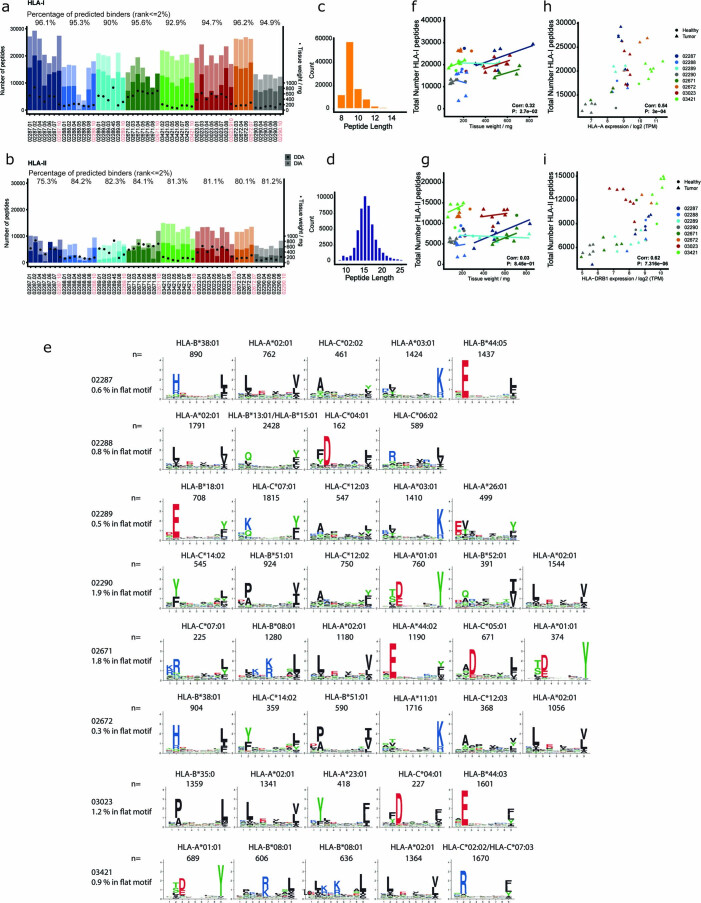
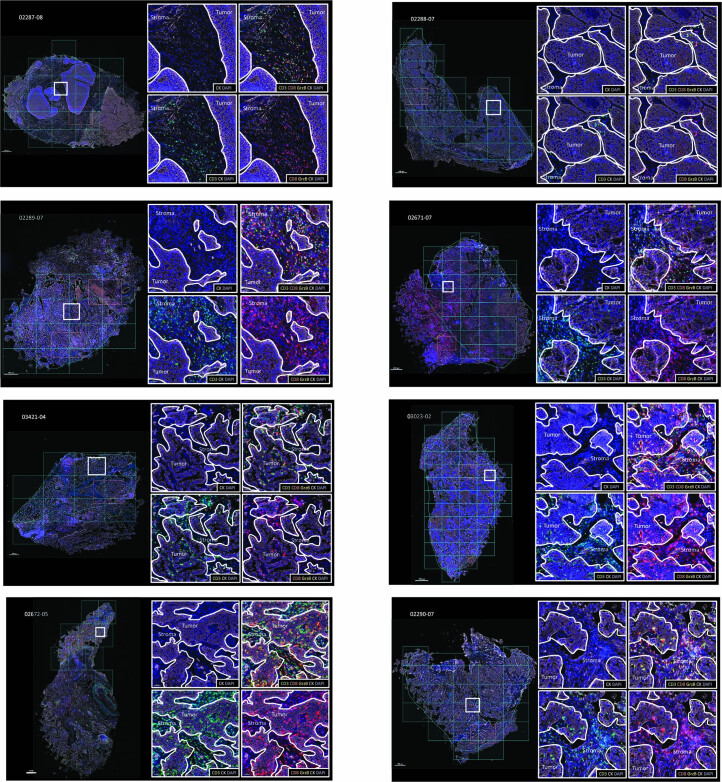
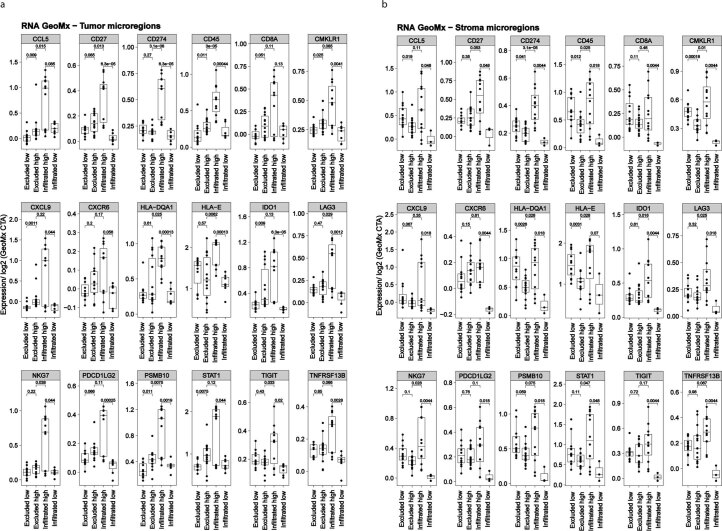
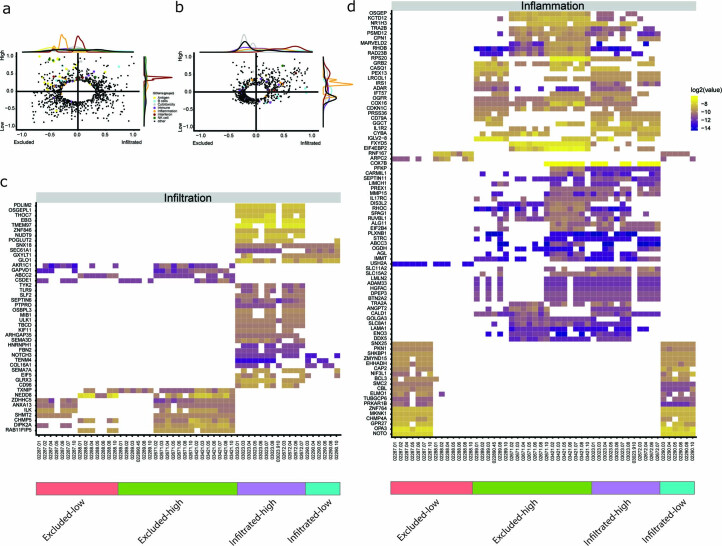
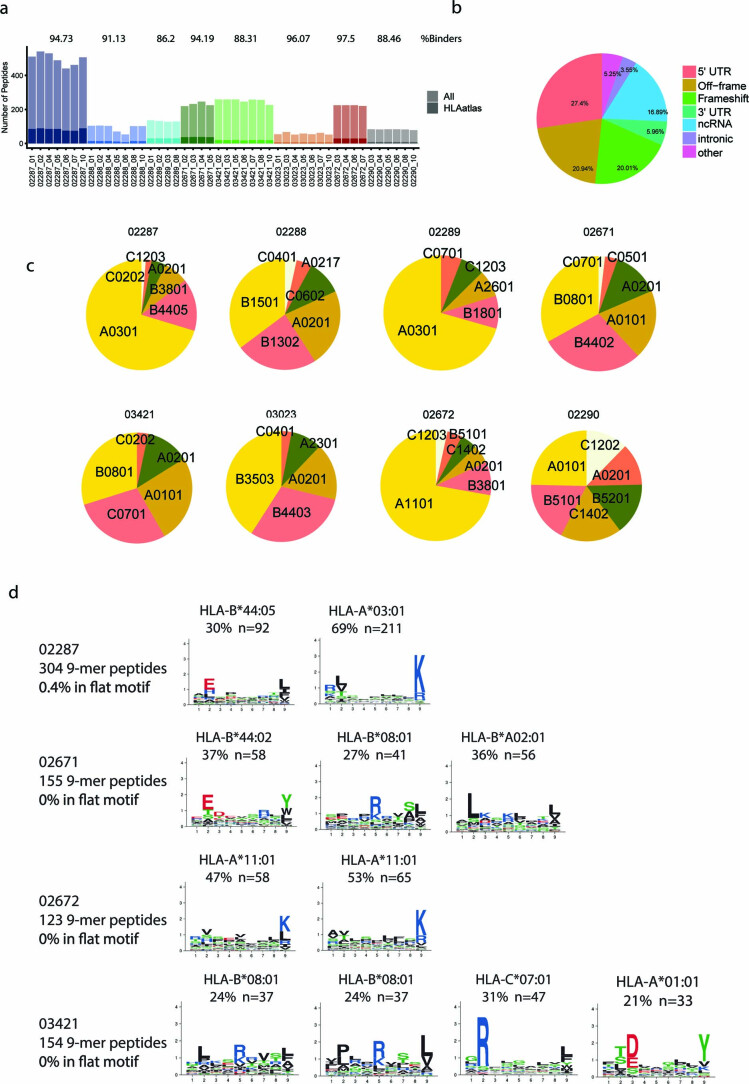
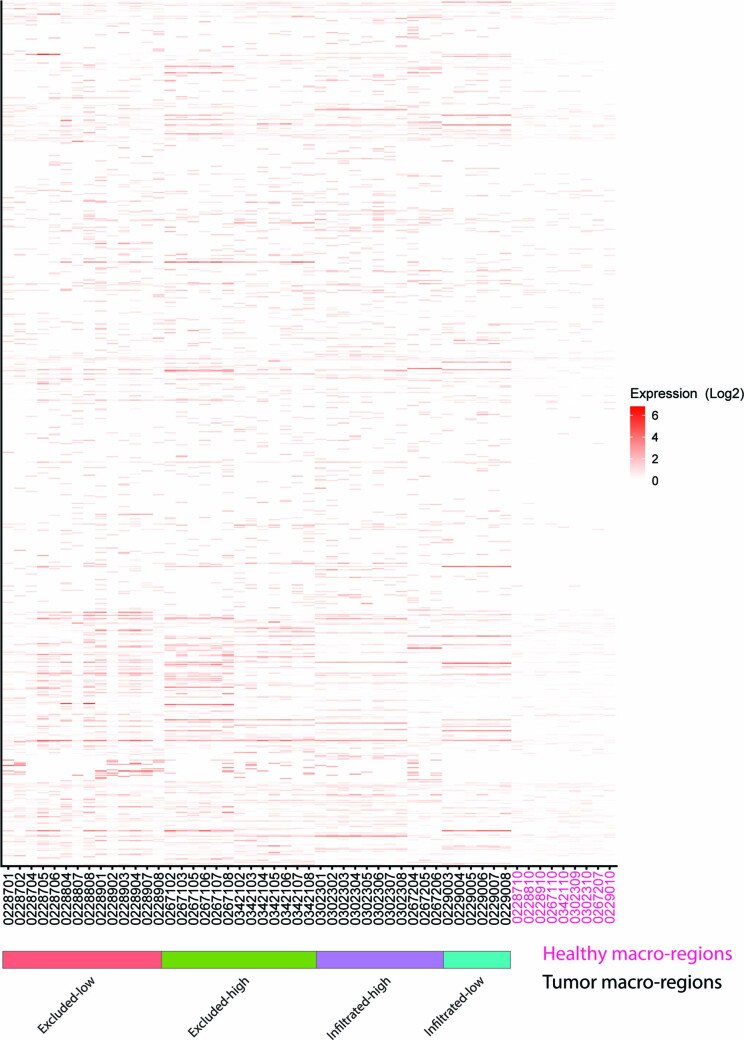
One key barrier to improving efficacy of personalized cancer immunotherapies that are dependent on the tumor antigenic landscape remains patient stratification. Although patients with CD3+CD8+ T cell-inflamed tumors typically show better response to immune checkpoint inhibitors, it is still unknown whether the immunopeptidome repertoire presented in highly inflamed and noninflamed tumors is substantially different. We surveyed 61 tumor regions and adjacent nonmalignant lung tissues from 8 patients with lung cancer and performed deep antigen discovery combining immunopeptidomics, genomics, bulk and spatial transcriptomics, and explored the heterogeneous expression and presentation of tumor (neo)antigens. In the present study, we associated diverse immune cell populations with the immunopeptidome and found a relatively higher frequency of predicted neoantigens located within HLA-I presentation hotspots in CD3+CD8+ T cell-excluded tumors. We associated such neoantigens with immune recognition, supporting their involvement in immune editing. This could have implications for the choice of combination therapies tailored to the patient's mutanome and immune microenvironment.


Conflict of interest statement

In the last 3 years, G.C. has received grants and research support or has been coinvestigator in clinical trials by Bristol-Myers Squibb, Tigen Pharma, Iovance, F. Hoffmann La Roche AG and Boehringer Ingelheim. The Lausanne University Hospital (CHUV) has received honoraria for advisory services that G.C. has provided to Genentech, AstraZeneca AG and EVIR. Patent WO2019086711A1 related to the NeoTIL technology from the Coukos laboratory has been licensed by the Ludwig Institute, also on behalf of the University of Lausanne and the CHUV, to Tigen Pharma. G.C. has previously received royalties from the University of Pennsylvania for CAR-T cell therapy licensed to Novartis and Tmunity Therapeutics. The remaining authors declare no competing interests.

Figures

Fig. 1
Fig. 1. Schematic summary of the lung cancer cohort.
A summary of tissues and analyses done on the multiregion tissues, as well as information on the number of somatic mutations affecting protein sequences passing our pipeline’s thresholds, mutational load, tumor purity, necrosis level, number of unique HLA-I and HLA-II peptides identified by mass spectrometry and the percentage of peptides predicted as binders to the respective HLA allotypes (rank <2%). Patient characteristics and processing information can also be found in Supplementary Tables 1 and 2. Source data
Fig. 2
Fig. 2. Pathogenic mutations and inflammation scores.
a, Heat map of detected mutations (n = 157 mutations) that were annotated as pathogenic by the FATHMM prediction in COSMIC. Colors represent different patients and every line is a macro-region (n = 51 macro-regions). Mutations in KRAS, TP53 and EGFR are highlighted in red. b, PCA of genes associated with either LUADs or LUSCs confirming the classification of the samples. The list of genes was taken from Reili et al. and is provided in Supplementary Table 3 (n = 53 macro-regions). c, Inflammation scores calculated for each macro-region as well as LUAD and LUSC tumors from TCGA using expression levels of the immune-related gene panel as in Danaher et al.. The different macro-regions (n = 53 macro-regions) of patients with lung cancer were superimposed on the TCGA data (n = 1,011 TCGA patients). d, Inflammation scores for each macro-region. The scatter plot denotes 53 regions of the 8 different patients; the red color denotes the healthy samples and red boxes denote the regions subjected to GeoMx analysis. In patient 02287, the tissue selected for GeoMx was not subjected to bulk RNA-seq and therefore not shown in this panel.
Fig. 3
Fig. 3. Defining tumors as excluded, infiltrated, immune low and immune high.
a,b, The mIF images of 03023-02 (a) and 02288-07 (b) demonstrating the masking approach defining infiltration of CD3+CD8+ double-positive T cells expressing GrzB within tumor and stroma. c, The mIF quantification per patient (n = 8). Infiltrated samples (n = 3) have higher GrzB expression (dot size and inlay plot) and more CD3+CD8+ T cells in tumor than in stroma (one-sided Student’s t-test, P = 0.036). d, Micro-regions manually selected without independent repetition and classified into tumor, stroma, TLSs, CD45+-rich and ‘other’. Five micro-regions of sample 02671, representing 95 micro-regions, are shown. e, CD45 expression in tumor and stroma micro-regions calculated from the GeoMx transcriptome. The blue–red line and color scale denote the threshold classifying immune-high and immune-low tumors. Inset: CD45 expression in immune-high (n = 44 stroma and tumor micro-regions) or immune-low (n = 26 stroma and tumor micro-regions). f, Scheme of our relative classification. g, Expression in tumor micro-regions of immune activation markers calculated from the GeoMx transcriptome (excluded-high: n = 14; excluded-low: n = 11; infiltrated-high: n = 11; infiltrated-low: n = 7). h, The transcriptomes of all micro-regions (n = 95, GeoMx) were correlated with all macro-regions (n = 53, bulk RNA). The black boxes highlight correlations considering tumoral micro-regions per patient. i, The mean variance of these correlations in the boxes calculated as variance of correlation coefficients per patient. j, Increasing variance from tumors marked as infiltrated-low (02290, n = 7 tumor micro-regions), infiltrated-high (03023, 02672, n = 11 tumor micro-regions), excluded-high (02289, 02671 and 03421, n = 14 tumor micro-regions) and excluded-low (02287, 02288, n = 11 tumor micro-regions). k, LUSC tumors exhibiting a higher variance. l, In excluded tumors, the variance of correlation between tumoral micro-regions shown to be similar in LUADs (02287, 02671 and 03421, n = 14 tumor micro-regions) and LUSCs (02288 and 02289, n = 11 tumor micro-regions). m, The variance of correlation between macro- and micro-regions in excluded tumors. n, LUADs showing a significantly higher variance between micro- and macro-regions in excluded tumors (n = 14 micro-regions) rather than in infiltrated tumors (n = 11 micro-regions). Apart from c, one-sided Wilcoxon’s nonparametric tests were used. All boxplots show the median (line), the interquartile range (IQR) between the 25th and 75th percentiles (box) and 1.5× the IQR ± the upper and lower quartiles, respectively. No adjustments were made for multiple testing.
Fig. 4
Fig. 4. Overview of HLA-II expression.
a, Expression of genes of the HLA-II presentation machinery (HLA-DRA, HLA-DRB, HLA-DRB-3/4/5, HLA-DOA, HLA-DOB, HLA-DQA-1/2, HLA-DQB-1/2, HLA-DPA1, HLA-DPB1, HLA-DMA, HLA-DMB, CTSS and CD74) across all measured GeoMx regions (n = 95 micro-regions). b, Quantification of HLA-DRB expression in stroma and tumor regions by mIF. c, HLA-DR molecules expressed on the surface of cancer cells detected only in 03421 and 02672 samples with these tumors assigned as HLA-II+, representing n = 2 patients. Sample 02288 is shown as an example of an HLA-II tumor, representing n = 6 patients. d, Expression of the transcription factor NKX2-1 in stroma (LUADs: n = 28; LUSCs: n = 9; LCNECs: n = 5) and tumor micro-regions (LUADs: n = 25; LUSCs: n = 11; LCNECs: n = 7) in LCNEC, LUAD and LUSC tumors. e, Expression of NKX2-1 in stroma, TLS and the CD45+ micro-regions (depicted here are stroma) and in tumor micro-regions in HLA-II+ (tumor: n = 12; stroma: n = 16), HLA-II (tumor: n = 16, stroma: n = 9) and LUAD tumors. f,g, HLA-II sampling scores of source genes not found to be presented in any of the healthy tissues and found presented exclusively in HLA-II+ tumors (f) and their GO enrichment analysis (g). TOR, target of rapamycin. h, GO analysis of genes with higher expression in HLA-II+ (n = 12 tumor micro-regions; n = 16 stroma, TLS and CD45+ micro-regions) versus HLA-II (n = 16 tumor micro-regions; n = 19 stroma, TLS and CD45+ micro-regions). ER, endoplasmic reticulum; NMDA, N-methyl-d-aspartate; UV, uiltraviolet light. Top terms, according to the P value (Fisher’s exact test), are displayed. All statistical tests have been performed as one-sided Wilcoxon’s nonparametric test. All boxplots show the median (line), the IQR between the 25th and 75th percentiles (box) and 1.5× the IQR ± the upper and lower quartiles, respectively. No adjustments were made for multiple testing.
Fig. 5
Fig. 5. CD3+CD8+ T cell infiltration impacts the HLA-II immunopeptidome.
ac, Contribution of immune cells to the HLA-II immunopeptidome based on sampling scores of immune cell markers in tumors annotated as excluded (n = 29 tumor macro-regions) (a) and infiltrated (n = 15 tumor macro-regions), nonsmokers (n = 21 tumor macro-regions) and smokers (n = 23 tumor macro-regions) (b) and immune-high (n = 27 tumor macro-regions) and immune-low (n = 17 tumor macro-regions) (c) per cell type. P values were calculated using one-sided Wilcoxon’s test. The boxplots show the median (line), the IQR between the 25th and 75th percentiles (box) and 1.5× the IQR ± the upper and lower quartiles, respectively. No adjustments were made for multiple testing. d, The z-score distribution of the gene expression comparisons of tumor versus stroma + TLS + CD45+ micro-regions in the infiltrated-high samples. Genes in the upper quartile are more highly expressed in tumor micro-regions whereas those in the lower quartile are highly expressed in stroma micro-regions. e, Example of correlation of CD79B expression and B cell abundance in infiltrated-high samples (n = 26 stroma + TLS + CD45+ and tumor micro-regions). The error bands represent the 95% CI. f, The z-score distribution of the gene expression comparisons of tumor versus stroma + TLS + CD45+ micro-regions in excluded-high samples. g, Example of correlation of CD14 expression and macrophage abundance in excluded-high tumors (n = 34 stroma + TLS + CD45+ and tumor micro-regions). The error bands represent the 95% CI. h,i, Correlation of all genes attributed to stroma + TLS + CD45+ micro-regions (lower quartile) or with tumor micro-regions (upper quartile) with cell-type abundance in infiltrated-high (h) and excluded-high (i) samples. DCs, dendritic cells; NK cells, natural killer cells; Treg cells, regulatory T cells. j,k, Sum of sampling score for genes correlates with different immune cell type (Pearson’s correlation r > 0.5) in infiltrated-high (n = 2 patients and n = 163 genes) (j) and excluded-high (n = 3 patients and n = 168 genes) (k).
Fig. 6
Fig. 6. Expression and presentation of tumor-associated genes.
a, Tumor-associated source genes from canonical and noncanonical sources (n = 893 genes), collectively named TAAs, expressed in any of the tumor macro-regions but not in the GTEx databases (GTEx ≤ 1 TPM, except in testis) and not in any of the adjacent healthy macro-regions (≤1 TPM) defined by Wilcoxon’s one-sided test P = 2.22 × 10−16. No adjustments were made for multiple comparison. b,c, Across patients, there was higher expression of presented-source TAAs in tumor macro-regions than in the adjacent healthy macro-regions (n = 29 TAAs) (b) and higher expression of nonpresented-source TAAs (n = 31 TAAs) (c). d,e, Presented-source TAAs (n = 31 TAAs) expressed more abundantly across CD3+CD8+ T cell-excluded macro-regions (nonpresented_excluded: n = 148; presented_excluded: n = 45; nonpresented_infiltrated: n = 86; presented_infiltrated: n = 22; n refers to aggregated TAAs expression per macro-region) (d) and presented mainly by HLA-I complexes (averaged across n = 41 HLA-I versus n = 43 HLA-II macro-regions, respectively; P = 1.7 × 10−8) (e). fh, The presentation efficiency of TAAs seen as higher in macro-regions of tumors assigned as immune-low (n = 12 macro-regions) versus immune-high (n = 22 macro-regions) (f), nonsmokers (n = 17 macro-regions) versus smokers (n = 17 macro-regions) (g) and CD3+CD8+ T cell excluded (n = 20 macro-regions) versus infiltrated (n = 14 macro-regions) (h), with P values of 0.0041, 0.045 and 0.27, respectively. i, Heat map of source TAAs found to be presented exclusively in tumor macro-regions. Non-normalized log2(peptide intensity values) from the DIA analyses are shown. All statistical tests were performed as one-sided Wilcoxon’s nonparametric test.
Fig. 7
Fig. 7. Evidence of neoantigen-mediated immune editing leading to a higher fraction of truncal mutation yet with lower quality.
a, Phylogenetic trees based on all high-confidence mutations found across all regions per patient. b, The number of private, shared and truncal mutations in each patient plotted and fraction of truncal mutations calculated per patient (white numbers). For each patient, GrzB expression in tumor subregions based on mIF analysis and the defined CD3+CD8+ T cell infiltration status is indicated. Smoking status was defined based on deconvolution of the eight different mutational signatures and comparison to known mutational signatures from Alexandrov et al. with a threshold of >50% for tobacco smoking signature. c,d, Positive correlations found between the TMB and the smoking status (smokers n = 24 macro-regions; nonsmokers: n = 26 macro-regions; one-sided Student’s t-test P = 1.3 × 10−6) (c), as well as between the expression of GrzB in tumor subregions (smokers: n = 4 patients; nonsmokers: n = 4 patients; mIF, one-sided Student’s t-test P = 0.13) (d). e,f, A higher fraction of truncal (clonal) mutations was found to be significantly associated with smoking status (smokers: n = 4 patients; nonsmokers: n = 4 patients; one-sided Student’s t-test P = 0.019) (e) and with CD3+CD8+ T cell infiltration (infiltrated: n = 3 patients; excluded: n = 5 patients; one-sided Student’s t-test P = 0.0066) (f). g, Schematic overview of the predicted neoantigen quality model from Łuksza et al.. h, Neoantigen quality score distributions of private and truncal mutations in each patient (02287: n = 99/121; 02288: n = 26/92; 02289: n = 79/130; 03421: n = 68/24; 02290: n = 21/225; 02671: n = 59/187; 02672: n = 38 of 489; 03023: n = 32/191 (private neoantigens/truncal neoantigens)). i,j, The ratio between the neoantigen quality of truncal versus private mutations in excluded and infiltrated tumors (excluded: n = 5 patients; infiltrated: n = 3 patients; boxplot lines show the mean) (i), as well as in nonsmokers (n = 4 patients) and smokers (n = 4 patients) (j). Unless indicated otherwise, all statistical tests were performed as one-sided Wilcoxon’s nonparametric test and boxplots show the median (line), the IQR between the 25th and 75th percentiles (box) and 1.5× the IQR ± the upper and lower quartiles, respectively. No adjustments were made for multiple testing.
Fig. 8
Fig. 8. Evidence of neoantigen-mediated immune editing.
a, EXOSC8E178K, an example of ‘exact’ HLA-I presentation hotspot neoantigen. IDH1K236N and IGFBP1H148Y are examples of ‘nonexact’. b, The fraction of predicted neoantigens with nonsynonymous mutations matching ‘exact’ wild-type peptides in ipMSDB that is significantly higher in excluded (n = 31 macro-regions) than in infiltrated (n = 17 macro-regions) tumors (P = 0.001). c, No difference found when considering predicted neoantigens with synonymous mutations (P = 0.8, n as in b). d, Enrichment of ‘exact’ neoantigens in excluded tumors of nonsynonymous versus synonymous mutations per patient (P = 0.054). e, The fraction of nonsynonymous ‘exact’ neoantigens shown to be significantly higher in nonsmokers (n = 24 macro-regions) than in smokers (n = 24 macro-regions; two macro-regions were excluded because of lack of neoantigens) (P= 3.1 × 10−8). f, No difference found when considering synonymous mutations (P = 0.2, n as above). g, In smokers versus nonsmokers, significant enrichment per patient (P = 4.3 × 10−6, n as above). h, Similar enrichment in immune-high (n = 38 samples), -low (n = 52 samples) and -mixed (n = 46 samples) tumors of the TRACERx cohort. i, Mean expression of immune markers in TRACERx cohort grouped by smoking status (never-smokers: n = 11; ex-smokers: n = 73; recent ex-smokers: n = 48; current smokers: n = 10; n refers to samples). j, The enrichment per smoking status. k, TRACERx cohort re-classified (light: n = 39; intermediate: n = 76; and heavy smokers: n = 21; n refers to samples), considering mutational signature of tobacco smoking and pack-years. l, The enrichment in the refined classification. m, Probability of inducing spontaneous CD8+ T cell responses to ‘exact’ and ‘nonexact’ neoantigens calculated using Gartner et al.’s cohort of validated immunogenic mutations. n, Parameters used to calculate the relative immunogenicity per macro-region. o, The relative immunogenicity of our eight patients. p,q, Relative immunogenicity shown to be higher in nonsmokers (n = 24) versus smokers (n = 24) (p) and in excluded (n = 31) versus infiltrated tumors (n = 17) (q), P = 2.3 × 10−8 and 0.001, respectively (n refers to macro-regions). One-sided Wilcoxon’s nonparametric test was used for bg, p and q and one-sided Student’s t-test for hj and l. Boxplots show the median (line), IQR between the 25th and 75th percentiles (box) and 1.5× the IQR ± the upper and lower quartiles. No multiple testing adjustments were made.
Extended Data Fig. 1
Extended Data Fig. 1. Mass spectrometry based immunopeptidomics performed on the different macro-region tissues.
a, HLA-I and b, HLA-II. DIA (light bars) analyses increased the number of identified peptides by up to 100% compared to DDA (solid bars). Peptide counts in the adjacent healthy macro-regions fall into the same range as the cancer samples. The average percentage of peptides predicted to bind the respective HLA allotypes in each patients are indicated above the bars. Peptide length distributions of c, HLA-I and d, HLA-II immunopeptidomics datasets. e Clustering of randomly selected 5000 HLA-I peptides per patient revealed the expected consensus binding motifs. Multiple specificity was observed for allele HLA-B*08:01 in patient 03421. The number of identified f, HLA-I (n = 102323 peptides) and g, HLA-II bound peptides (n = 53343 peptides) correlated with the starting tissue amount per patient (n = 53 macro-regions) but not across patients (p values 0.027 and 0.845, respectively). Across patients (N = 8 patients), a positive significant correlation was found between the number of identified h, HLA-I and i, HLA-II peptides with expression levels of HLA-A (p value 0.0003, Pearson cor= 0.54) and HLA-DRB1 (p value 7.3e-06, Pearson cor=0.62), respectively (n = 46 macro-regions with RNAseq and DIA data). For the correlation shown in f-i only macro-regions with DIA measurements were included (n = 53 macro-regions).
Extended Data Fig. 2
Extended Data Fig. 2. mIF imaging of all patient samples.
The masking approach used to define infiltration of CD3+CD8+ double-positive T cells expressing granzyme B (GrzB) within tumor and stroma niches is shown for all patients.
Extended Data Fig. 3
Extended Data Fig. 3. Expression of various immune activation markers calculated from RNA GeoMx transcriptome atlas data.
a, Expression of immune activation makers in tumor micro-regions (Excluded-high: n = 14, excluded-low: n = 11, infiltrated-high: n = 11, infiltrated-low: n = 7 and b, stroma Excluded-high: n = 15, excluded-low: n = 12, infiltrated-high: n = 12, infiltrated-low: n = 3, n refers to tumor micro-regions. Statistical tests have been performed as a one-sided Wilcoxon non-parametric test and, boxplots show the median (line), the interquartile range (IQR) between the 25th and 75th percentile (box) and 1.5*IQR + /- the upper and lower quartile respectively.
Extended Data Fig. 4
Extended Data Fig. 4. HLA-II peptides as biomarkers of infiltration and inflammation.
2D Gene-Ontology enrichment analysis on a, the gene level (bulk RNAseq) and on b, the HLA-II presentation sampling score of source genes (HLA-II peptidomics). Immune associated terms were highlighted in color. GO categories with a combined rank (distance to origin) smaller than 0.3 and 0.2 for RNA and DIA respectively are not displayed. HLA-II presented source genes mapped to the GO terms shown in c, were filtered further to retain those genes associated with infiltration, which are exclusively present in tumors from c, either infiltrated or excluded samples and d, those associated with inflammation, that were found exclusively in either immune-high or -low samples. Only source genes detected in ≥50% of the macro-regions were retained.
Extended Data Fig. 5
Extended Data Fig. 5. Contribution of immune cells to the HLA-I immunopeptidome.
The contribution of immune cells was calculated based on sampling scores of immune cell markers in tumors annotated as a, excluded (n = 26 macro-regions) and infiltrated (n = 15 macro-regions), b, non-smokers (n = 22 macro-regions) and smokers (n = 19 macro-regions), and c, immune high (n = 24 macro-regions) and low (n = 17 macro-regions), per cell type. P values were calculated with a one-sided wilcoxon test. Boxplots show the median (line), the interquartile range (IQR) between the 25th and 75th percentile (box) and 1.5*IQR +/− the upper and lower quartile respectively.
Extended Data Fig. 6
Extended Data Fig. 6. CD3+CD8+ T cell infiltration impact the HLA-II immunopeptidome.
a, The relative amount of immune cells in each micro-region calculated on the gene list of Danaher et al. using the GeoMx transcriptome data. Z-score distribution of the gene expression comparisons of tumor versus stroma, TLS, and CD45+ micro-regions in b, excluded-low (n = 2 and 256 genes) and c, infiltrated-low (n = 1 and 369 genes) samples. Correlation of all genes attributed to stroma, TLS, and CD45+ micro-regions (lower quartile) or with tumor micro-regions (upper qurtile) with d, cell type abundance in excluded-low and e, infiltrated-low samples. Sum of sampling score for genes correlating with any immune cell type (Pearson Correlation r > 0.5) per cell type in f, excluded-low (n = 2 patients and n = 62 genes) and g, infiltrated-low samples (n = 1 patient and n = 169 genes).
Extended Data Fig. 7
Extended Data Fig. 7. Overview of HLA-I peptides from non-canonical and transposable elements identified by hybrid DIA mass spectrometry based immunopeptidomics.
Peptides mapping uniquely to non-canonical and transposable element (TE) sources were analyzed. a, numbers of peptides (n = 992 peptides) from non-canonical and TE sources, shading indicates peptides also found in the HLA-atlas. b, Distribution of identified peptides with respect to gene genomic categories. c, Distribution of HLA alleles per patient that have the best binding prediction for all NC/TE peptides (n = 992 peptides). d, Most important motif for all NC and TE peptides for 3 patients including the percentage of binders and peptide clustering to reveal the binding motifs N is given in the panel.
Extended Data Fig. 8
Extended Data Fig. 8. Expression and presentation of non-canonical and TE sources across the macro-regions.
Non-canonical and TE sources (n = 992 peptides and n = 842 source-genes) that were found to be presented were uniformly a, presented and b, expressed across tumors (n = 44 macro-regions) as well as in the adjacent healthy tissues (n = 8 macro-regions).
Extended Data Fig. 9
Extended Data Fig. 9. Overview of HLA-I peptides nuORF sources identified by hybrid DIA mass spectrometry based immunopeptidomics.
Peptides mapping uniquely to nuORF sources were analyzed a numbers of peptides (n = 1383 peptides) from nuORF, shading indicates peptides also found in the HLA-atlas. b Distribution of identified peptides with respect to seven genomic categories. c Distribution of HLA alleles per patient that have the best binding prediction for all nuORF peptides (n = 1383 peptides). d Most important motifs for all nuORF peptides for four patients. including the percentage of binders and peptide clustering to reveal the binding motifs are shown in the panel.
Extended Data Fig. 10
Extended Data Fig. 10. The expression values of the set of tumor specific TAA genes.
TAAs were found to be expressed in any of the tumor macro-regions but not in the GTEx databases (GTEx≤1TPM, except in testis) and not in any of the adjacent healthy macro-regions (≤1TPM).

Comment in

References

    1. Rosenthal R, et al. Neoantigen-directed immune escape in lung cancer evolution. Nature. 2019;567:479–485. doi: 10.1038/s41586-019-1032-7. - DOI - PMC - PubMed
    1. Galon J, et al. The immune score as a new possible approach for the classification of cancer. J. Transl. Med. 2012;10:1–4. doi: 10.1186/1479-5876-10-1. - DOI - PMC - PubMed
    1. Sharma P, Hu-Lieskovan S, Wargo JA, Ribas A. Primary, adaptive, and acquired resistance to cancer immunotherapy. Cell. 2017;168:707–723. doi: 10.1016/j.cell.2017.01.017. - DOI - PMC - PubMed
    1. Zhang L, et al. Intratumoral T cells, recurrence, and survival in epithelial ovarian cancer. N. Engl. J. Med. 2003;348:203–213. doi: 10.1056/NEJMoa020177. - DOI - PubMed
    1. Pfirschke, C. et al. Immunogenic chemotherapy sensitizes tumors to checkpoint blockade therapy. Immunity44, 343–354 (2016). - PMC - PubMed

Publication types

Substances