An official website of the United States government
The .gov means it’s official.
Federal government websites often end in .gov or .mil. Before
sharing sensitive information, make sure you’re on a federal
government site.
The site is secure.
The https:// ensures that you are connecting to the
official website and that any information you provide is encrypted
and transmitted securely.
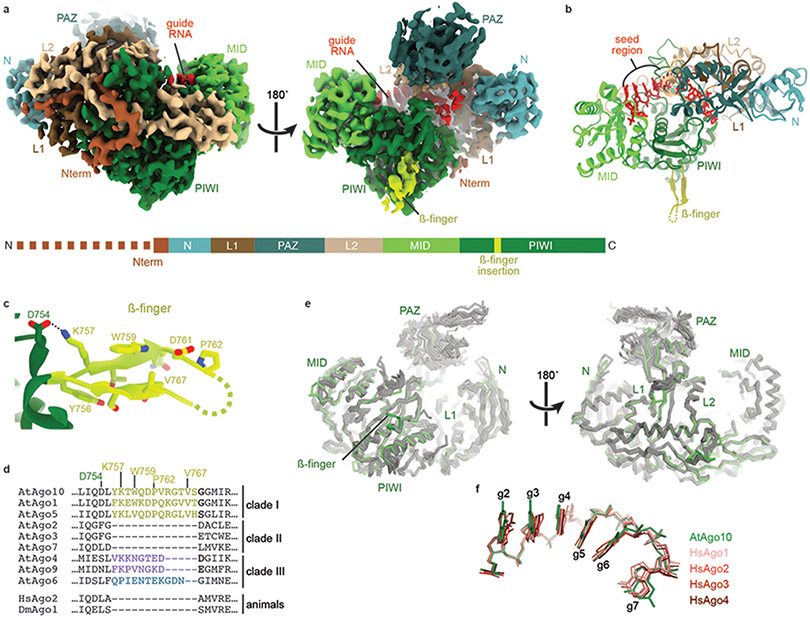
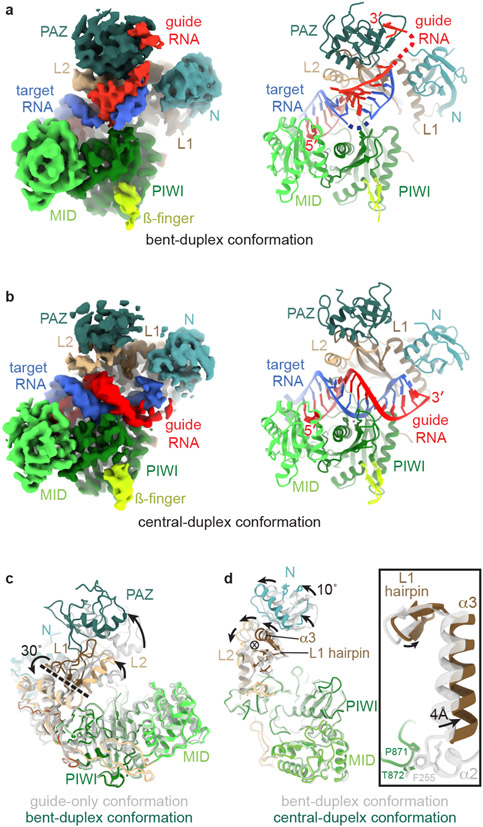
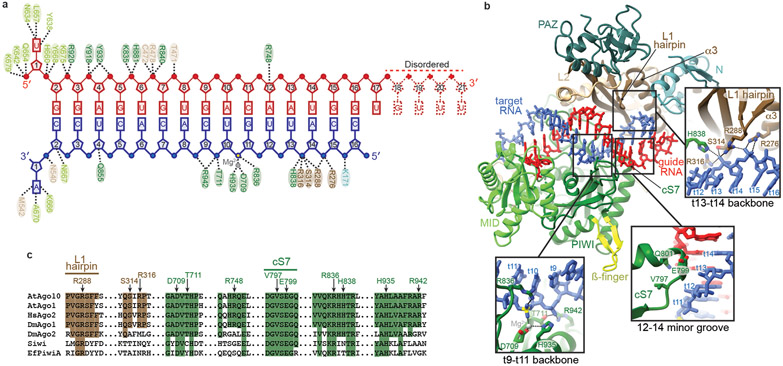
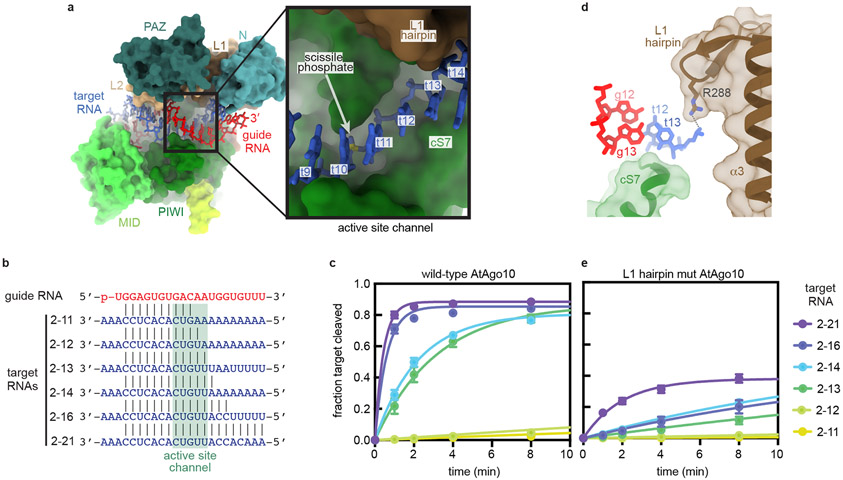
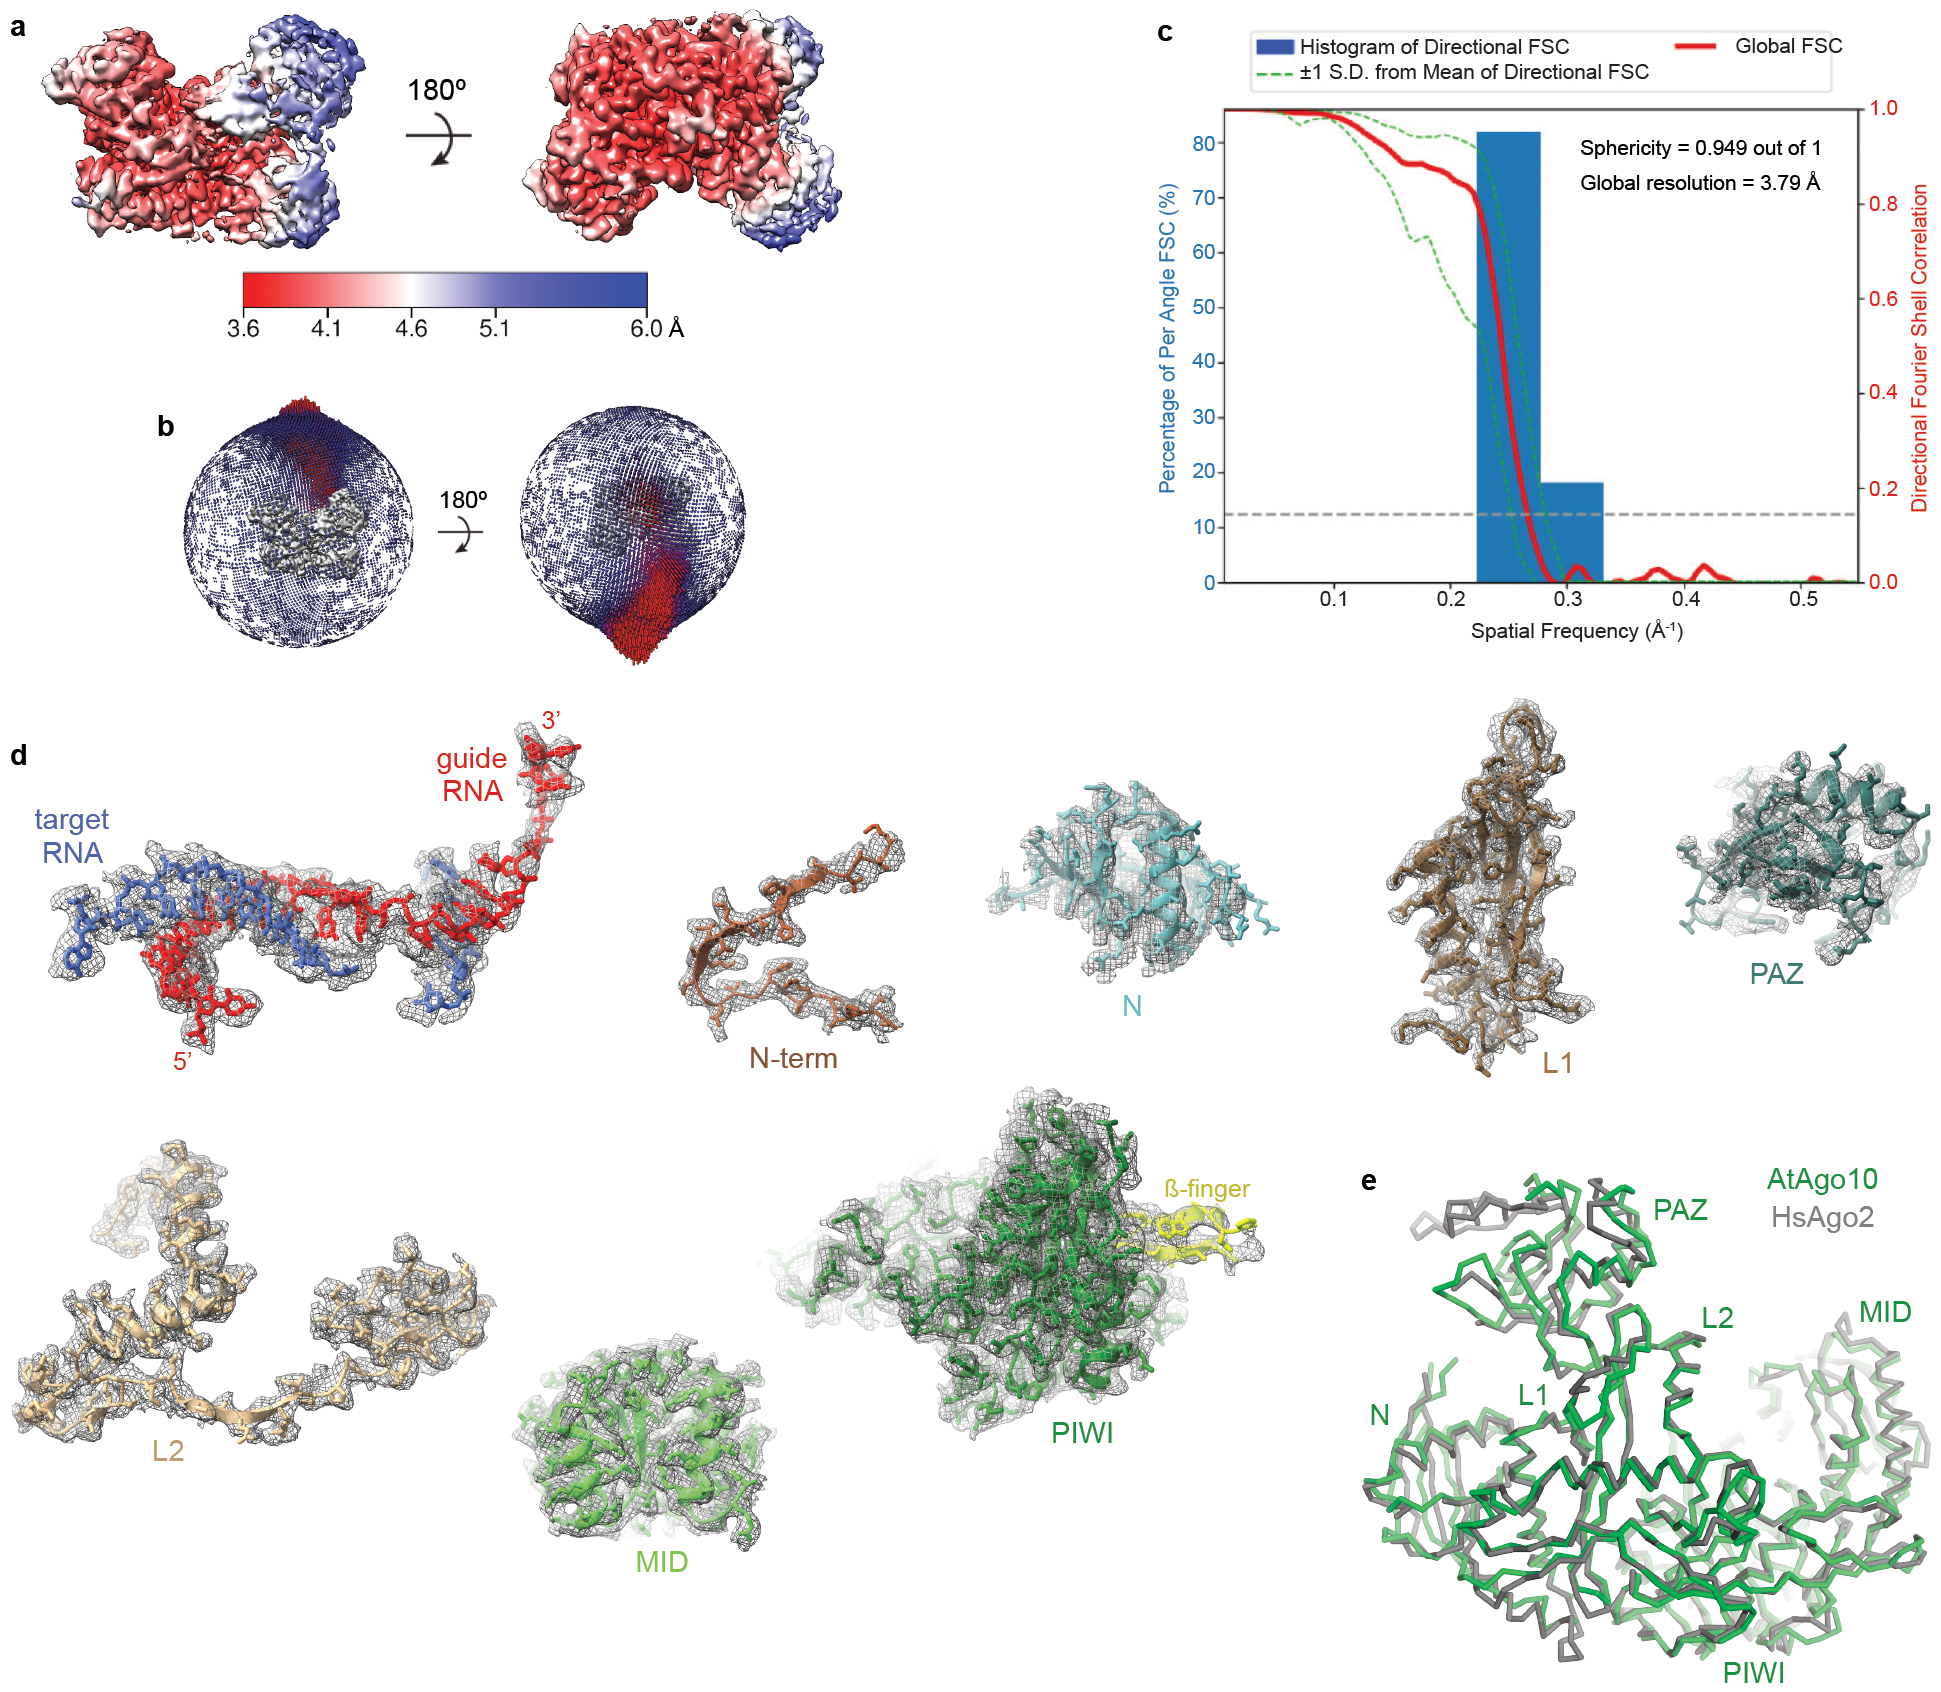
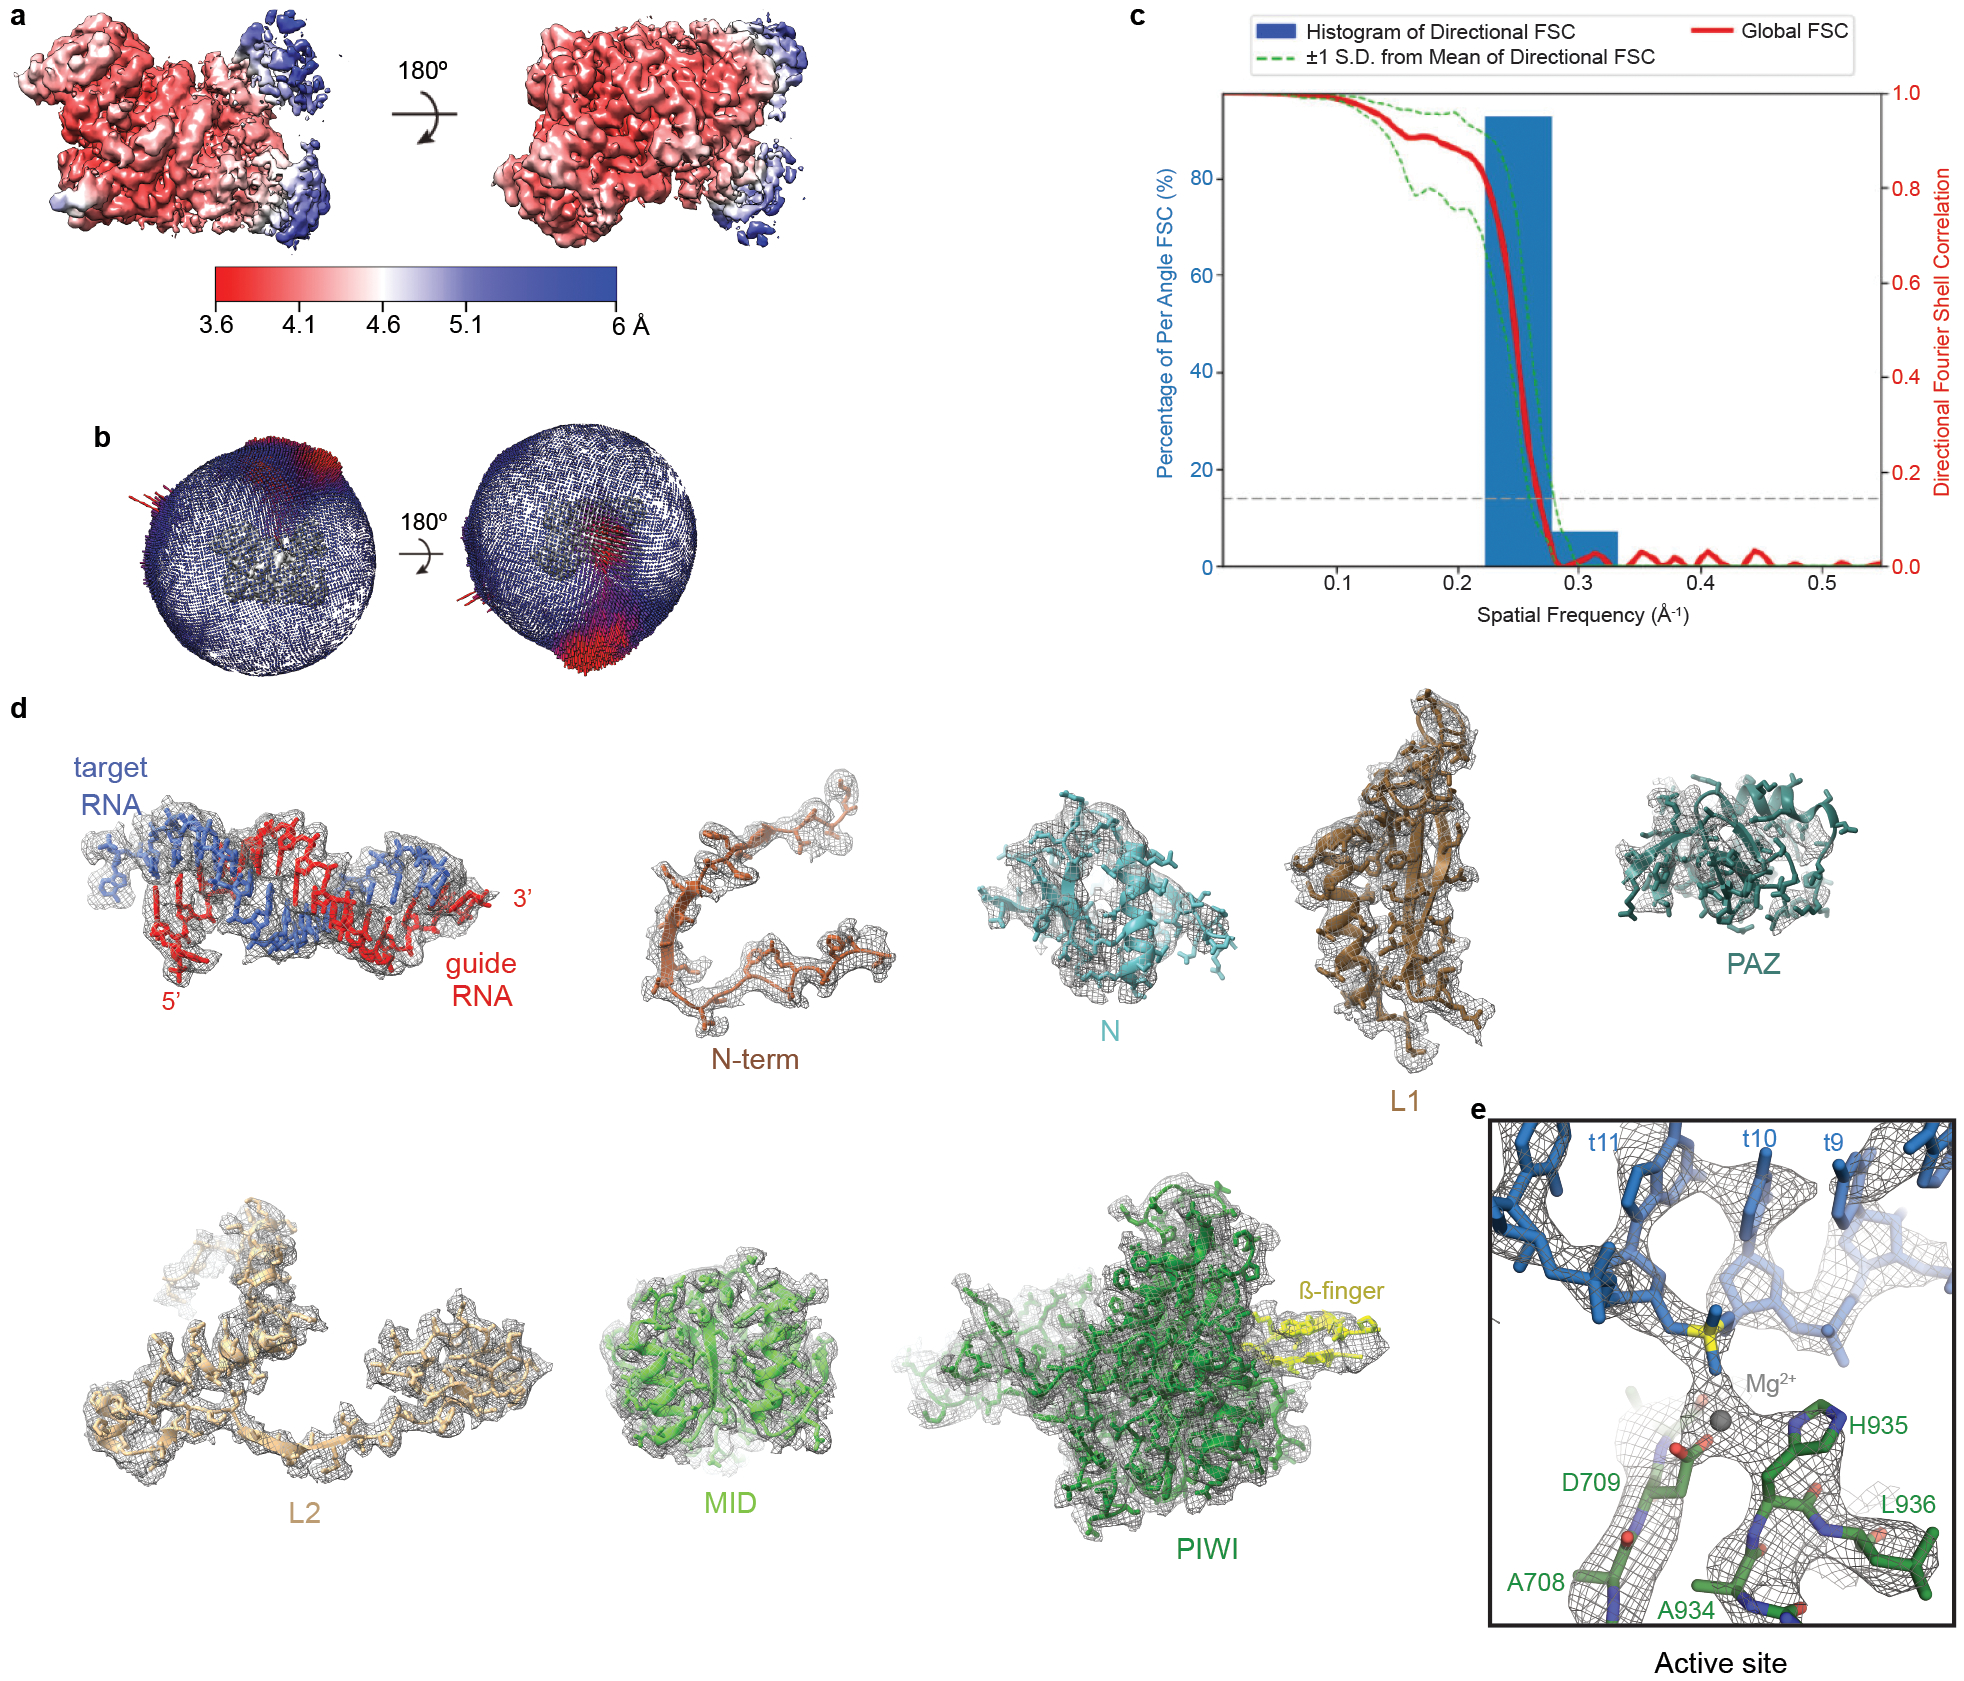
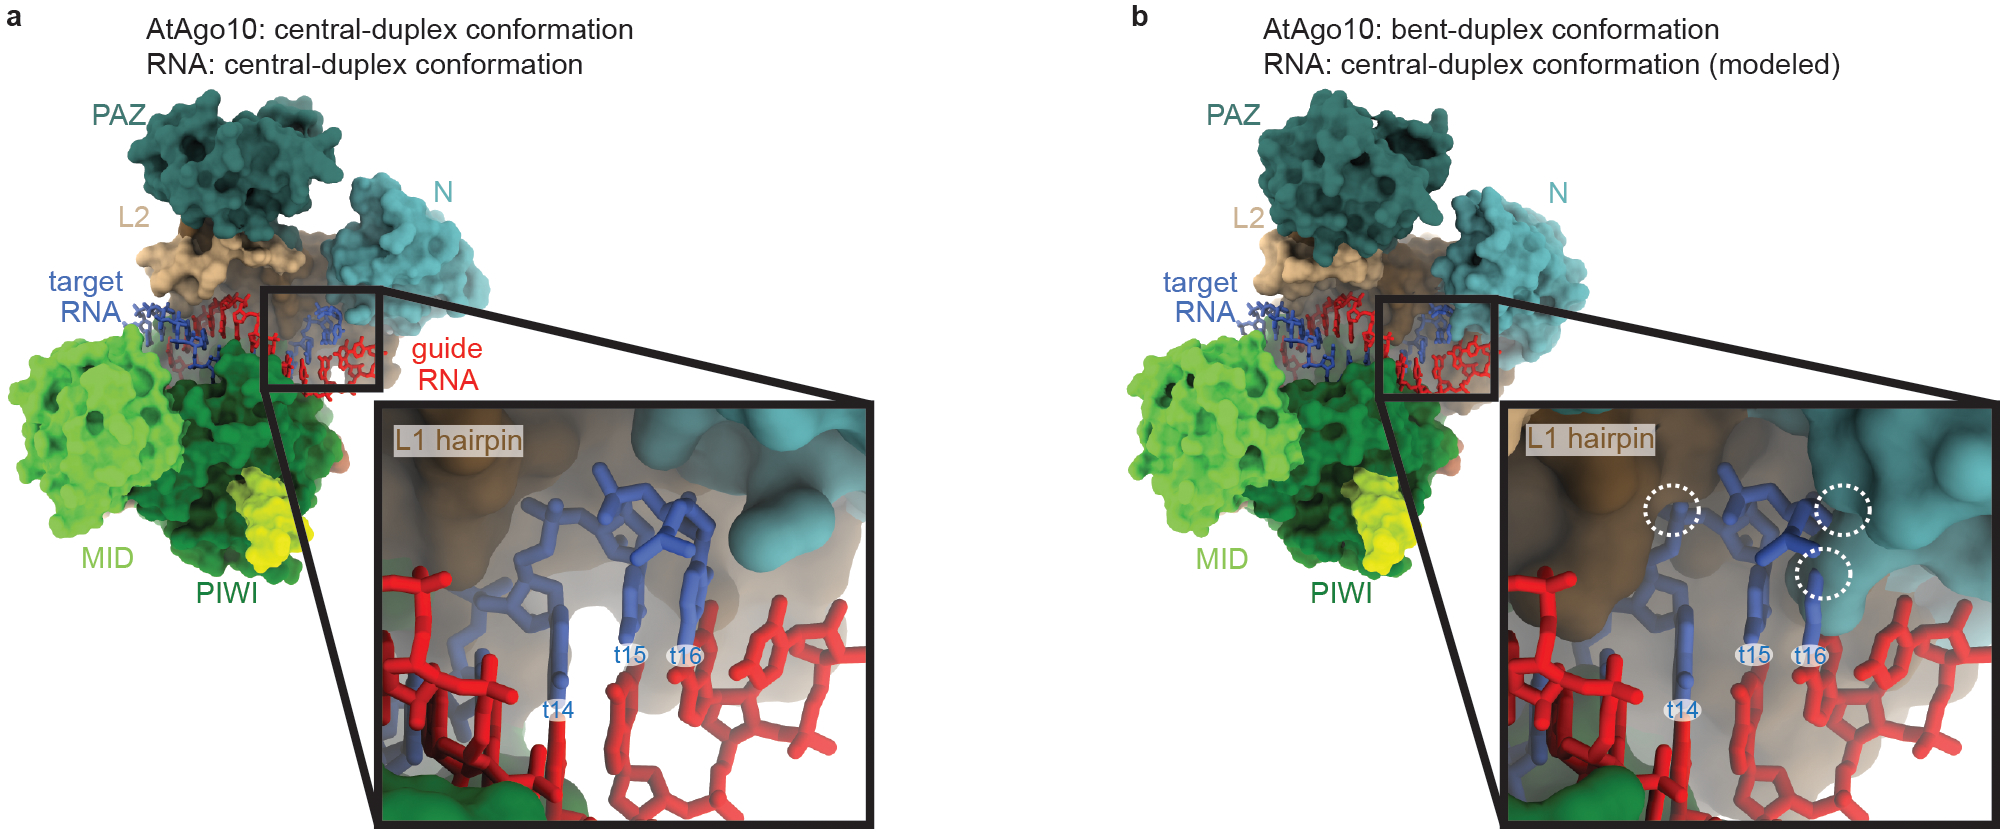
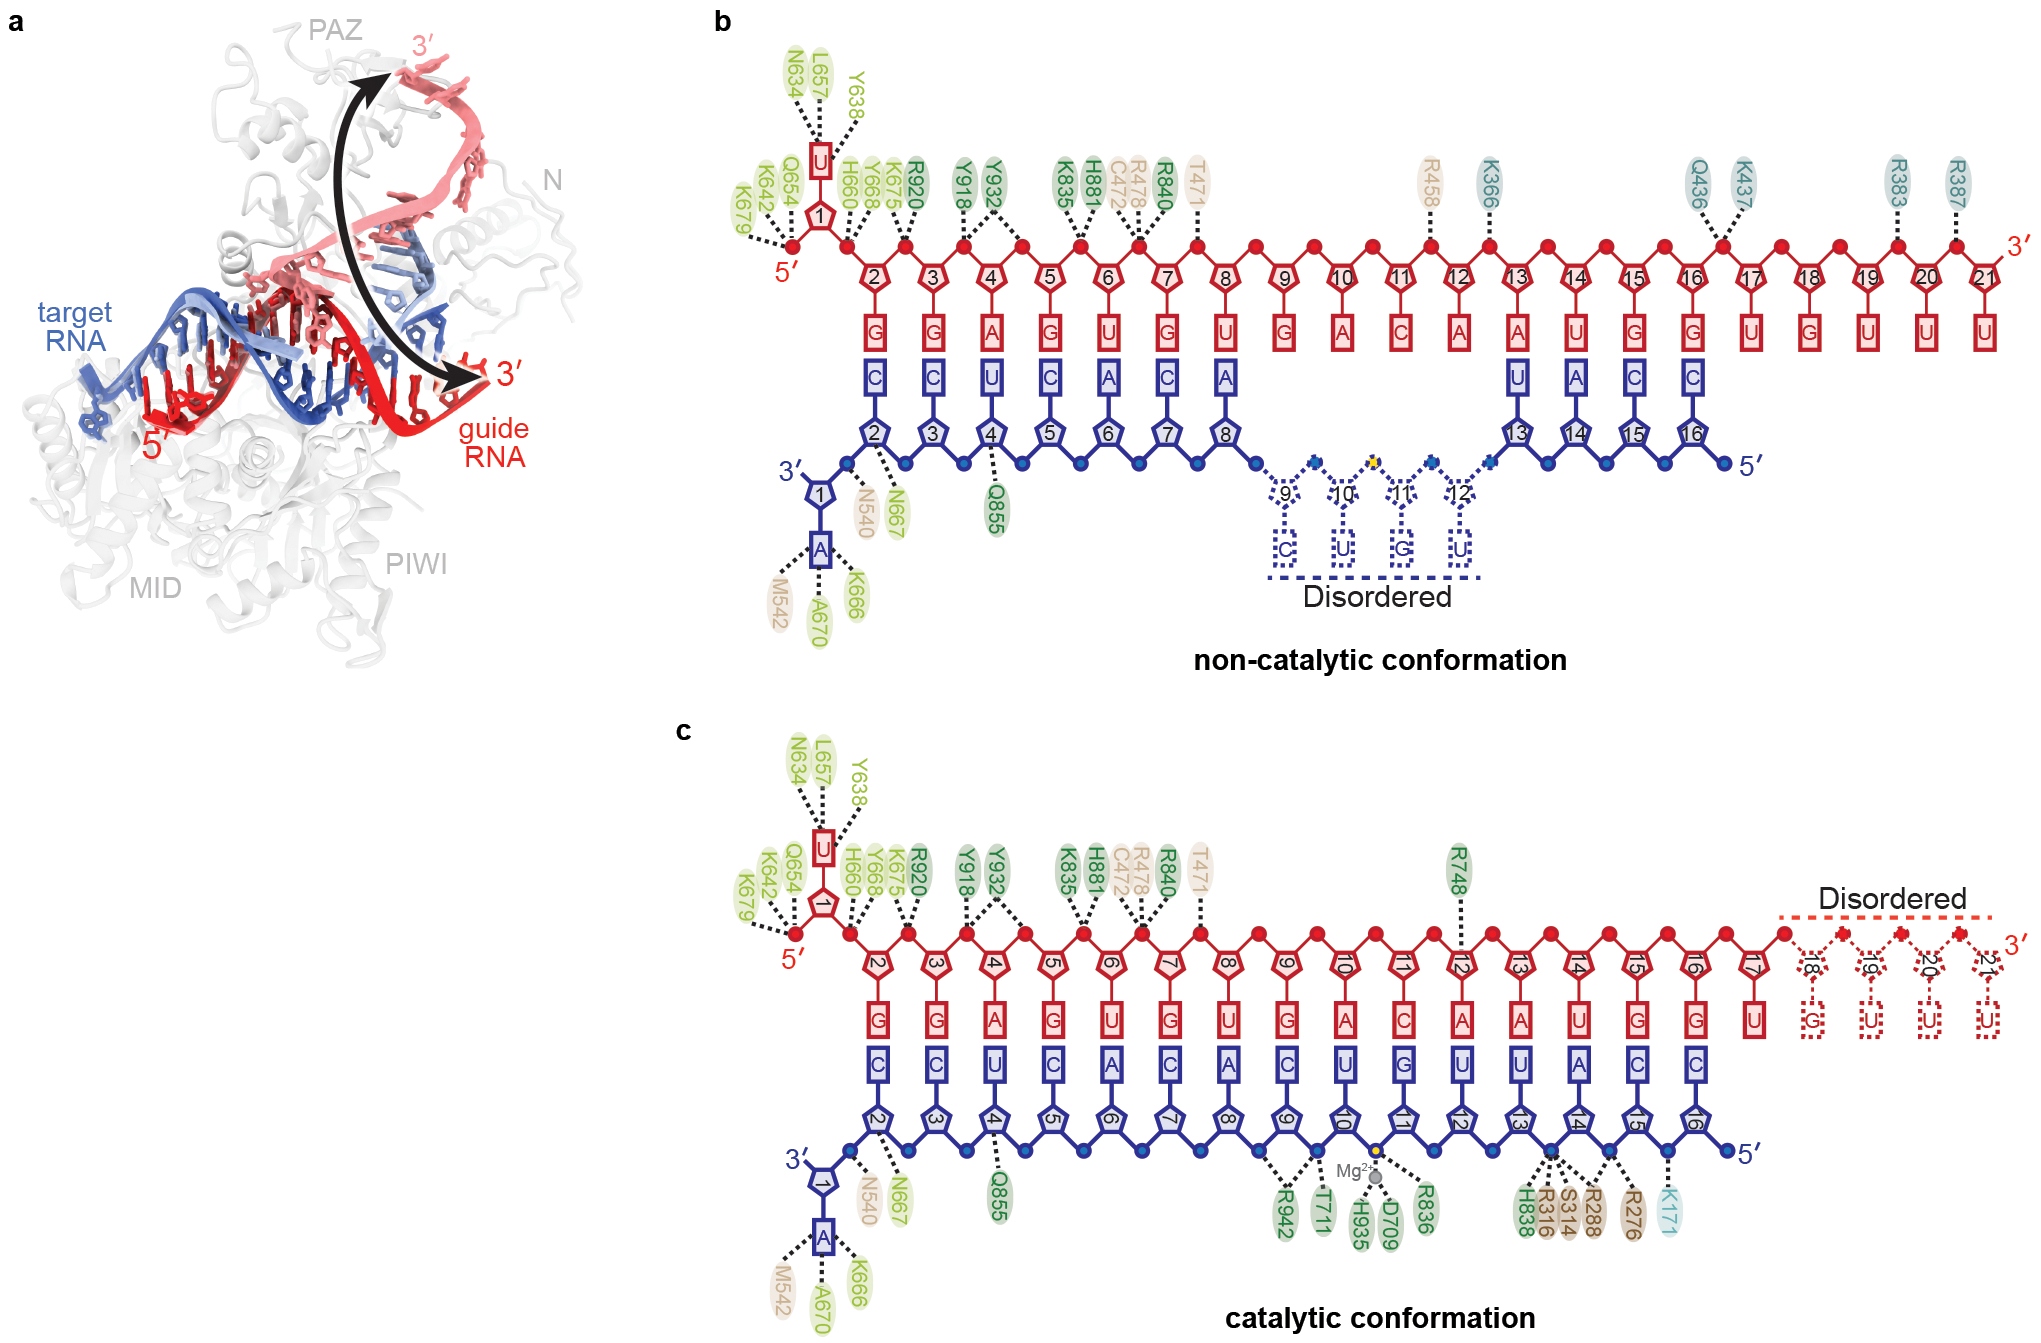
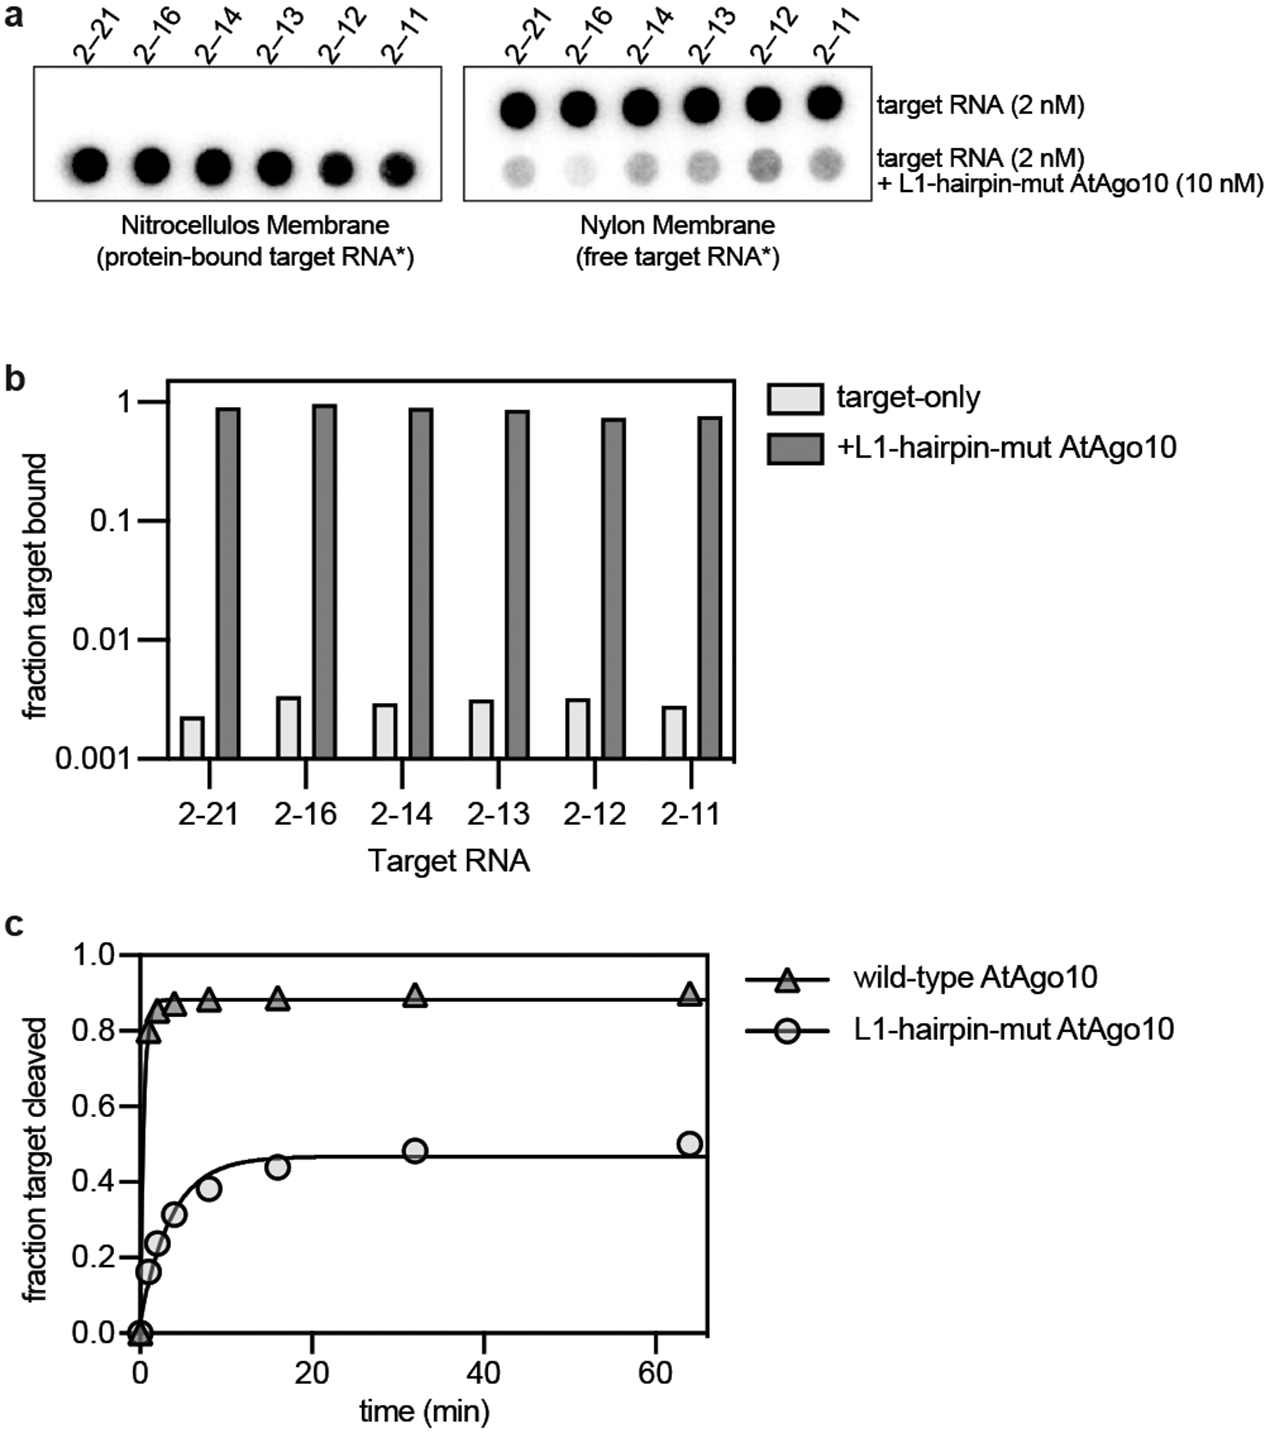
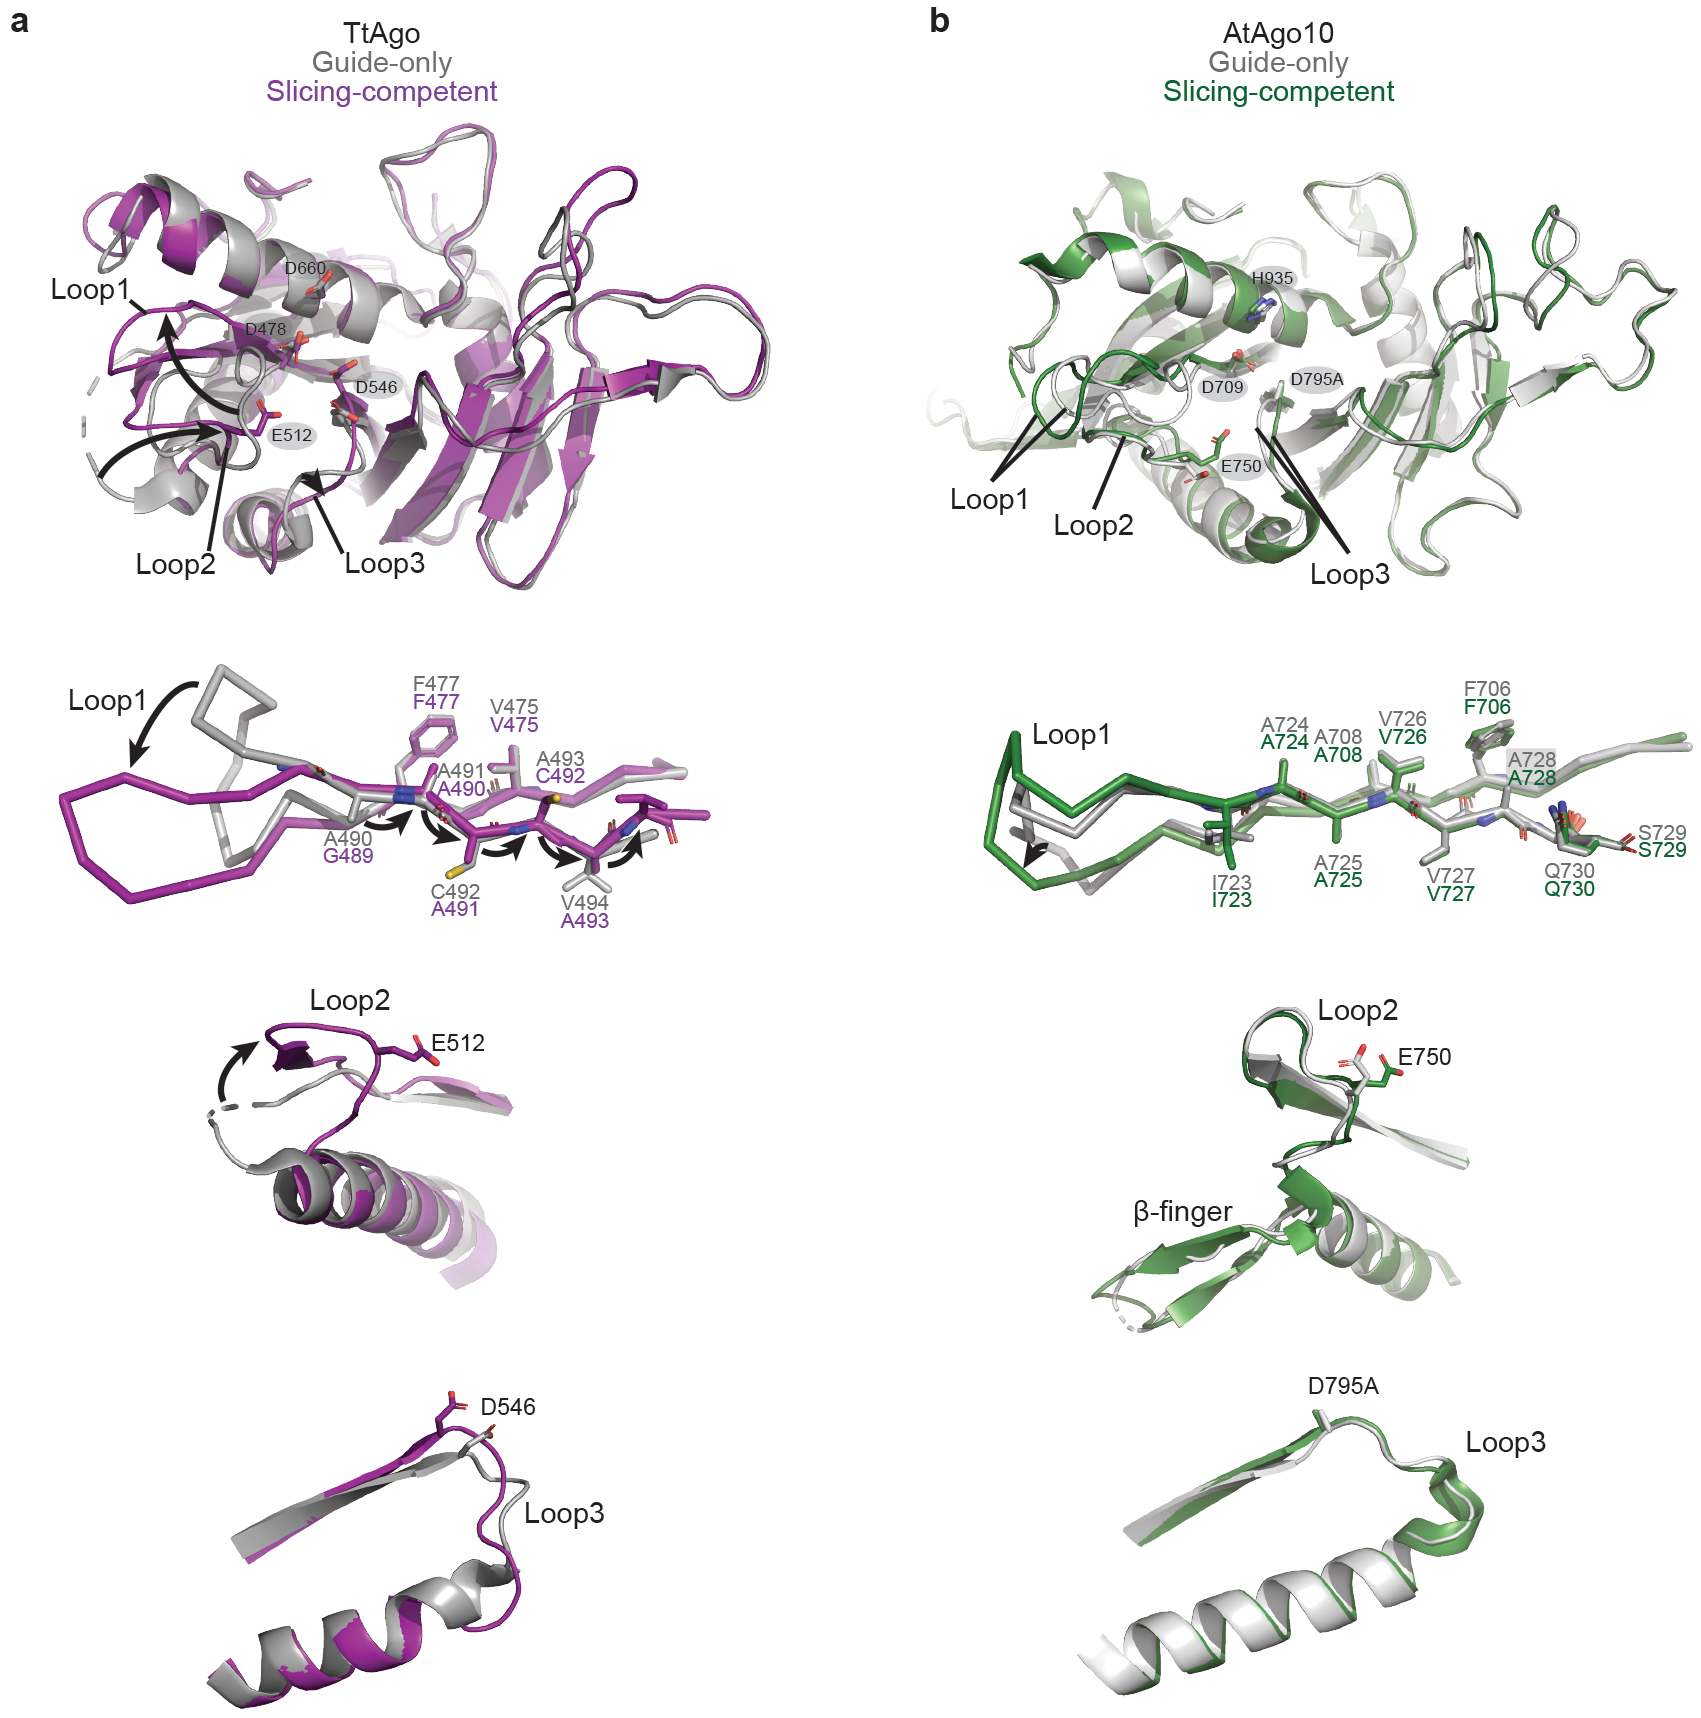
Argonaute (AGO) proteins use small RNAs to recognize transcripts targeted for silencing in plants and animals. Many AGOs cleave target RNAs using an endoribonuclease activity termed 'slicing'. Slicing by DNA-guided prokaryotic AGOs has been studied in detail, but structural insights into RNA-guided slicing by eukaryotic AGOs are lacking. Here we present cryogenic electron microscopy structures of the Arabidopsis thaliana Argonaute10 (AtAgo10)-guide RNA complex with and without a target RNA representing a slicing substrate. The AtAgo10-guide-target complex adopts slicing-competent and slicing-incompetent conformations that are unlike known prokaryotic AGO structures. AtAgo10 slicing activity is licensed by docking target (t) nucleotides t9-t13 into a surface channel containing the AGO endoribonuclease active site. A β-hairpin in the L1 domain secures the t9-t13 segment and coordinates t9-t13 docking with extended guide-target pairing. Results show that prokaryotic and eukaryotic AGOs use distinct mechanisms for achieving target slicing and provide insights into small interfering RNA potency.
Fig. 1.. Structure of the AtAgo10-guide RNA complex without target RNA.
a. Cryo-EM reconstruction with…
Fig. 1.. Structure of the AtAgo10-guide RNA complex without target RNA.
a. Cryo-EM reconstruction with individual domains segmented and colored as in the schematic (lower panel). The dashed line indicates unstructured N-terminal residues. Guide RNA density colored red. b. Cartoon representation of the AtAgo10-guide RNA atomic model. c. Close-up of the ß-finger structure. d. Sequence alignment near the ß-finger insertion of AGOs from Arabidopsis, human, and Drosophila. Plant AGO clades indicated. e. Cα backbone superposition of AtAgo10-guide structure (green) and human AGO-guide (silver) crystal structures. f. Superposition of guide nucleotides (shown as sticks) from the seed regions of AtAgo10 (green) and representatives of the four human AGOs (shades of red).
Fig. 2.. AtAgo10-guide-target complex captured in two…
Fig. 2.. AtAgo10-guide-target complex captured in two functional states.
a. Reconstruction (left) and model (right)…
Fig. 2.. AtAgo10-guide-target complex captured in two functional states.
a. Reconstruction (left) and model (right) of the AtAgo10-guide-target complex in the bent-duplex conformation. b. Reconstruction (left) and model (right) of the AtAgo10-guide-target complex in the central-duplex conformation. c. Superposition of AtAgo10 guide-only (grey/translucent) and bent-duplex (colored) conformations (RNAs not shown). Arrows indicate movement directions from guide-only to the bent-duplex structure. The dashed line indicates the axis of rotation (viewed from the side). d. Superposition of AtAgo10 bent-duplex (grey/translucent) and central-duplex (colored) conformations (RNAs and PAZ domain not shown). Arrows indicate movement directions from the bent-duplex to the central-duplex structure. The circled X indicates the axis of rotation (viewed down the axis). Inset shows a closeup of the L1 hairpin, α3, and α2. α2 is disordered in the central-duplex structure, revealing L1-PIWI contacts are lost upon moving from the bent-duplex to the central-duplex conformation.
Fig. 3.. Catalytic-competent conformation of the AtAgo10-guide-target…
Fig. 3.. Catalytic-competent conformation of the AtAgo10-guide-target complex.
a. Schematic of major contacts between AtAgo10…
Fig. 3.. Catalytic-competent conformation of the AtAgo10-guide-target complex.
a. Schematic of major contacts between AtAgo10 and the guide (red) and target (blue) RNAs. Residues colored by domain, as in Fig. 1. b. Structure of the AtAgo10-guide-target central-duplex conformation. Insets detail protein-RNA contacts specific to the central-duplex conformation. c. Sequence alignment of select plant and animal AGO and PIWI proteins. AtAgo10 residues contacting t9-t14 are indicated. Residues forming L1 hairpin and cS7 are also indicated. Shaded residues are identical to AtAgo10.
Fig. 4.. Structural basis for RNA Slicing.
a. Surface representation of the AtAgo10 central-duplex model.…
Fig. 4.. Structural basis for RNA Slicing.
a. Surface representation of the AtAgo10 central-duplex model. Inset shows t9–t13 (blue sticks) docked in the active site channel (guide RNA omitted for clarity). b. Base pairing schematic of guide and target RNAs used in slicing reactions in panels c and e. Target nucleotides falling within the active site channel are indicated. c. Fraction of target RNAs cleaved by a saturating excess of wild-type AtAgo10-guide complex versus time. d. Side-view of the end of the active site channel where the L1 hairpin secures t13 against cS7. e. Fraction of target RNAs cleaved by a saturating excess L1-hairpin-mut AtAgo10-guide complex versus time. Data points are the mean values of n=3 independent experiments. Error bars indicate SEM.
Fig. EV1.. Imaging and processing of the…
Fig. EV1.. Imaging and processing of the AtAgo10-guide RNA complex.
a. Representative cryo-EM micrograph (one…
Fig. EV1.. Imaging and processing of the AtAgo10-guide RNA complex.
a. Representative cryo-EM micrograph (one of 2,656 micrographs in total) b. Cryo-EM data processing workflow. Particles isolated from micrographs were sorted by reference-free 2D classification. Only particles containing high-resolution features for the intact complex were selected for downstream processing. 3D classification was used to further remove low-resolution or damaged particles, and the remaining particles were refined to obtain a 3.26 Å resolution reconstruction.
Fig. EV2.. Reconstruction of the AtAgo10-guide complex
a. The final 3D map for the AtAgo10-guide…
Fig. EV2.. Reconstruction of the AtAgo10-guide complex
a. The final 3D map for the AtAgo10-guide RNA complex colored by local resolution values, where the majority of the map was resolved between 3.3 Å and 3.7 Å, and the map covering the more mobile PAZ and N domains has lower resolution. b. Angular distribution plot showing the Euler angle distribution of the AtAgo10-guide particles in the final reconstruction. The position of each cylinder corresponds to the 3D angular assignments and their height and color (blue to red) correspond to the number of particles in that angular orientation. c. Directional Fourier Shell Correlation (FSC) plot representing 3D resolution anisotropy in the reconstructed map, with the red line showing the global FSC, green dashed lines correspond to ±1 standard deviation from mean of directional resolutions, and the blue histograms correspond to percentage of directional resolution over the 3D FSC. d. EM density (mesh) quality of the guide RNA (sticks). e. Individual domains of AtAgo10 fit into the EM density, EM density shown in mesh; molecular models (colored as in Fig. 1) shown in cartoon representation with side chains shown as sticks.
Fig. EV3.. Details of AtAgo10 structural analysis
a. Alignment of ß-finger sequences from clade I…
Fig. EV3.. Details of AtAgo10 structural analysis
a. Alignment of ß-finger sequences from clade I AGOs from diverse plants, algae, and animals. The insertion can be found in clade I AGOs in all plant phyla but is not apparent in animals or algae, indicating β-finger arose around the emergence of land plants and has been broadly maintained in the clade I AGOs over the last ~500 million years. b. All-against-all correspondence analysis of known eukaryotic AGO and PIWI guide-bound structures (target-bound structures not included). c. Cα alignment of AtAgo10 with known human AGO (PDB: 4KRF, 4KXT, 4OLA, 4W5N, 5JS1, 5VM9, 6OON), PIWI (PDB: 5GUH, 6KR6, 7KX7), and yeast AGO (PDB: 4F1N) guide-bound structures.
Fig. EV4.. Imaging and processing of the…
Fig. EV4.. Imaging and processing of the AtAgo10-guide-target RNA complex.
Representative cryo-EM micrograph (one out…
Fig. EV4.. Imaging and processing of the AtAgo10-guide-target RNA complex.
Representative cryo-EM micrograph (one out of 2,049 micrographs collected in total) in upper left, proceeded by cryo-EM data processing workflow. Particles isolated from micrographs were sorted by reference-free 2D classification. Only particles containing high-resolution features for the intact complex were selected for downstream processing. 3D classification was used to further remove low-resolution or damaged particles, and isolate classes with distinct RNA conformations. 3D classification and particles in the two major classes were further refined to obtain two 3.79 Å resolution reconstructions. Conformation-1 is the ‘central-duplex’, catalytic conformation. Conformation-2 corresponds to the ‘bent-duplex’, inactive family of conformations.
Fig. EV5.. Reconstruction of the AtAgo10-guide-target bent-duplex…
Fig. EV5.. Reconstruction of the AtAgo10-guide-target bent-duplex conformation.
a. Final 3D map for Conformation-2 (see…
Fig. EV5.. Reconstruction of the AtAgo10-guide-target bent-duplex conformation.
a. Final 3D map for Conformation-2 (see Fig. EV4) of the AtAgo10-guide-target RNA complex colored by local resolution values. b. Angular distribution plot showing the Euler angle distribution of the AtAgo10-guide-target particles in the final reconstruction. The position of each cylinder corresponds to the 3D angular assignments and their height and color (blue to red) corresponds to the number of particles in that angular orientation. c. Directional Fourier Shell Correlation (FSC) plot representing 3D resolution anisotropy in the reconstructed map, with the red line showing the global FSC, green dashed lines correspond to ±1 standard deviation from mean of directional resolutions, and the blue histograms correspond to percentage of directional resolution over the 3D FSC. d. Guide-target duplex (shown as sticks) and individual AtAgo10 domains (shown in cartoon representation with side chains shown as sticks) fit into the EM density (shown in mesh). e. The bent-duplex conformation of AtAgo10 strongly resembles a previous bent duplex structure of HsAgo2 (PDB 6MDZ), with an RMSD of 1.5 Å for 634 equivalent Cα atoms.
Fig. EV6.. Reconstruction of the AtAgo10-guide-target central-duplex…
Fig. EV6.. Reconstruction of the AtAgo10-guide-target central-duplex conformation.
a. Final 3D map for Conformation-1 (see…
Fig. EV6.. Reconstruction of the AtAgo10-guide-target central-duplex conformation.
a. Final 3D map for Conformation-1 (see Fig. EV4) of the AtAgo10-guide-target RNA complex colored by local resolution values. b. Angular distribution plot showing the Euler angle distribution of the AtAgo10-guide-target particles in the final reconstruction. The position of each cylinder corresponds to the 3D angular assignments and their height and color (blue to red) corresponds to the number of particles in that angular orientation. c. Directional Fourier Shell Correlation (FSC) plot representing 3D resolution anisotropy in the reconstructed map, with the red line showing the global FSC, green dashed lines correspond to ±1 standard deviation from mean of directional resolutions, and the blue histograms correspond to percentage of directional resolution over the 3D FSC. d. Guide-target duplex (shown as sticks) and individual AtAgo10 domains (shown in cartoon representation with side chains shown as sticks) fit into the EM density (shown in mesh). e. Close-up view of density surrounding the scissile phosphate (yellow).
Fig. EV7.. Bent-duplex conformation of AtAgo10 cannot…
Fig. EV7.. Bent-duplex conformation of AtAgo10 cannot bind a central guide-target duplex with pairing beyond…
Fig. EV7.. Bent-duplex conformation of AtAgo10 cannot bind a central guide-target duplex with pairing beyond t13.
a. Surface representation of the AtAgo10 central-duplex structure with the guide-target RNA duplex shown as sticks. Inset shows no steric clashes between AtAgo10 and the end of the RNA duplex. b. Surface representation of AtAgo10 in the bent-duplex conformation with a modeled continuous guide-target RNA duplex (taken from the central-duplex structure). Inset shows steric clashes (white dashed circles) between t14/t16 of the modeled RNA and the L1 hairpin/N domain of AtAgo10.
Fig. EV8.. Comparison of catalytic and non-catalytic…
Fig. EV8.. Comparison of catalytic and non-catalytic AtAgo10-guide-target structures.
a. Superposition of catalytic (central duplex)…
Fig. EV8.. Comparison of catalytic and non-catalytic AtAgo10-guide-target structures.
a. Superposition of catalytic (central duplex) and non-catalytic (bent duplex) conformations. Arrow indicates the magnitude of movement traversed by the guide RNA 3' end between conformations. b. Schematic of major contacts between AtAgo10 and the guide (red) and target (blue) RNAs in the non-catalytic (bent duplex) conformation. c. Schematic of major contacts between AtAgo10 and the RNAs in the catalytic (central duplex) conformation. Residues colored by domain, as in Fig. 1.
Fig. EV9.. L1-hairpin-mut AtAgo10 is impaired in…
Fig. EV9.. L1-hairpin-mut AtAgo10 is impaired in target-slicing but not target-binding
a. Blots from an…
Fig. EV9.. L1-hairpin-mut AtAgo10 is impaired in target-slicing but not target-binding
a. Blots from an RNA filter-binding experiment using L1-hairpin-mut AtAgo10 (10 nM) and target RNAs (2 nM) used in this study (shown in Fig. 4B). Complexes were formed with 32P-labeled target RNAs under conditions used for slicing experiments (except Mg2+ was omitted to prevent target cleavage) and passed through a nitrocellulose membrane (to capture protein-RNA complexes) followed by a nylon membrane (to capture RNAs not retained on the nitrocellulose). b. Quantitation of data in panel a. Plotted data are the values from n=1 experiments. c. Fraction of 2-21 target RNA (2 nM) cleaved by wild-type (10 nM) or L1-hairpin-mut AtAgo10 (10 nM) versus time. Data points are the mean values of n=3 independent experiments. Error bars indicate SEM.
Fig. EV10.. Comparison of TtAgo and AtAgo10…
Fig. EV10.. Comparison of TtAgo and AtAgo10 PIWI domain conformational changes.
a. Superimposition of TtAgo…
Fig. EV10.. Comparison of TtAgo and AtAgo10 PIWI domain conformational changes.
a. Superimposition of TtAgo PIWI domains from guide-only (grey, PDB: 3DLH) and slicing competent (purple, PDB: 4NCB) conformations. Top panel: an overview of the TtAgo PIWI domain with active site residues shown as sticks and labeled. Bottom panel: Detailed views showing the formation of the catalytic conformation involves three rearranged loops and flipping+translation of a ß-strand connected to loop-1 in the TtAgo PIWI domain. Arrows indicate major shifts from the guide-only to the slicing-competent conformation. b. Superimposition of the AtAgo10 PIWI domains from guide-only (grey) and slicing competent (central-duplex) conformations (green) shows relatively few changes and no ß-strand repositioning.
Singh A et al. Plant small RNAs: advancement in the understanding of biogenesis and role in plant development. Planta 248, 545–558, doi:10.1007/s00425-018-2927-5 (2018).
-
DOI
-
PubMed
Iwakawa HO & Tomari Y Life of RISC: Formation, action, and degradation of RNA-induced silencing complex. Molecular cell 82, 30–43, doi:10.1016/j.molcel.2021.11.026 (2022).
-
DOI
-
PubMed
Zamore PD, Tuschl T, Sharp PA & Bartel DP RNAi: double-stranded RNA directs the ATP-dependent cleavage of mRNA at 21 to 23 nucleotide intervals. Cell 101, 25–33, doi:10.1016/S0092-8674(00)80620-0 (2000).
-
DOI
-
PubMed
Hu B et al. Therapeutic siRNA: state of the art. Signal Transduct Target Ther 5, 101, doi:10.1038/s41392-020-0207-x (2020).
-
DOI
-
PMC
-
PubMed
Methods-only references
Suloway C et al. Automated molecular microscopy: the new Leginon system. J Struct Biol 151, 41–60, doi:10.1016/j.jsb.2005.03.010 (2005).
-
DOI
-
PubMed
Kimanius D, Forsberg BO, Scheres SH & Lindahl E Accelerated cryo-EM structure determination with parallelisation using GPUs in RELION-2. Elife 5, doi:10.7554/eLife.18722 (2016).
-
DOI
-
PMC
-
PubMed
Zhang K Gctf: Real-time CTF determination and correction. J Struct Biol 193, 1–12, doi:10.1016/j.jsb.2015.11.003 (2016).
-
DOI
-
PMC
-
PubMed
Punjani A, Rubinstein JL, Fleet DJ & Brubaker MA cryoSPARC: algorithms for rapid unsupervised cryo-EM structure determination. Nature methods 14, 290–296, doi:10.1038/nmeth.4169 (2017).
-
DOI
-
PubMed
Tan YZ et al. Addressing preferred specimen orientation in single-particle cryo-EM through tilting. Nature methods 14, 793–796, doi:10.1038/nmeth.4347 (2017).
-
DOI
-
PMC
-
PubMed