. 2023 May;30(5):692-702.
doi: 10.1038/s41594-023-00981-1. Epub 2023 May 1.

Dynamic epistasis analysis reveals how chromatin remodeling regulates transcriptional bursting

Affiliations

Dynamic epistasis analysis reveals how chromatin remodeling regulates transcriptional bursting

Ineke Brouwer et al. Nat Struct Mol Biol. 2023 May.

Abstract

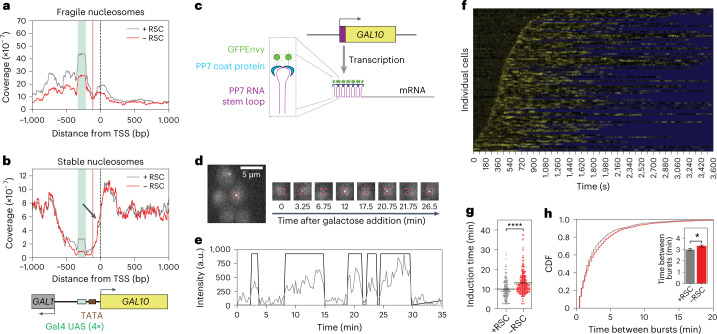
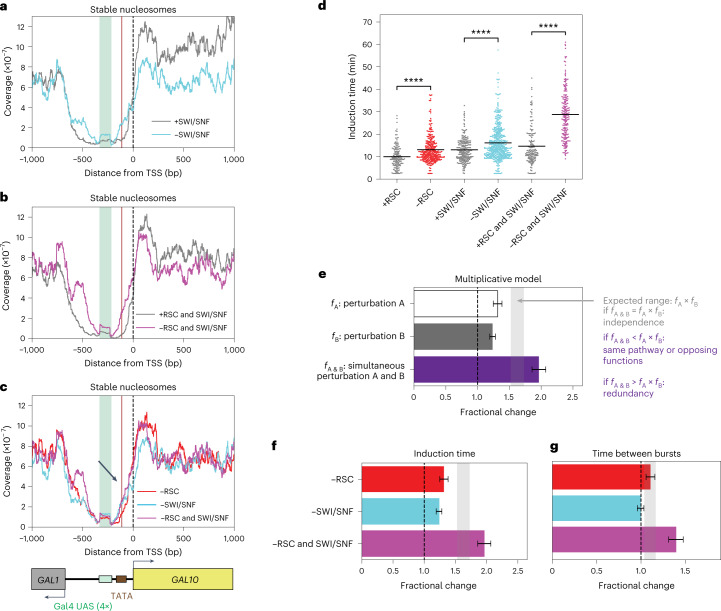
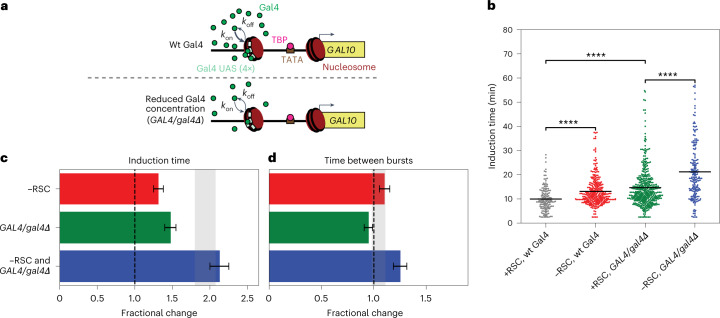
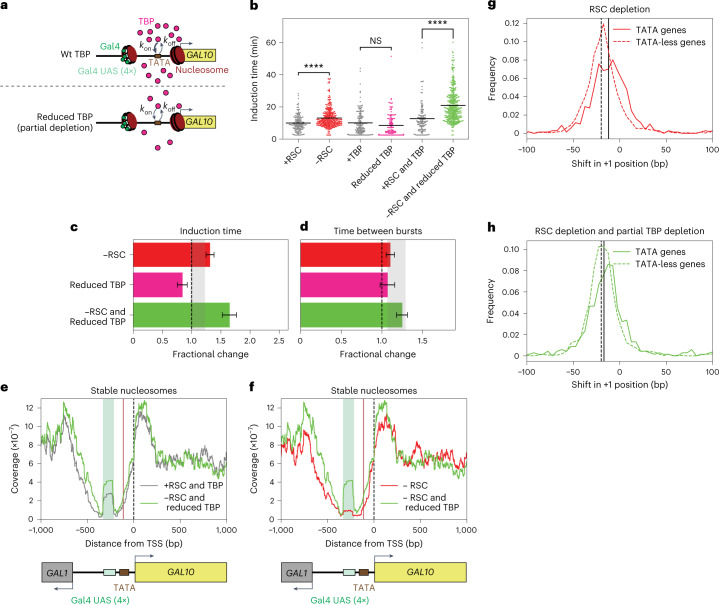
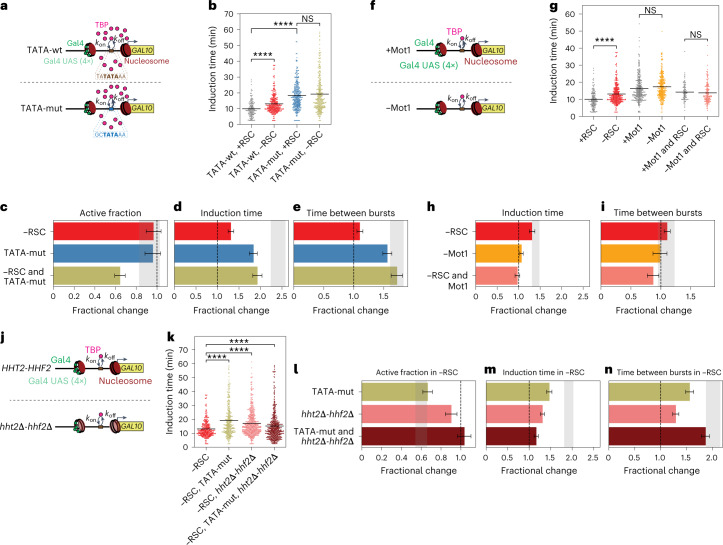
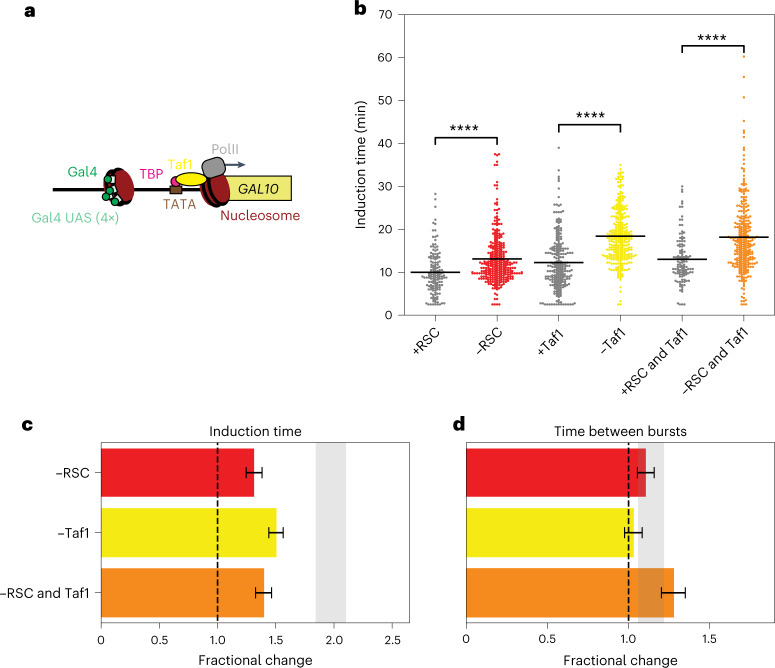
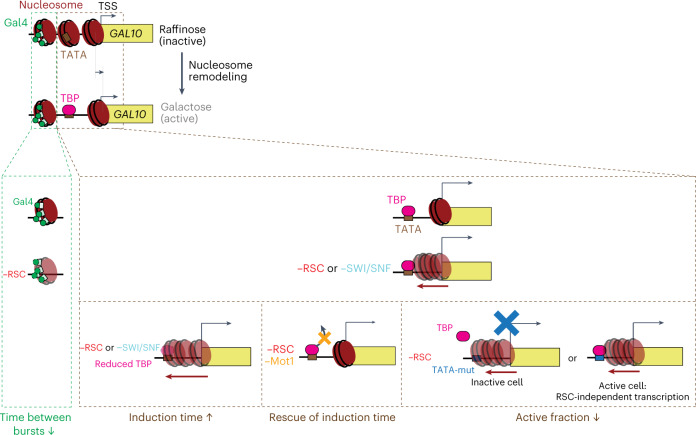
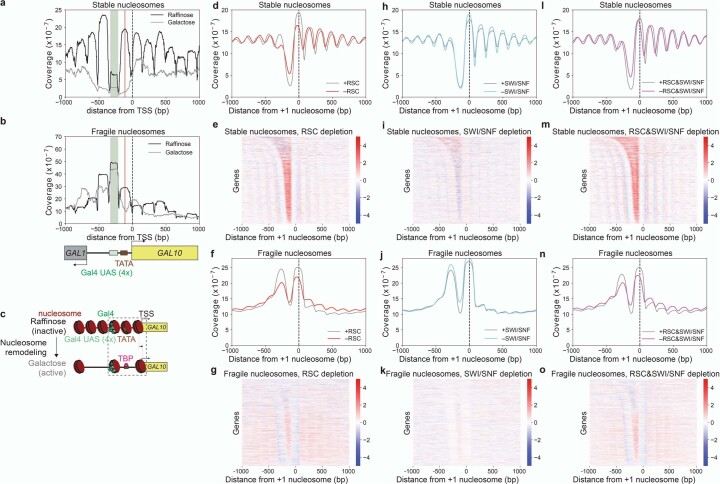
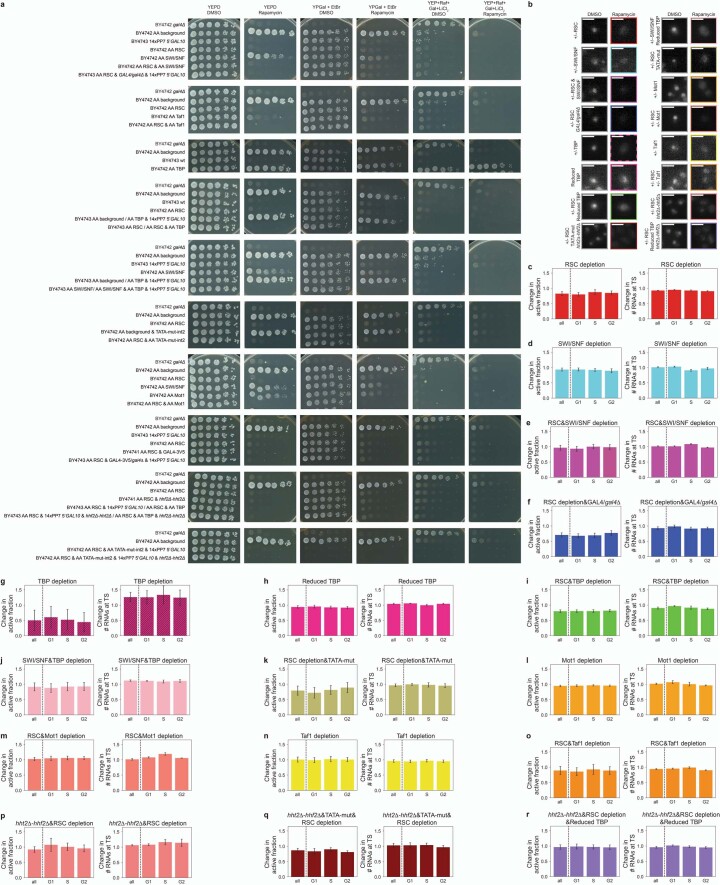
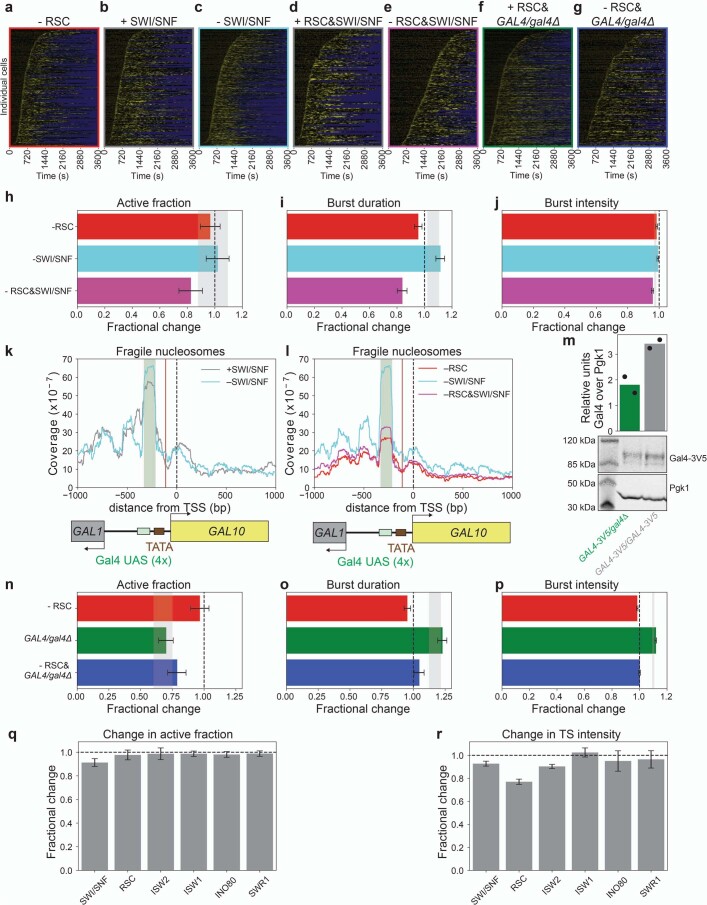
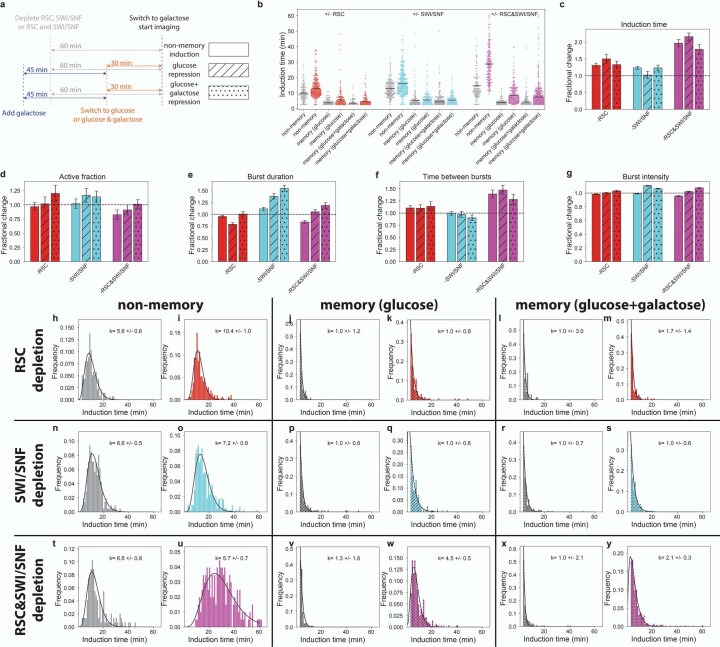
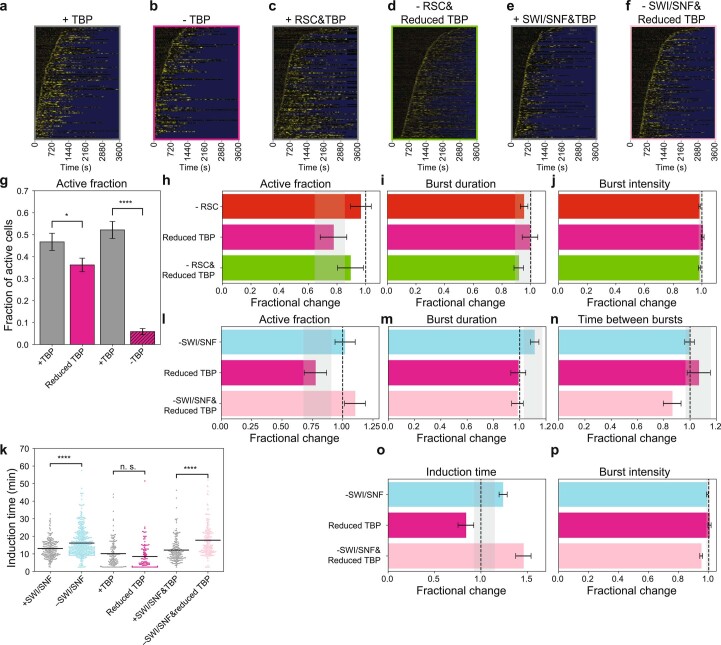
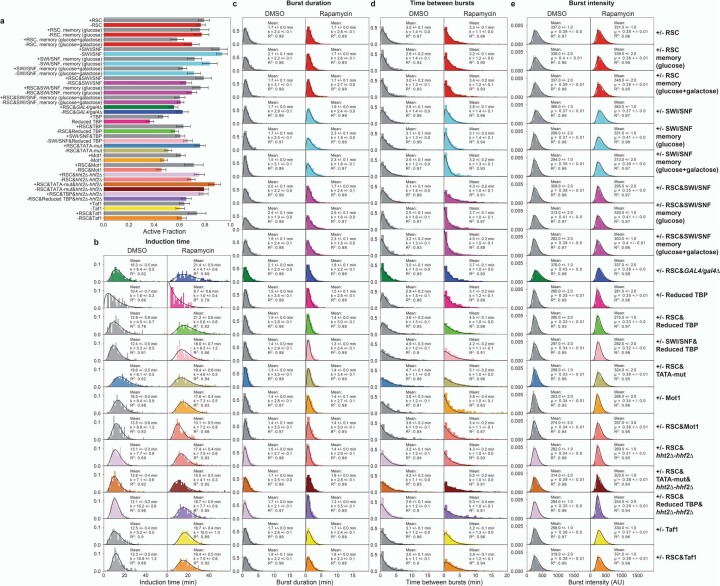
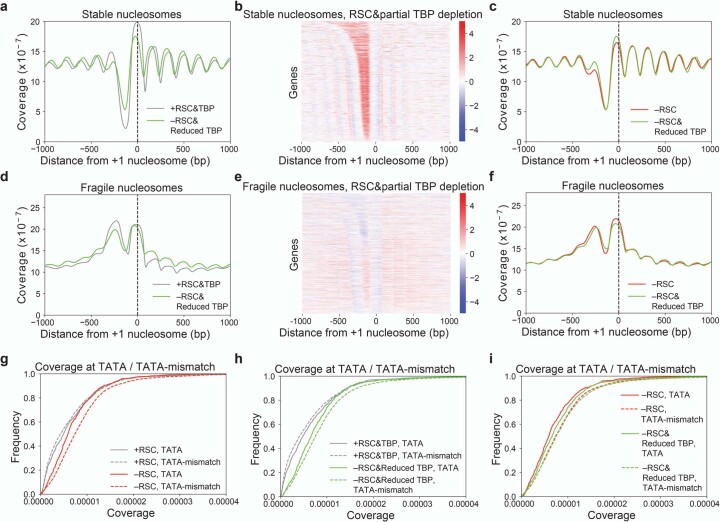
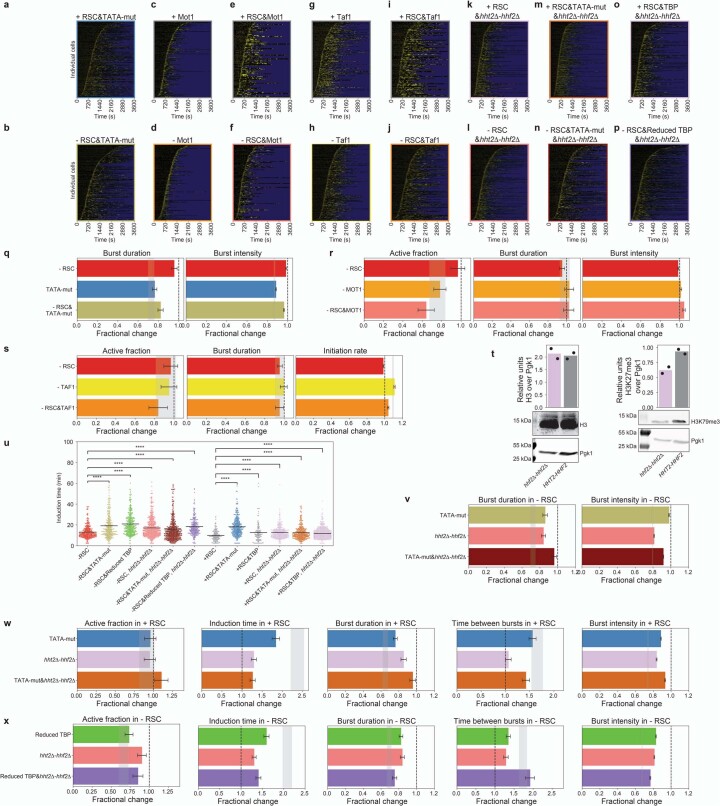
Transcriptional bursting has been linked to the stochastic positioning of nucleosomes. However, how bursting is regulated by the remodeling of promoter nucleosomes is unknown. Here, we use single-molecule live-cell imaging of GAL10 transcription in Saccharomyces cerevisiae to measure how bursting changes upon combined perturbations of chromatin remodelers, the transcription factor Gal4 and preinitiation complex components. Using dynamic epistasis analysis, we reveal how the remodeling of different nucleosomes regulates transcriptional bursting parameters. At the nucleosome covering the Gal4 binding sites, RSC and Gal4 binding synergistically facilitate each burst. Conversely, nucleosome remodeling at the TATA box controls only the first burst upon galactose induction. At canonical TATA boxes, the nucleosomes are displaced by TBP binding to allow for transcription activation even in the absence of remodelers. Overall, our results reveal how promoter nucleosome remodeling together with Gal4 and preinitiation complex binding regulates transcriptional bursting.


Conflict of interest statement

The authors declare no competing interests.

Figures

Fig. 1
Fig. 1. Remodeling of GAL10 promoter nucleosomes at the UASs and the TSS by RSC affects induction time and time between bursts.
a, MNase-seq analysis of fragile nucleosomes in the GAL10 promoter region showed a reduced coverage of fragile nucleosomes upon RSC depletion using anchor-away of the catalytic subunit Sth1 by 60 min rapamycin treatment. b, MNase-seq analysis of stable nucleosomes in the GAL10 promoter region. The black arrow indicates a small shift of the +1 nucleosome into the NDR upon RSC depletion. MNase plots in a and b show one representative replicate out of two experiments. c, Schematic of PP7 RNA labeling to visualize GAL10 transcription in real-time. d, Fluorescence signal of an individual TS in a representative cell over time. Red box: location of GAL10 TS. Representative example out of 143 cells. e, Quantification of TS intensity over time of the cell in (d) (gray) and binarization (black). f, Heatmap of the TS intensity in n = 143 cells (rows) in the presence of RSC. Yellow: fluorescence intensity of TS; blue: region excluded from analysis. g, Cells that were depleted of RSC (red) showed an increased GAL10 induction time compared to the nondepleted cells (gray). P = <10−15. h, Cells that were depleted of RSC (red) showed an increased time between the burst of GAL10 transcription compared to the nondepleted cells (gray). Data are presented as cumulative distribution. Inset: data presented as mean values ± s.d. based on 1,000 bootstrap repeats. P = 0.028. The significance in g and h (inset) was determined by two-sided bootstrap hypothesis testing; *, P < 0.05, ****, P < 0.00005. Source data
Fig. 2
Fig. 2. Partially redundant remodeling of nucleosomes by RSC and SWI/SNF at the TATA and TSS synergistically affects the induction time and time between bursts.
a, MNase-seq analysis in the GAL10 promoter region showed higher coverage of stable nucleosomes around the TATA upon depletion of SWI/SNF by anchor-away of the catalytic subunit Swi2. b, MNase-seq analysis of stable nucleosomes in the GAL10 promoter region showed higher coverage at the TATA and around the TSS upon simultaneous depletion of RSC and SWI/SNF than depletion of either RSC or SWI/SNF individually. c, Overlay of MNase-seq analysis of stable nucleosomes in the GAL10 promoter region upon depletion of RSC, SWI/SNF and simultaneous depletion of RSC and SWI/SNF showed increased coverage (black arrow). MNase plots in ac show one representative replicate out of two experiments. d, Cells that were depleted of RSC and/or SWI/SNF (red, cyan, magenta) had an increased GAL10 induction time compared to the nondepleted cells (gray). Significance determined by two-sided bootstrap hypothesis testing; ****, P < 0.00005. P values: RSC, P < 10−15; ±SWI/SNF, P < 10−15; ±RSC and SWI/SNF, P < 10−15. e, The multiplicative model for dynamic epistasis analysis was used to assess the effect of double perturbations. The expected effect of a double perturbation for independent processes (grey shaded area) is the product of the effect of the individual perturbations (fA and fB). If the observed effect (fA&B) is smaller than this expected effect, the perturbations are in the same pathway or have opposing functions. If the observed effect is larger, the processes are redundant. f, The increase in GAL10 induction time when simultaneously depleting RSC and SWI/SNF was larger than expected, based on their individual depletions. Gray bar, expected effect based on dynamic epistasis analysis. g, The increase in time between GAL10 transcriptional bursts in the RSC and SWI/SNF double depletion was larger than expected based on their individual depletions. Gray bar, expected effect based on dynamic epistasis analysis. Data in e, f and g are presented as the fractional change based on mean values ± s.d. based on 1,000 bootstrap repeats. Source data
Fig. 3
Fig. 3. Remodeling of the fragile nucleosome at the UASs by RSC and Gal4 binding synergistically regulates the time between bursts.
a, Schematic showing reduced Gal4 on-rate in a GAL4/gal4Δ strain where Gal4 protein concentration was reduced. b, GAL10 induction time was increased in GAL4/gal4Δ cells and in RSC-depleted cells. Significance determined by two-sided bootstrap hypothesis testing; ****, P < 0.00005. P values: ±RSC, GAL4/GAL4, P < 10−15; ±RSC, GAL4/gal4Δ, P < 10−15; +RSC, GAL4/GAL4 versus +RSC, GAL4/gal4Δ, P < 10−15. c, Increase in GAL10 induction time in RSC-depleted GAL4/gal4Δ cells was as expected, based on individual perturbations. Gray bar, expected effect based on dynamic epistasis analysis. d, The time between consecutive bursts of GAL10 transcription in GAL4/gal4Δ cells increased more than expected based on individual perturbations. Gray bar, expected effect based on dynamic epistasis analysis. Data in c and d are presented as the fractional change based on mean values ± s.d. based on 1,000 bootstrap repeats. Source data
Fig. 4
Fig. 4. The nucleosomes at the TATA and TSS are redundantly displaced by RSC and TBP to regulate the first burst of GAL10 transcription.
a, Schematic showing a reduced TBP on-rate after the addition of rapamycin in a diploid yeast strain where one of the two copies of TBP was depleted by anchor-away. b, GAL10 induction time increased upon RSC depletion, did not change upon partial TBP depletion and increased more in simultaneous RSC and partial TBP depletion. Significance determined by two-sided bootstrap hypothesis testing; NS, not significant; ****, P < 0.00005. P values: ±RSC, P < 10−15; +TBP versus partial TBP 0.092; +RSC and TBP versus −RSC and partial TBP, P < 10−15. c, The increase in GAL10 induction time when simultaneously depleting RSC and partial TBP was larger than expected based on their individual depletions. Gray bar, expected effect based on dynamic epistasis analysis. d, The time between the consecutive bursts of GAL10 transcription increased as expected in the double depletion of RSC and partial TBP. Gray bar, expected effect based on dynamic epistasis analysis. Data in c and d are presented as the fractional change based on mean values ± s.d. based on 1,000 bootstrap repeats. e, MNase-seq analysis of stable nucleosomes in the GAL10 promoter region showed increased coverage around the TSS and TATA when RSC and partial TBP were depleted. f, MNase-seq analysis of stable nucleosomes in the GAL10 promoter region showed higher coverage around the TATA and TSS when depleting RSC and partial TBP than when depleting only RSC. g, Histogram of shift in +1 nucleosome upon depletion of RSC for both TATA genes and TATA-mismatch genes, showing that TATA-mismatch genes showed a larger shift in the +1 nucleosome than TATA genes. h, Histogram of shift in +1 nucleosome upon simultaneous depletion of RSC and partial TBP for both TATA genes and TATA-mismatch genes. Solid and dotted vertical lines in g and h indicate the median shift in the +1 nucleosome position of the TATA and TATA-less genes, respectively. Plots in eh show one representative replicate out of two experiments. Source data
Fig. 5
Fig. 5. Competition between TATA nucleosome and TBP depends on TBP residence time.
a, Schematic showing expected reduced TBP residence time upon mutating TATA (TATA-mut). b, GAL10 induction time increased upon RSC depletion in TATA-wt, but not in TATA-mut cells. P values: TATA-wt, ±RSC, P < 10−15; +RSC, TATA-wt versus TATA-mut, P < 10−15; TATA-mut, ±RSC, P = 0.264. c, Upon RSC depletion in TATA-mut, a fraction of cells did not activate GAL10 transcription. d, TATA-mut increased GAL10 induction time, with no additional effect upon RSC depletion, resulting in a smaller-than-expected effect based on individual perturbations. e, The effect on the time between consecutive bursts of GAL10 transcription was as expected based on individual perturbations. f, Schematic showing increased TBP residence time at the TATA upon Mot1 depletion. g, GAL10 induction time increased upon depletion of RSC but not upon Mot1 or RSC and Mot1 depletion. P values: ±RSC, P < 10−15; ±Mot1, P = 0.096; ±RSC and Mot1, P = 0.6. h, Smaller-than-expected effect of RSC and Mot1 depletion; Mot1 rescued the effect of RSC depletion. i, The effect on the time between consecutive bursts of GAL10 transcription was as expected based on individual perturbations. j, Schematic showing reduced histone levels upon hht2Δ-hhf2Δ. k, In −RSC, GAL10 induction time is increased upon TATA-mut or upon hht2Δ-hhf2Δ, which is partially rescued by their combination. P values: −RSC versus −RSC and TATA-mut, P < 10−15; −RSC versus −RSC and hht2Δ-hhf2Δ, P < 10−15; −RSC versus −RSC and TATA-mut and hht2Δ-hhf2Δ, P < 10−15. l, The inactive population in TATA-mut in −RSC is rescued by additional hht2Δ-hhf2Δ. m, TATA-mut in −RSC increased induction time, but this was rescued by additional hht2Δ-hhf2Δ. n, The effect on the time between consecutive bursts of GAL10 transcription was as expected based on individual perturbations. ce, hi and ln, Change in active fraction is the fractional change based on number of active and inactive cells ± propagated statistical errors in these numbers. Change in other parameters is fractional change based on mean values ± s.d. based on 1,000 bootstrap repeats. Gray bar, expected effect based on dynamic epistasis analysis. ln, Fractional changes are calculated relative to −RSC cells. b, g and k, Significance determined by bootstrap two-sided hypothesis testing; NS, not significant; ****, P < 0.00005. Source data
Fig. 6
Fig. 6. Antagonistic effect on induction time by RSC and Taf1 shows that nucleosomes cannot be competed away by Taf1.
a, Schematic showing Taf1 binding at the +1 nucleosome in the GAL10 promoter region. b, Taf1 depletion and simultaneous RSC and Taf1 depletion increased the induction time of GAL10. Significance determined by two-sided bootstrap hypothesis testing; ****, P < 0.00005. P values: ±RSC, P < 10−15; ±Taf1, P < 10−15; ±RSC and Taf1, P < 10−15. c, Taf1 and RSC depletion had a smaller effect on induction time than expected based on the individual depletions, indicating that RSC and Taf1 have opposing functions. Gray bar, expected effect based on dynamic epistasis analysis. d, Taf1 and RSC depletion had the expected effect on time between consecutive bursts. Gray bar, expected effect based on dynamic epistasis analysis. Data in c and d are presented as the fractional change based on mean values ± s.d. based on 1,000 bootstrap repeats. Source data
Fig. 7
Fig. 7. Model showing how the remodeling of different nucleosomes regulates transcriptional bursting at the GAL10 gene.
Upon induction of the GAL10 gene, the three promoter nucleosomes are remodeled to allow for transcription activation. Remodeling of the fragile nucleosome at the Gal4 UASs by RSC and Gal4 binding synergistically regulates the time between bursts. The nucleosomes in the region spanning the TATA and the TSS are redundantly displaced by RSC, SWI/SNF and TBP to regulate the first burst of transcription. Nucleosomes that shift into the promoter upon the loss of RSC and/or SWI/SNF are competed away by TBP. In the absence of remodeling by RSC or SWI/SNF, the partial depletion of TBP reduces the ability of TBP to compete with nucleosomes, such that induction is synergistically slowed down with RSC depletion. The stabilization of TBP by Mot1 depletion results in increased nucleosome competition and rescue of induction time. The mutation of the canonical TATA abolishes the ability of TBP to compete with nucleosomes, resulting in two populations, where either the nucleosome cover the TATA resulting in no activation, or the nucleosome is not covering the TATA resulting in RSC-independent transcription activation.
Extended Data Fig. 1
Extended Data Fig. 1. Genome-wide changes in nucleosome coverage upon depletion of RSC, SWI/SNF and RSC&SWI/SNF.
a, b MNase-seq analysis of (a) stable and (b) fragile nucleosomes in the GAL10 promoter region in active (galactose) and inactive (raffinose) conditions. c Schematic representation of nucleosome remodeling during activation of GAL10. Grey box: region with nucleosomes important for regulation of GAL10 that are discussed in this study. d, f, h, j, l, n Metagene MNase-seq analysis of stable or fragile nucleosomes (as indicated in the figure) upon RSC depletion by anchor-away of Sth1, SWI/SNF depletion by anchor-away of Swi2, or simultaneous depletion of RSC and SWI/SNF, averaged over all genes as annotated by, aligned at the location of the +1 nucleosome (black dashed line). e, g, i, k, m, o Heatmap of the log2-fold-change of depleted/nondepleted in nucleosome coverage of stable or fragile nucleosomes (as indicated in the figure) at all genes as annotated by, sorted by NDR width and aligned at the location of the +1 nucleosome, upon depletion of RSC, SWI/SNF or RSC and SWI/SNF depletion. Shown is one representative replicate out of two experiments for all except (j) and (k), which is a single replicate experiment. Source data
Extended Data Fig. 2
Extended Data Fig. 2. Verification of strains used for nuclear protein depletions using anchor-away.
a Growth of anchor-away yeast strains used in this study assessed on YEPD, YEP + Galactose + Etidium bromide and YEP + Galactose + Raffinose + Lithium Chloride plates with either DMSO or rapamycin. Shown are (1:5) serial dilutions of cultures, starting at OD600nm of 0.3. b Depletion of all indicated factors was verified by imaging cells after 60 min of rapamycin-treatment or control cells treated with DMSO. Shown is 1 typical cell per condition, out of at least 100 cells from three biological replicates. c-r No effect of cell-cycle stage on the fraction of (left) active cells and (right) number of RNAs at the TS active cells upon depletion of indicated factors based on smFISH experiments. Active cells defined as cells with 5 or more RNAs at TS. Error bars are SEOM from 3 independent experiments. Source data
Extended Data Fig. 3
Extended Data Fig. 3. Change in transcription dynamics and nucleosome coverage upon depletion of chromatin remodeling complexes.
ag Heatmap of TS intensity in (a) N = 292, (b) N = 213, (c) N = 453, (d) N = 151, (e) N = 202, (f) N = 471, and (g) N = 181 cells (rows) in the presence or absence of indicated factors. Yellow: TS fluorescence intensity; blue: region excluded from analysis. hj The (h) fraction of cells that activated during 1 hour of imaging, (i) the burst duration and (j) the burst intensity for depletions of RSC and/or SWI/SNF. k-l MNase-seq analysis of fragile nucleosomes in the GAL10 promoter region upon (k) SWI/SNF depletion and (l) simultaneous depletion of RSC and SWI/SNF compared to depletion of either RSC or SWI/SNF individually. m Western blot analysis with a V5 antibody showed reduced Gal4 expression (0.5 ± 0.1) of GAL4-3V5/gal4Δ compared to GAL4-3V5/GAL4-3V5 cells. Shown is an example blot and quantification over Pgk1 levels of 2 independent experiments. Black dots indicate individual results of both experiments, bars indicate mean value of the individual experiments. np The (n) fraction of cells that activated during 1 hour of imaging, (o) the burst duration and (p) the burst intensity for depletion of RSC, in GAL4/gal4Δ cells and the double perturbation. q, r Change in (q) fraction of active cells and (r) change in TS intensity of active cells based on smFISH upon depletion of the catalytic subunits of each of the yeast chromatin remodeling complexes. Active cells defined as cells with <5 RNAs at the TS. Error bars are SEOM from 3 independent experiments. (hj),(n–p) Data for active fraction is fractional change based on number of active and inactive cells + /- propagated statistical errors in these numbers. Data for other parameters are fractional change based on mean values + /- standard deviation based on 1000 bootstrap repeats. Grey bar: expected effect based on dynamic epistasis analysis. Source data
Extended Data Fig. 4
Extended Data Fig. 4. Transcriptional re-induction of GAL10 shows increase in the number of activation steps upon RSC and SWI/SNF depletion.
a Schematic explaining re-induction experiments. For non-memory induction, cells were grown in raffinose. For memory experiments, cells were primed by adding galactose for 45 min and subsequently washed and resuspended in the appropriate repression sugar 30 min before imaging. As in all experiments, rapamycin or DMSO was added for depletion 60 min prior to galactose addition and imaging. b GAL10 induction time in memory and non-memory conditions, upon depletion of RSC, SWI/SNF or both RSC and SWI/SNF. cg Change in (c) induction time, (d) active fraction, (e) burst duration, (f) time between bursts and (g) burst intensity upon depletion of RSC, SWI/SNF or both RSC and SWI/SNF. Data in (c) and (e)-(g) are presented as the fractional change based on mean values + /- standard deviation based on 1000 bootstrap repeats. Data in (d) is presented as the fractional change based on number of active and inactive cells + /- propagated statistical errors in the number of active and inactive cells. hy Distribution of induction time in memory or non-memory conditions as indicated on top in presence (grey) or absence (red, cyan or magenta) of remodeler indicated on the left. Black line: least-squares fit with Gamma distribution; inset: shape parameter k obtained from fit. Error obtained from least-squares fit. A k-value not significantly different from 1 indicates a single rate-limiting step, while k > 1 indicates multiple rate-limiting steps. Without remodeler depletion, re-induction after memory with glucose shows a single rate-liming step (v),(x), which increases to multiple rate-limiting steps after combined RSC&SWI/SNF depletion (w),(y). Source data
Extended Data Fig. 5
Extended Data Fig. 5. Transcription dynamics upon perturbed nucleosomes around the TATA, by depletion of TBP and RSC or SWI/SNF.
af Heatmap of TS intensity in (a) N = 139, (b) N = 120, (c) N = 122, (d) N = 340, (e) N = 179 and (f) N = 175 cells (rows) in the presence or absence of indicated factors. Yellow: TS fluorescence intensity; blue: region excluded from analysis. g The fraction of cells that activated during 1 hour of imaging when depleting TBP fully (-TBP, both copies tagged for depletion) or partially (reduced TBP, one copy tagged for depletion) using anchor-away. Data is the fraction based on the number of active and inactive cells + /- propagated statistical errors in these numbers. Significance determined by two-sided Fisher’s exact test; *: p < 0.05; ****: p < 0.00005. p-values: +TBP vs partial TBP 0.0062; +/-TBP 7.7 10−42. hj The fraction of (h) cells that activated during 1 hour of imaging, (i) the burst duration and (j) the burst intensity, in -RSC&Reduced TBP were as expected based on their individual depletions. k SWI/SNF and simultaneous TBP and SWI/SNF depletion showed increased GAL10 induction time. Significance in (n) determined by two-sided bootstrap hypothesis testing; n.s.: not significant; ****: p < 0.00005. p-values: +/- SWI/SNF < 10−15; +TBP vs partial TBP < 10−15; +SWI/SNF&TBP vs -SWI/SNF&partial TBP < 10−15. lp SWI/SNF and simultaneous TBP and SWI/SNF depletion showed (k) increased induction time of GAL10. (l) The fraction of cells that activated during 1 hour of imaging, (m) the burst duration, (n) the time between bursts, (o) the induction time and (p) the burst intensity for single and double depletion of SWI/SNF and reduced TBP. (h)-(j), (l)-(p) Data for active fraction is the fractional change based on number of active and inactive cells + /- propagated statistical errors in the number of active and inactive cells. Data for other parameters are the fractional change based on mean values + /- standard deviation based on 1000 bootstrap repeats. Grey bar: expected effect based on dynamic epistasis analysis. Source data
Extended Data Fig. 6
Extended Data Fig. 6. Distributions of the transcriptional bursting parameters for the strains used in this study.
a Active fractions for indicated strains used in this study. Error bars are propagated statistical errors in the number of active and inactive cells. b Distributions of the induction time for indicated strains in non-depleted (DMSO, left) or depleted (rapamycin, right) conditions. Black line: fit with Gamma distribution; inset: mean with standard deviation based on 1000 bootstrap repeats, shape parameter k with error obtained from least-squares fit and R2 of the fit. For the induction time distributions of +/− RSC, +/− SWI/SNF and +/− RSC&SWI/SNF in normal and memory conditions, see Extended Data Fig. 4. c Distributions of the burst duration for indicated strains in non-depleted (DMSO, left) or depleted (rapamycin, right) conditions. Black line: fit with Gamma distribution; inset: mean with standard deviation based on 1000 bootstrap repeats, shape parameter k with error obtained from least-squares fit and R2 of the fit. d Distributions of the time between bursts for indicated strains in non-depleted (DMSO, left) or depleted (rapamycin, right) conditions. Black line: fit with Gamma distribution; inset: mean with standard deviation based on 1000 bootstrap repeats, shape parameter k with error obtained from least-squares fit and R2 of the fit. e Distributions of the burst intensity for indicated strains in non-depleted (DMSO, left) or depleted (rapamycin, right) conditions. Black line: fit with log-normal distribution; inset: mean with standard deviation based on 1000 bootstrap repeats, μ with error obtained from least-squares fit and R2 of the fit. Source data
Extended Data Fig. 7
Extended Data Fig. 7. Genome-wide changes in nucleosome coverage upon depletion of RSC and TBP.
a, d Metagene MNase-seq analysis of (a) stable and (d) fragile nucleosomes upon RSC and TBP depletion, averaged over all genes as annotated by, aligned at the location of the +1 nucleosome (black dashed line). b, e Heatmap of the log2-fold-change of depletion/non-depleted in nucleosome coverage of (b) stable and (e) fragile nucleosomes at all genes as annotated by, sorted by NDR width and aligned at the location of the +1 nucleosome, upon RSC and TBP depletion. c, f Overlay of metagene MNase-seq profiles of (c) stable and (f) fragile nucleosomes upon RSC depletion and simultaneous RSC and TBP depletion, averaged over all genes as annotated by, aligned at the location of the +1 nucleosome (black dashed line). g Cumulative distribution of coverage of stable nucleosomes in TATA or TATA-mismatch elements genome-wide upon depletion of RSC, showing a larger increase in coverage at TATA-mismatch elements than at a TATA-elements. h Cumulative distribution of coverage of stable nucleosomes in TATA or TATA-mismatch elements genome-wide upon simultaneous depletion of RSC and TBP. i Overlay of cumulative distributions of coverage of stable nucleosomes in TATA or TATA-mismatch regions genome-wide upon depletion of RSC or simultaneous depletion of RSC and TBP, showing that partial TBP depletion specifically increased the coverage at TATA-elements. Shown is one representative replicate out of two experiments for all plots. Source data
Extended Data Fig. 8
Extended Data Fig. 8. Change in transcriptional bursting when TBP residence time is perturbed in -RSC and hht2Δ-hhf2Δ.
a-p Heatmap of TS intensity in (a) N = 315, (b) N = 303, (c) N = 276, (d) N = 285, (e) N = 82, (f) N = 145, (g) N = 231, (h) N = 288, (i) N = 114, (j) N = 275 cells, (k) N = 362, (l) N = 503, (m) N = 311, (n) N = 462, (o) N = 559, and (p) N = 233 (rows) in the presence or absence of indicated factors. Yellow: TS fluorescence intensity; blue: region excluded from analysis. q Change in indicated parameters in -RSC and/or TATA-mut. r, s Change in the fraction of cells that activate during 1 hour of imaging, the burst duration and the burst intensity when depleting RSC and/or (r) Mot1 or (s) Taf1. t Western blot analysis with H3 and H3K79me3 antibodies of hht2Δ-hhf2Δ and HHT2-HHF2 cells. αH3K79me3 suggested reduced histone levels (0.67 ± 0.06 of wildtype). Shown is an example blot (N = 2) and quantification over Pgk1 levels. Black dots: individual experiments, bars: mean. u GAL10 induction time in indicated strains. Both + /−RSC, induction time is increased upon TATA-mut or TBP depletion, but this is partially rescued by hht2Δ-hhf2Δ. Significance is determined by bootstrap hypothesis testing; **: p < 0.005, ****: p < 0.00005. p-values: -RSC vs -RSC&TATA-mut <10−15; -RSC vs -RSC&partial TBP < 10−15; -RSC vs -RSC & hht2Δ-hhf2Δ <10−15; -RSC vs -RSC&TATA-mut&hht2Δ-hhf2Δ 0.002; -RSC vs -RSC&partial TBP&hht2Δ-hhf2Δ <10−15; +RSC vs +RSC&TATA-mut <10−15; +RSC vs +RSC&TBP < 10−15; +RSC vs +RSC&hht2Δ-hhf2Δ <10−15; +RSC vs +RSC&TATA-mut&hht2Δ-hhf2Δ <10−15; +RSC vs +RSC&TBP&hht2Δ-hhf2Δ <10−15. v Change in indicated parameters in -RSC in TATA-mut and/or hht2Δ-hhf2Δ. Note: calculated relative to -RSC cells. w, x Change in indicated parameters in RSC-non-depleted cells in (w) TATA-mut or (x) partial TBP depletion and/or hht2Δ-hhf2Δ. Note: calculated relative to (w) +RSC cells and (x) -RSC cells. (r)-(s), (w)-(x), (l) Data for active fraction in is presented as the fractional change based on number of active and inactive cells + /− propagated statistical errors in these numbers. Data for the other parameters are presented as the fractional change based on mean values + /− standard deviation based on 1000 bootstrap repeats. Grey bar: expected effect based on dynamic epistasis analysis. Source data

References

    1. Rodriguez J, et al. Intrinsic dynamics of a human gene reveal the basis of expression heterogeneity. Cell. 2019;176:213–226. doi: 10.1016/j.cell.2018.11.026. - DOI - PMC - PubMed
    1. Bartman CR, Hsu SC, Hsiung CCS, Raj A, Blobel GA. Enhancer regulation of transcriptional bursting parameters revealed by forced chromatin looping. Mol. Cell. 2016;62:237–247. doi: 10.1016/j.molcel.2016.03.007. - DOI - PMC - PubMed
    1. Fukaya T, Lim B, Levine M. Enhancer control of transcriptional bursting. Cell. 2016;166:358–368. doi: 10.1016/j.cell.2016.05.025. - DOI - PMC - PubMed
    1. Donovan BT, et al. Live-cell imaging reveals the interplay between transcription factors, nucleosomes, and bursting. EMBO J. 2019;38:e100809. doi: 10.15252/embj.2018100809. - DOI - PMC - PubMed
    1. Pimmett VL, et al. Quantitative imaging of transcription in living Drosophila embryos reveals the impact of core promoter motifs on promoter state dynamics. Nat. Commun. 2021;12:4504. doi: 10.1038/s41467-021-24461-6. - DOI - PMC - PubMed

Publication types

MeSH terms