Randomized Controlled Trial
. 2023 May;5(5):880-895.
doi: 10.1038/s42255-023-00799-7. Epub 2023 May 1.

Effects of different doses of exercise and diet-induced weight loss on beta-cell function in type 2 diabetes (DOSE-EX): a randomized clinical trial

Affiliations
Randomized Controlled Trial

Effects of different doses of exercise and diet-induced weight loss on beta-cell function in type 2 diabetes (DOSE-EX): a randomized clinical trial

Grit E Legaard et al. Nat Metab. 2023 May.

Abstract

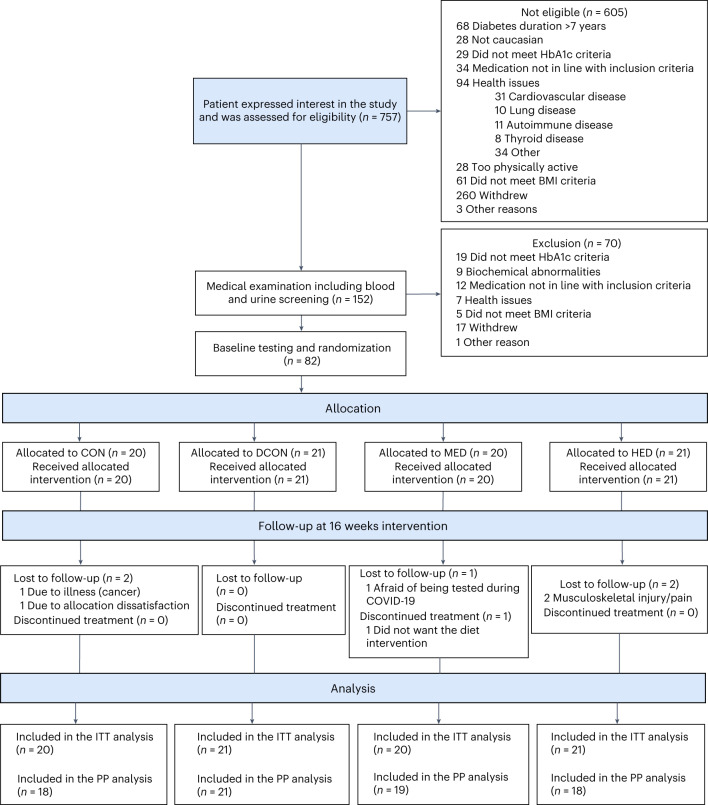
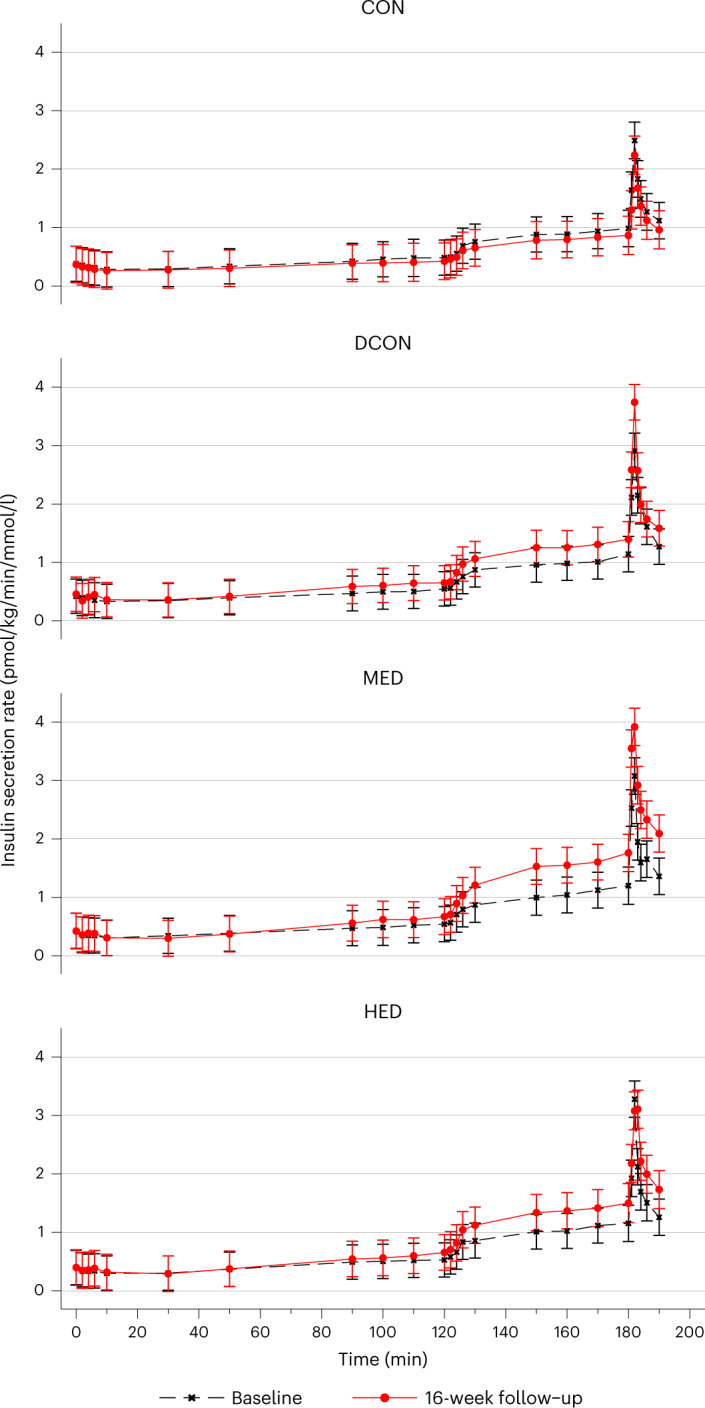
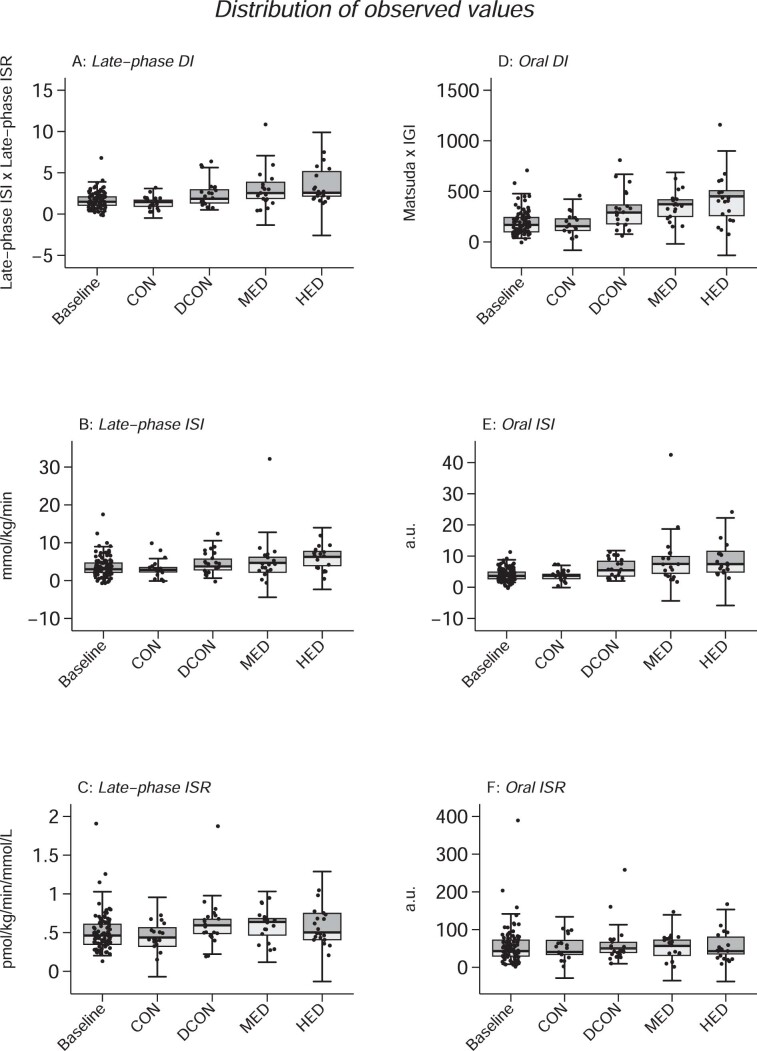
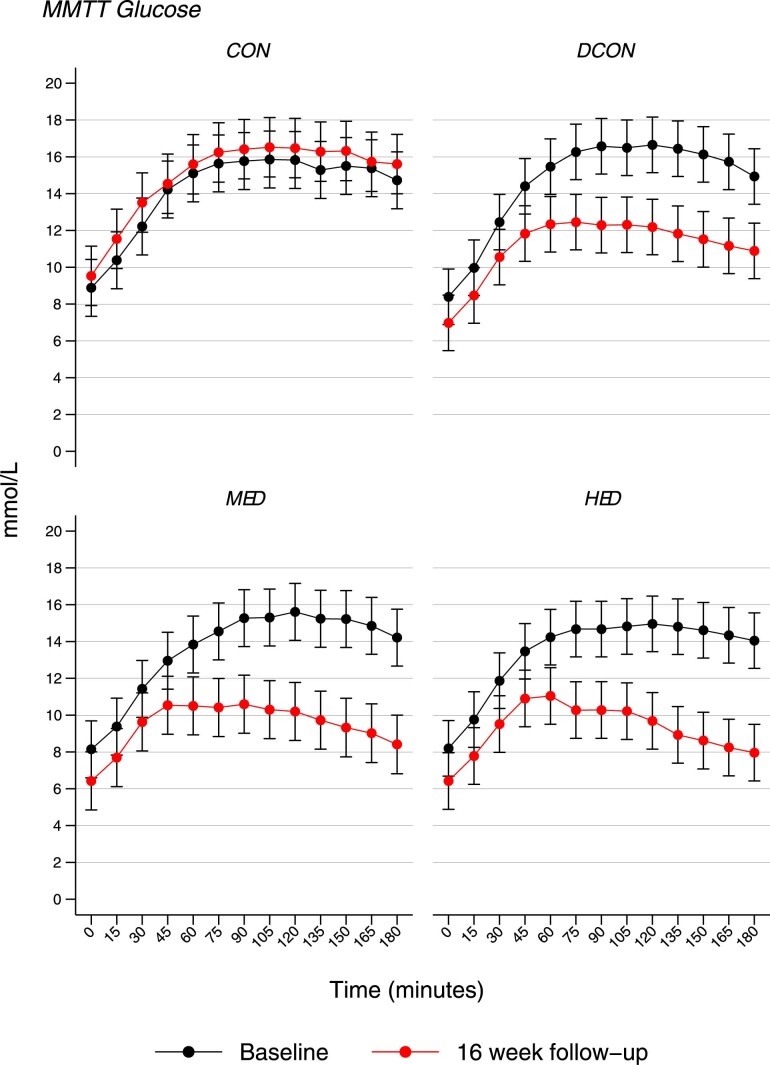
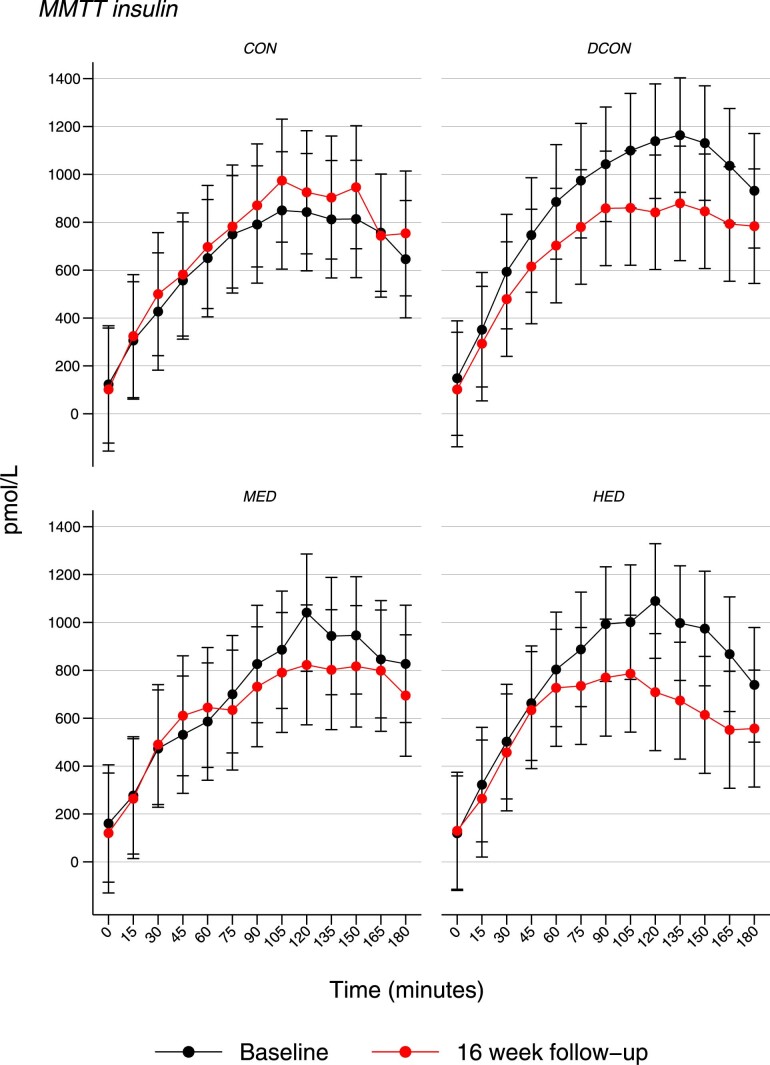
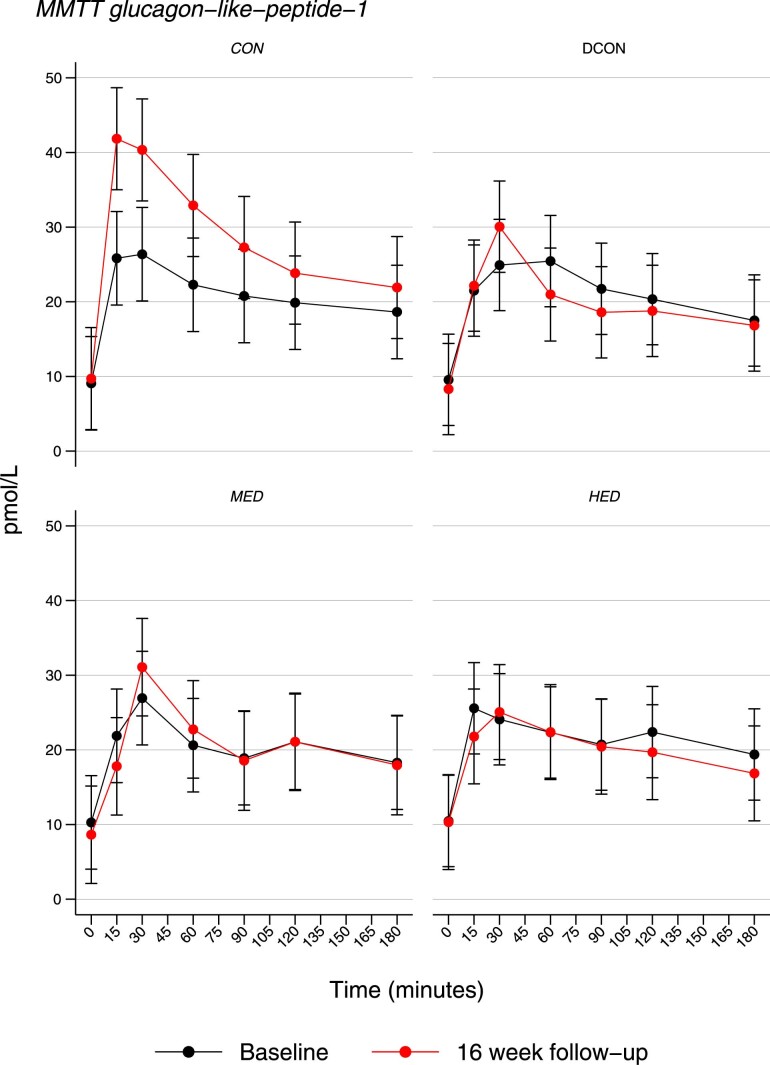
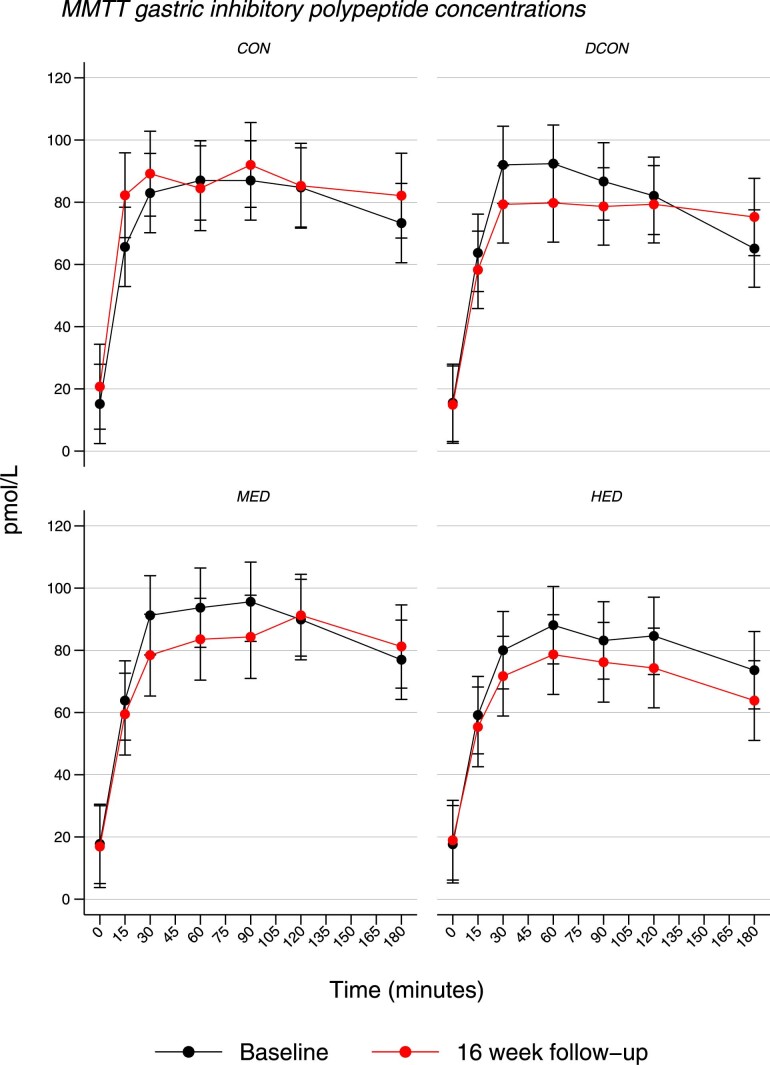
Diet-induced weight loss is associated with improved beta-cell function in people with type 2 diabetes (T2D) with remaining secretory capacity. It is unknown if adding exercise to diet-induced weight loss improves beta-cell function and if exercise volume is important for improving beta-cell function in this context. Here, we carried out a four-armed randomized trial with a total of 82 persons (35% females, mean age (s.d.) of 58.2 years (9.8)) with newly diagnosed T2D (<7 years). Participants were randomly allocated to standard care (n = 20), calorie restriction (25% energy reduction; n = 21), calorie restriction and exercise three times per week (n = 20), or calorie restriction and exercise six times per week (n = 21) for 16 weeks. The primary outcome was beta-cell function as indicated by the late-phase disposition index (insulin secretion multiplied by insulin sensitivity) at steady-state hyperglycemia during a hyperglycemic clamp. Secondary outcomes included glucose-stimulated insulin secretion and sensitivity as well as the disposition, insulin sensitivity, and secretion indices derived from a liquid mixed meal tolerance test. We show that the late-phase disposition index during the clamp increases more in all three intervention groups than in standard care (diet control group, 58%; 95% confidence interval (CI), 16 to 116; moderate exercise dose group, 105%; 95% CI, 49 to 182; high exercise dose group, 137%; 95% CI, 73 to 225) and follows a linear dose-response relationship (P > 0.001 for trend). We report three serious adverse events (two in the control group and one in the diet control group), as well as adverse events in two participants in the diet control group, and five participants each in the moderate and high exercise dose groups. Overall, adding an exercise intervention to diet-induced weight loss improves glucose-stimulated beta-cell function in people with newly diagnosed T2D in an exercise dose-dependent manner (NCT03769883).


Conflict of interest statement

J.J.H. is a member of advisory boards for Novo Nordisk. All other authors declare that they have no competing interests.

Figures

Fig. 1
Fig. 1. Flow of participants.
CON, control group; DCON, diet control group; MED, moderate exercise dose group; HED, high exercise dose group; ITT, intention-to-treat; PP, per-protocol.
Fig. 2
Fig. 2. Changes from constrained baseline to 16-week follow-up in the primary and secondary outcomes.
af, The bars represent estimated mean change from baseline for each intervention group from the n = 82 persons included in the study. Error bars represent 95% confidence intervals. Data were log(e)-transformed and back-transformed, and the results are presented as relative (percentage term) changes based on the ratio of geometric mean change from baseline to follow-up. Results were adjusted for sex. Data were analyzed using a constrained baseline longitudinal model. The dots represent the relative (percentage term) individual changes from baseline to follow-up. Left panel: Data are based on the final 30 min of the hyperglycemic clamp (stage 1). Right panel: Data are from 0 to 120 min of the MMTT. a, Change in late-phase DI by group. b, Change in late-phase ISI by group. c, Change in late-phase ISR by group. d, Change in oral DI of the MMTT by group. e, Change in oral ISI by group. f, Change in oral ISR by group. CON, n = 20; DCON, n = 21; MED, n = 20; HED, n = 21.
Fig. 3
Fig. 3. Insulin secretion rate across a three-phase hyperglycemic clamp.
Data are represented as the marginal means with 95% confidence intervals. Results are adjusted for sex. Data were analyzed using a longitudinal mixed model. The black dashed line represents baseline values, and the red solid line represents the 16-week follow-up values.
Extended Data Fig. 1
Extended Data Fig. 1. Box-plots for baseline values and by group at follow-up.
As the primary analyses are performed using a constrained baseline model, where all groups are assumed to be similar a baseline, the baseline values are not depicted by group. Circles denotes the individual participant values. Center line is the median values, light grey area is the lower inter quartile range, dark grey area is the upper interquartile range, the whiskers show + /-1.5 x the interquartile range, CON: control group (N = 20 independent samples), DCON: Dietary control group (N = 21 independent samples), MED: Moderate volume exercise (N = 20 independent samples), HED: High volume exercise (N = 21 independent samples), DI: Disposition index, ISI: Insulin sensitivity index, ISR: Insulin secretion rate, pmol: pico mol, mmol: milli mol, a.u.: arbitrary units, kg: kilograms.
Extended Data Fig. 2
Extended Data Fig. 2. The black circles represent baseline values, and the red circles represents the 16-week follow-up values.
Data are represented as the estimated means. Error bars are 95% confidence intervals. Results are adjusted for sex. Time 0-120 minutes is the hyperglycemic phase. Time 120-180 minutes is the hyperglycemic - and GLP-1 stimulation phase. Time 180-190 minutes is the hyperglycemic, GLP-1, and Arginine HCl stimulation phase. CON: control group (N = 20 independent samples), DCON: Dietary control group (N = 21 independent samples), MED: Moderate volume exercise (N = 20 independent samples), HED: High volume exercise (N = 21 independent samples).
Extended Data Fig. 3
Extended Data Fig. 3. The black circles represent baseline values, and the red circles represents the 16-week follow-up values.
Data are represented as the estimated means. Error bars are 95% confidence intervals. Results are adjusted for sex. CON: control group (N = 20 independent samples), DCON: Dietary control group (N = 21 independent samples), MED: Moderate volume exercise (N = 20 independent samples), HED: High volume exercise (N = 21 independent samples).
Extended Data Fig. 4
Extended Data Fig. 4. The black circles represent baseline values, and the red circles represents the 16-week follow-up values.
Data are represented as the estimated means. Error bars are 95% confidence intervals. Results are adjusted for sex. CON: control group (N = 20 independent samples), DCON: Dietary control group (N = 21 independent samples), MED: Moderate volume exercise (N = 20 independent samples), HED: High volume exercise (N = 21 independent samples).
Extended Data Fig. 5
Extended Data Fig. 5. The black circles represent baseline values, and the red circles represents the 16-week follow-up values.
Data are represented as the estimated means. Error bars are 95% confidence intervals. Results are adjusted for sex. CON: control group (N = 20 independent samples), DCON: Dietary control group (N = 21 independent samples), MED: Moderate volume exercise (N = 20 independent samples), HED: High volume exercise (N = 21 independent samples).
Extended Data Fig. 6
Extended Data Fig. 6. Represented as the estimated means.
Error bars are 95% confidence intervals. Results are adjusted for sex. CON: control group (N = 20 independent samples), DCON: Dietary control group (N = 21 independent samples), MED: Moderate volume exercise (N = 20 independent samples), HED: High volume exercise (N = 21 independent samples).
Extended Data Fig. 7
Extended Data Fig. 7. The black circles represent baseline values, and the red circles represents the 16-week follow-up values.
Data are represented as the estimated means. Error bars are 95% confidence intervals. Results are adjusted for sex. CON: control group (N = 20 independent samples), DCON: Dietary control group (N = 21 independent samples), MED: Moderate volume exercise (N = 20 independent samples), HED: High volume exercise (N = 21 independent samples).
Extended Data Fig. 8
Extended Data Fig. 8. The black circles represent baseline values, and the red circles represents the 16-week follow-up values.
Data are represented as the estimated means. Error bars are 95% confidence intervals. Results are adjusted for sex. CON: control group (N = 20 independent samples), DCON: Dietary control group (N = 21 independent samples), MED: Moderate volume exercise (N = 20 independent samples), HED: High volume exercise (N = 21 independent samples).

References

    1. Schwartz SS, et al. A unified pathophysiological construct of diabetes and its complications. Trends Endocrinol. Metab. 2017;28:645–655. doi: 10.1016/j.tem.2017.05.005. - DOI - PubMed
    1. Magkos F, et al. Effects of moderate and subsequent progressive weight loss on metabolic function and adipose tissue biology in humans with obesity. Cell Metab. 2016;23:591–601. doi: 10.1016/j.cmet.2016.02.005. - DOI - PMC - PubMed
    1. Lim EL, et al. Reversal of type 2 diabetes: normalisation of beta cell function in association with decreased pancreas and liver triacylglycerol. Diabetologia. 2011;54:2506–2514. doi: 10.1007/s00125-011-2204-7. - DOI - PMC - PubMed
    1. Taylor R, et al. Remission of human type 2 diabetes requires decrease in liver and pancreas fat content but is dependent upon capacity for β cell recovery. Cell Metab. 2018;28:547–556.e3. doi: 10.1016/j.cmet.2018.07.003. - DOI - PubMed
    1. Karstoft K, et al. Mechanisms behind the superior effects of interval vs continuous training on glycaemic control in individuals with type 2 diabetes: a randomised controlled trial. Diabetologia. 2014;57:2081–2093. doi: 10.1007/s00125-014-3334-5. - DOI - PubMed

Publication types

Associated data