. 2023 Jun;24(6):1020-1035.
doi: 10.1038/s41590-023-01504-2. Epub 2023 May 1.

Conserved transcriptional connectivity of regulatory T cells in the tumor microenvironment informs new combination cancer therapy strategies

Affiliations

Conserved transcriptional connectivity of regulatory T cells in the tumor microenvironment informs new combination cancer therapy strategies

Ariella Glasner et al. Nat Immunol. 2023 Jun.

Abstract

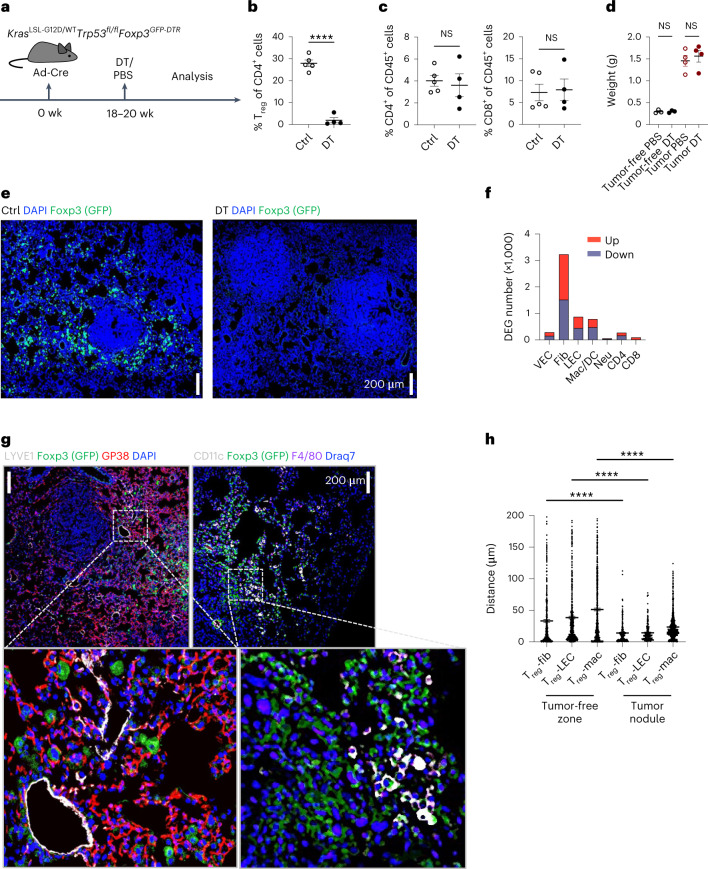
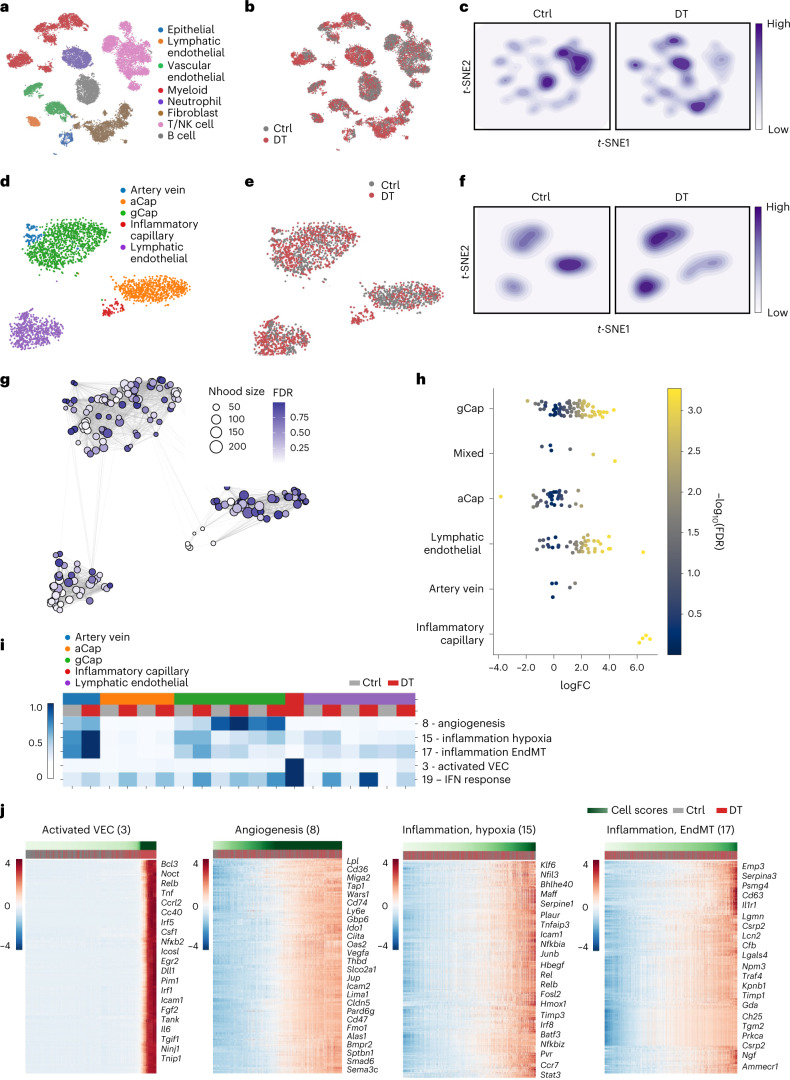
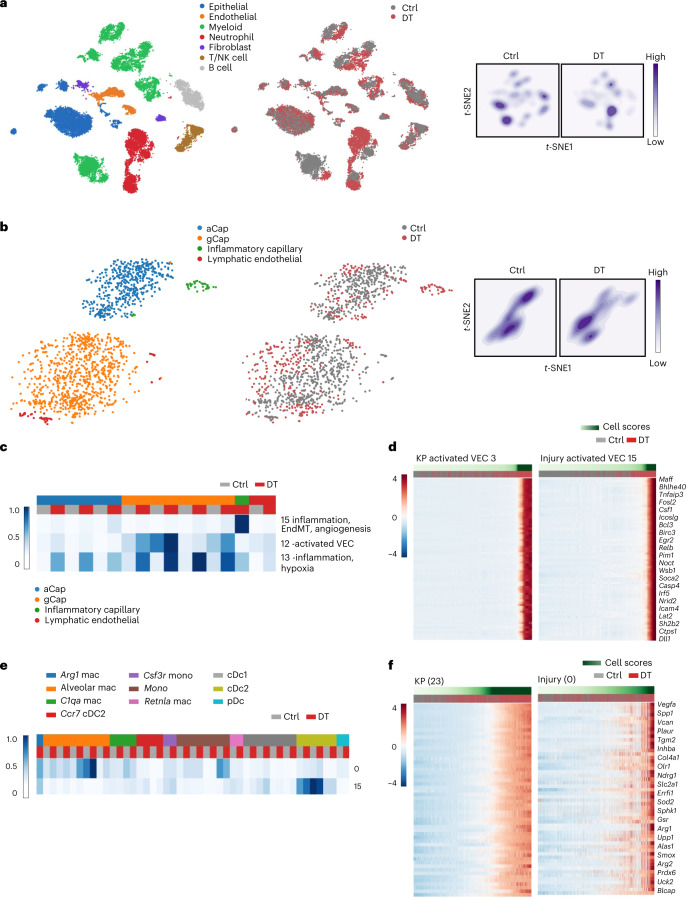
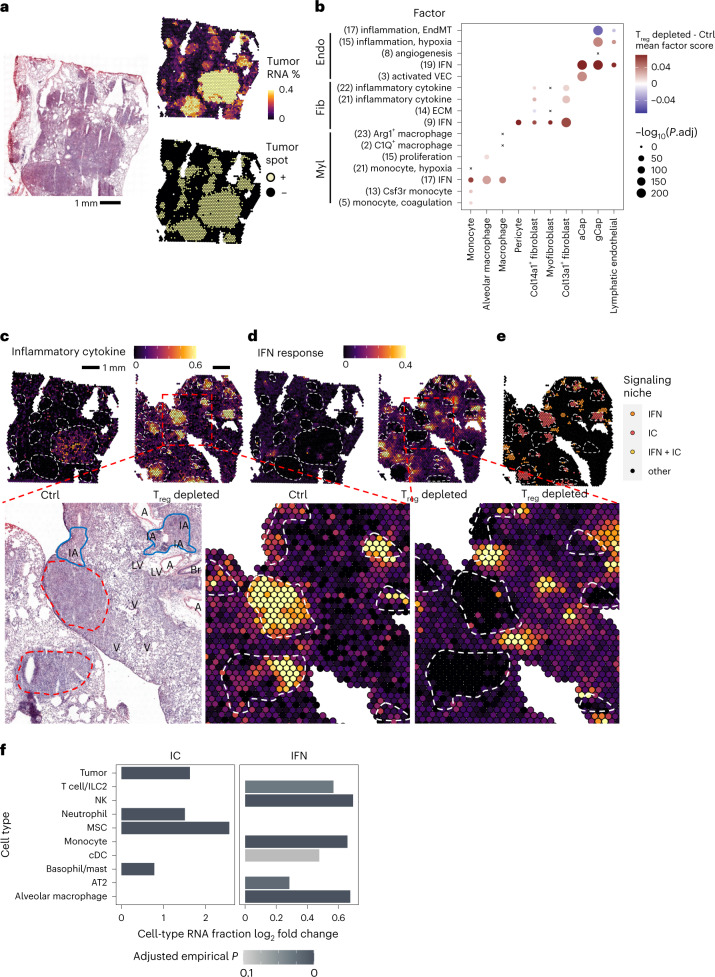
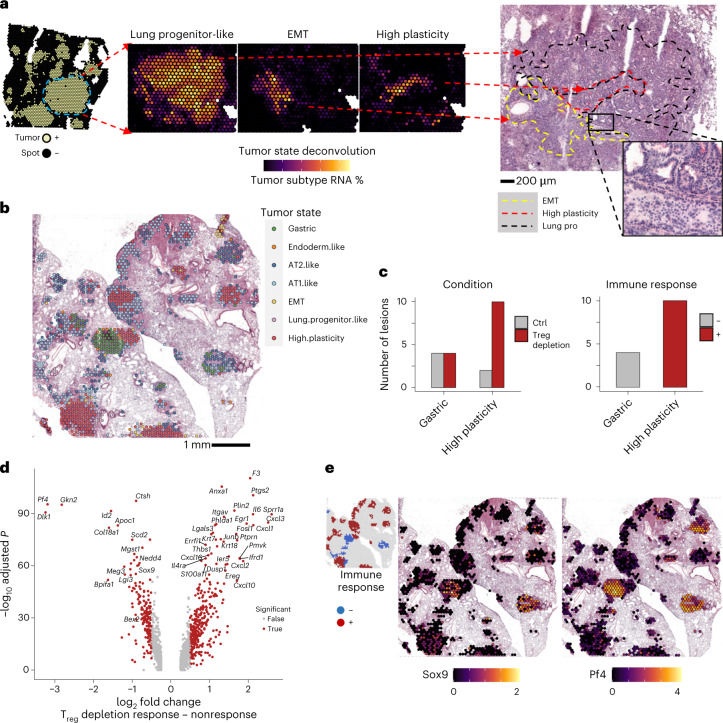
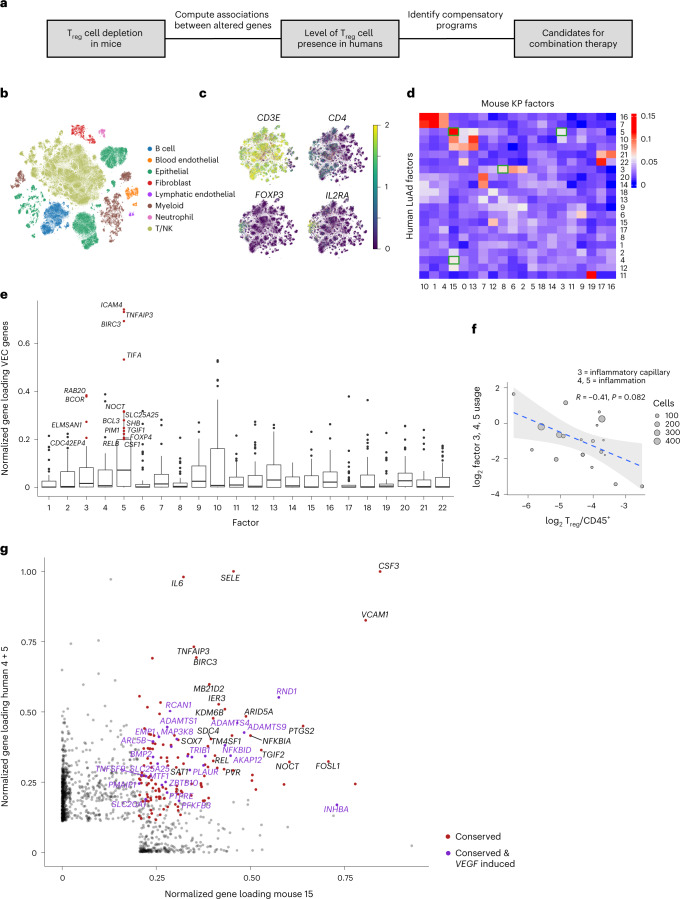
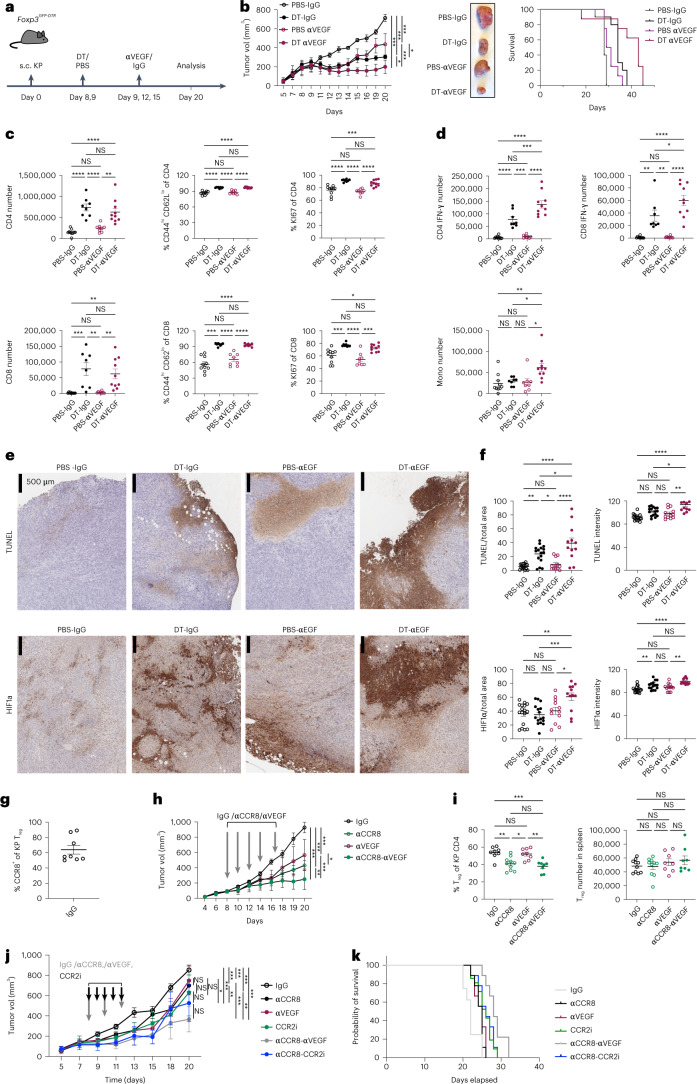
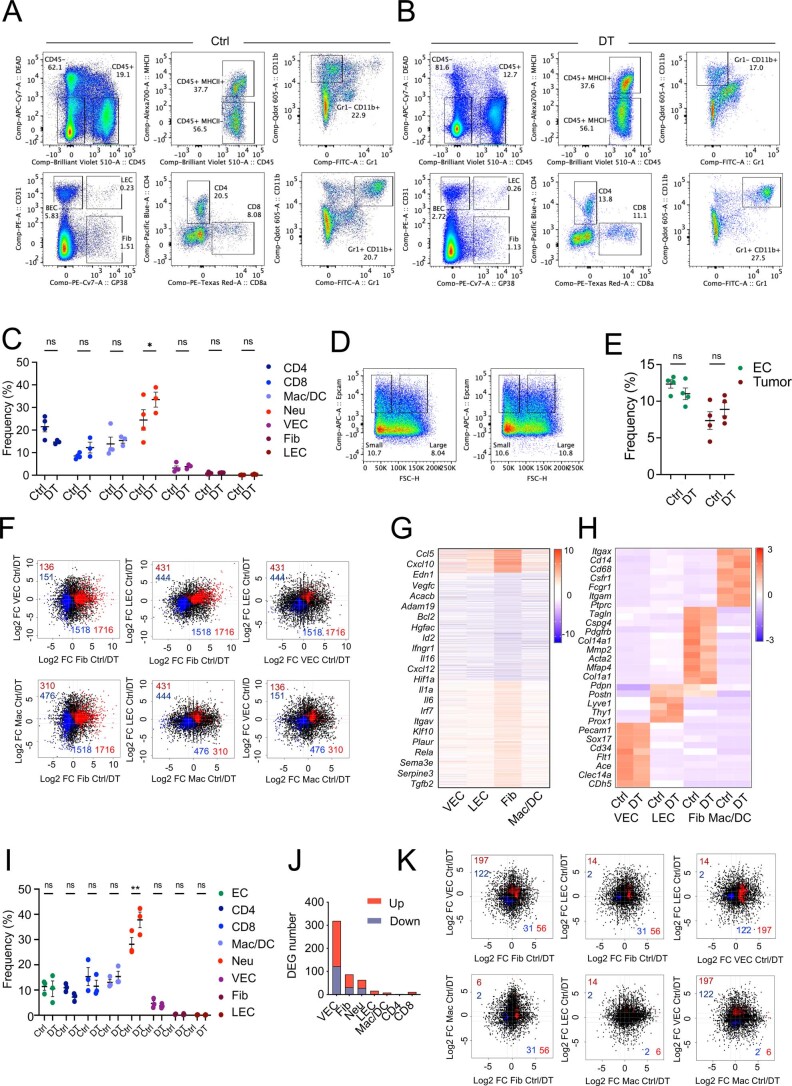
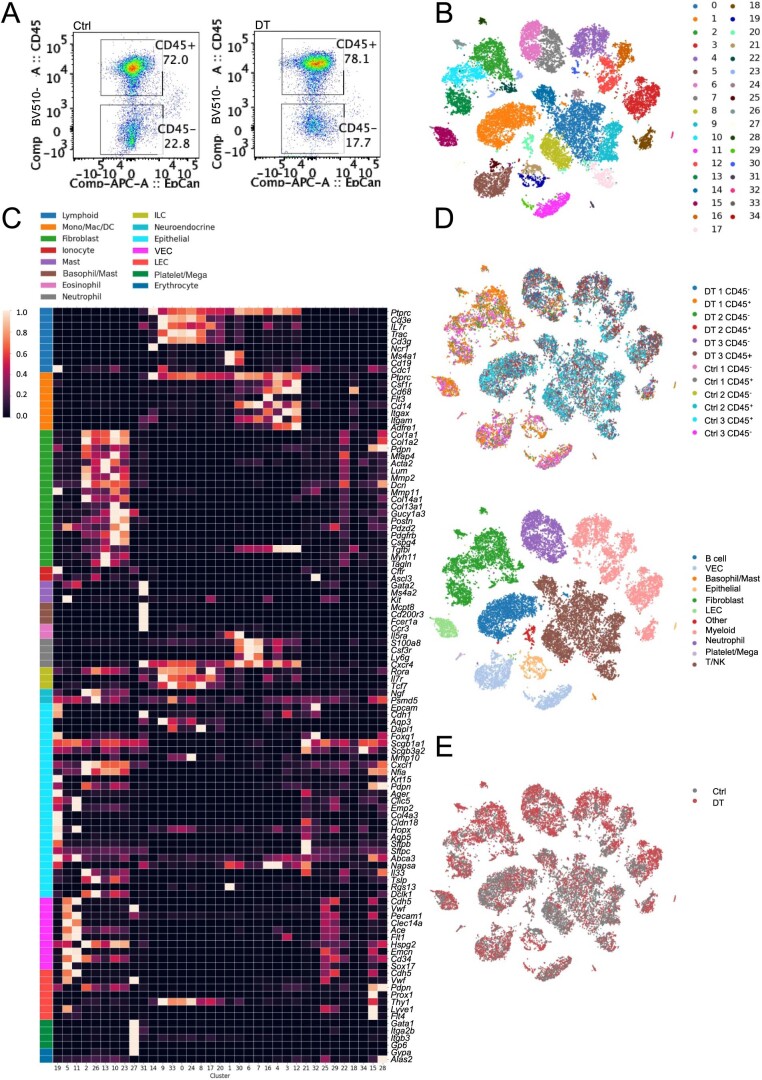
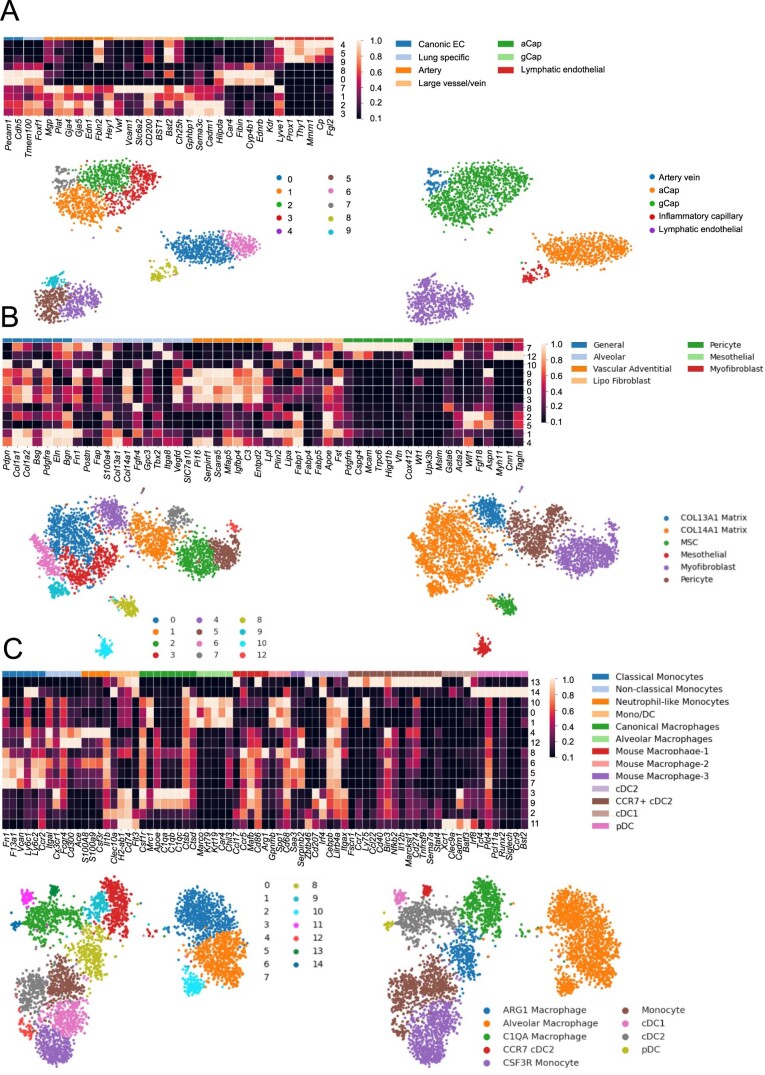
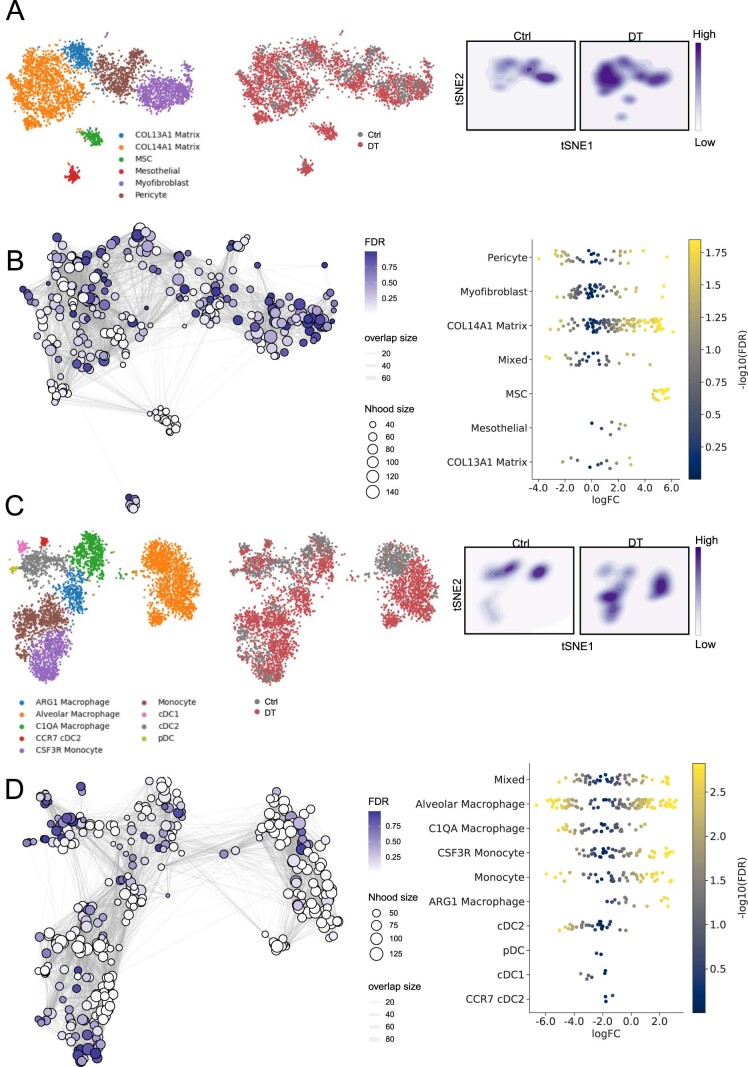
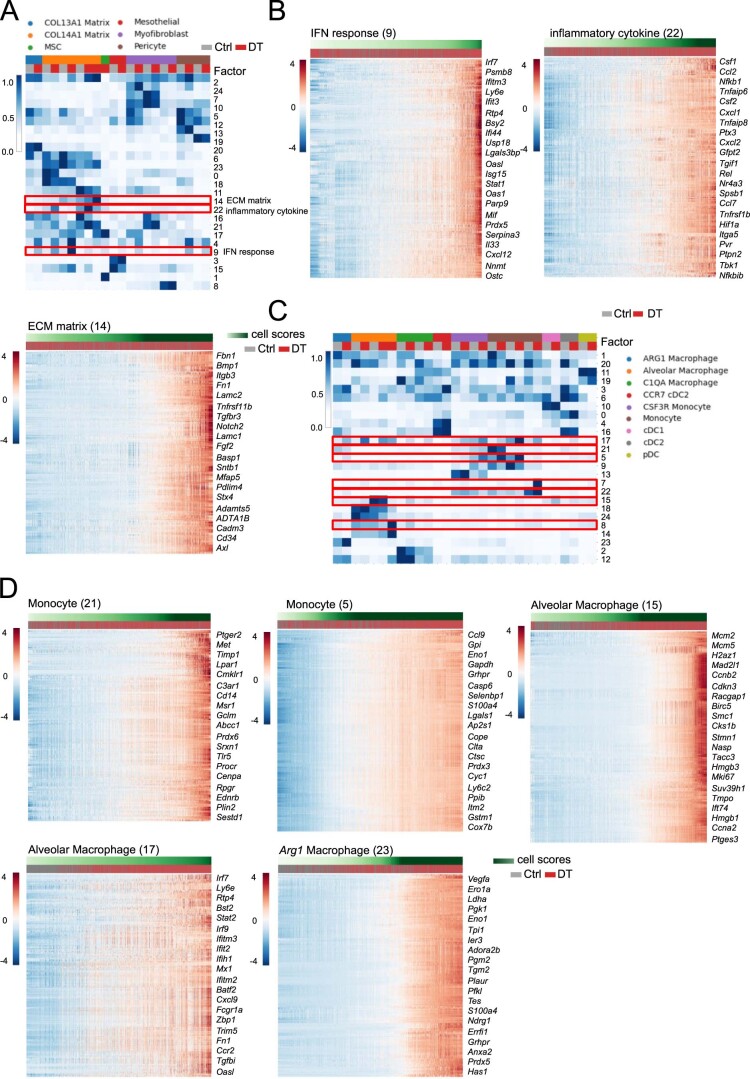
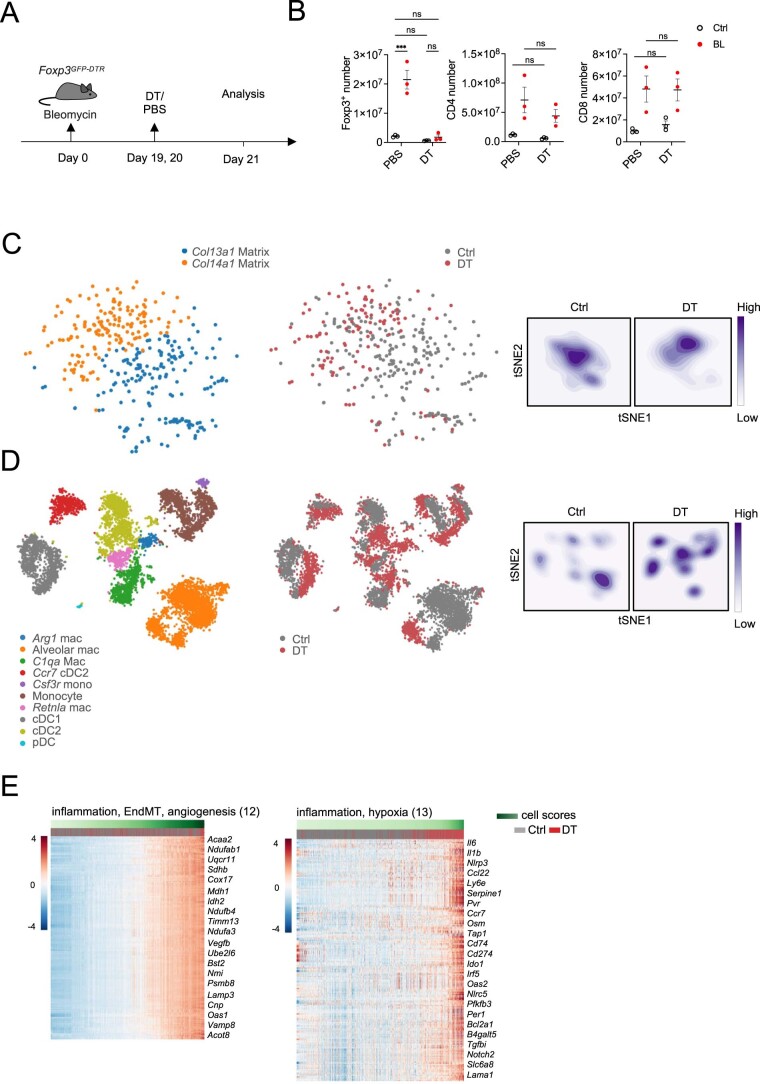
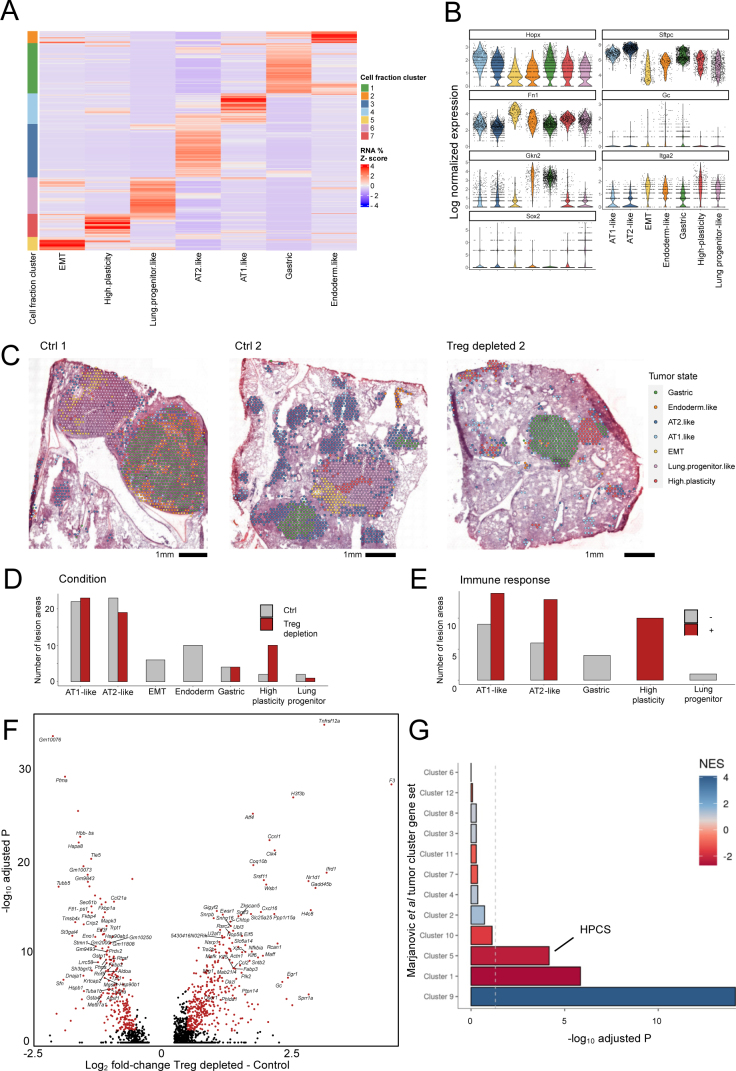
While regulatory T (Treg) cells are traditionally viewed as professional suppressors of antigen presenting cells and effector T cells in both autoimmunity and cancer, recent findings of distinct Treg cell functions in tissue maintenance suggest that their regulatory purview extends to a wider range of cells and is broader than previously assumed. To elucidate tumoral Treg cell 'connectivity' to diverse tumor-supporting accessory cell types, we explored immediate early changes in their single-cell transcriptomes upon punctual Treg cell depletion in experimental lung cancer and injury-induced inflammation. Before any notable T cell activation and inflammation, fibroblasts, endothelial and myeloid cells exhibited pronounced changes in their gene expression in both cancer and injury settings. Factor analysis revealed shared Treg cell-dependent gene programs, foremost, prominent upregulation of VEGF and CCR2 signaling-related genes upon Treg cell deprivation in either setting, as well as in Treg cell-poor versus Treg cell-rich human lung adenocarcinomas. Accordingly, punctual Treg cell depletion combined with short-term VEGF blockade showed markedly improved control of PD-1 blockade-resistant lung adenocarcinoma progression in mice compared to the corresponding monotherapies, highlighting a promising factor-based querying approach to elucidating new rational combination treatments of solid organ cancers.


Conflict of interest statement

A.Y.R. is a member of SAB, and has equity in Surface Oncology, RAPT Therapeutics, Sonoma Biotherapeutics, Santa Ana Bio and Vedanta Biosciences and is an SAB member of BioInvent and Amgen; A.Y.R. holds a therapeutic Treg cell depletion IP licensed to Takeda. C.M.R. has consulted regarding oncology drug development with AbbVie, Amgen, Astra Zeneca, D2G, Daiichi Sankyo, Epizyme, Genentech/Roche, Ipsen, Jazz, Kowa, and Merck, and is a member of the SAB of Auron, Bridge Medicines, Earli, and Harpoon Therapeutics. D.P is a member of the SAB and has equity in Insitro. The remaining authors declare no competing interests.

Figures

Fig. 1
Fig. 1. Early transcriptional responses of principal accessory cell populations in the lung adenocarcinoma TME to Treg cell depletion.
a, Schematic of the experimental design. b,c, Quantification of Treg (CD4+Foxp3+) one-tailed unpaired t-test P = 12.87, d.f. = 7 ****P < 0.0001 and Tcon (TCRβ+CD4+ and TCRβ+CD8+) cell populations; left, one-tailed t-test P = 0.3799, d.f. = 7, not significant (NS) P = 0.3576; right, one-tailed t-test P= 0.1925, d.f. = 7, NS P = 0.4264, in tumor-bearing lungs 48 h after diphtheria toxin (DT) or PBS (Ctrl) administration. d, Quantification of lung weight in tumor-free and tumor-bearing mice 48 h after DT-induced Treg cell depletion. One-way analysis of variance (ANOVA) followed by Sidak’s multiple-comparisons test. Tumor-free PBS versus tumor-free DT, P = 0.004037, d.f. = 10 NS P > 0.9999; tumor PBS versus tumor DT, P = 0.7450, d.f. = 10, NS P = 0.9787. e, Representative IF staining of Foxp3+ cells in tumor-bearing lungs of Ctrl and DT-treated mice. f, Numbers of upregulated (red) or downregulated (blue) DEGs (P < 0.05) 48 h after DT or PBS administration identified by bulk RNA-seq analysis of the indicated cell subsets. Fib, fibroblasts; Neu, neutrophils; Mac, macrophages; CD4 and CD8, effector CD4+ and CD8+ T cells. g, Representative IF staining of the indicated cell types. h, Quantification of distances between Treg cells and the indicated cell types. One-way ANOVA, alpha = 0.05, followed by Tukey’s multiple-comparison test Treg-Fib tumor-free zone versus tumor nodule, q = 8.041, d.f. = 2544 ****P < 0.0001. Treg-LEC tumor-free zone versus tumor nodule q = 10.08, d.f. = 2544, ****P < 0.0001, Treg-Mac versus tumor-free zone versus tumor nodule q = 17.79, d.f. = 2544, ****P < 0.0001. At least 200 cells were counted in each comparison. Three independent sections per mouse were analyzed. Three and four mice were used in each group in two independent experiments. Data are presented as the mean ± s.e.m. (bd) (b and c) N = Ctrl-5, DT-4, (d) N = 3 tumor-free PBS, 3 tumor-free DT, 4 tumor PBS, 4 tumor DT. Data are presented as the mean ± s.e.m. Source data
Fig. 2
Fig. 2. Single-cell transcriptomic analysis of ‘Treg cell dependencies’ of accessory cell states in mouse lung adenocarcinoma tumor microenvironment.
a,b, t-distributed stochastic neighbor embedding (t-SNE) plots (27,000 cells) representing cell populations from major cell lineages isolated from 48 h DT-treated or PBS-treated (Ctrl) tumor-bearing lungs (three mice per group) colored by cell type (a) and condition (b). c, A density plot showing the distribution of cells between experimental conditions. d,e, t-SNE plots (2,815 cells) representing distribution of the VEC populations colored by subtype (d) and condition (e). f, A density plot of endothelial cells showing the distribution of cells between experimental conditions. g, Graph of neighborhoods of endothelial cells computed using MiloR and t-SNE embedding. Each dot represents a neighborhood and is color coded by the false discovery rate (FDR)-corrected P value (alpha = 1) quantifying the significance of enrichment of DT cells compared to control in each neighborhood. The size of the dot represents the number of cells in the neighborhood. h, Swarm plot depicting the log fold change of differential cell-type abundance in DT-treated versus control samples in each neighborhood across different endothelial cell types. Each dot represents a neighborhood and is color coded by the FDR-corrected P value (alpha = 1) quantifying the significance of enrichment of DT cells compared to control in each neighborhood. A neighborhood is classified as a cell type if it comprises at least 80% of cells in the neighborhood, otherwise it is called ‘mixed’. i, Heat map showing average factor cell score in each cluster for each experimental condition in the VEC population. The scores were row normalized between 0 and 1. Each row represents a factor, and each column represents a cluster in a specific experimental condition. The clusters are grouped based on their phenotype. j, Gene expression heat maps showing the top 200 genes that correlated the most with the imputed activated VEC factor indicated (Methods). Each column represents a cell; cells are ordered based on their factor score (in ascending order from left to right) indicated by the green bar. Select genes of interest are noted on the right. b, e, h and i; Ctrl, PBS, gray; DT, red. Source data
Fig. 3
Fig. 3. Shared early transcriptional responses induced upon Treg cell depletion in mouse lung adenocarcinoma TME and bleomycin-induced lung inflammation.
a, t-SNE plots (24,592 cells) representing cell populations isolated from the lungs of mice administered with diphtheria toxin (DT) or PBS (Ctrl) for 48 h. Lung injury-induced inflammation was induced in both groups of mice upon bleomycin treatment 21 d before DT/PBS administration. The data represent analysis of three mice per group colored by cell type (left) and condition (middle), and a density of the distribution of cells between conditions (right). b, t-SNE embedding of endothelial cells isolated from Ctrl and DT after bleomycin administration color coded by cell type (left) or experimental condition (middle), and density plots of the distribution of endothelial cells between conditions (right). c, Heat map showing average factor cell score in each cell type for each experimental condition for endothelial cell subsets. The scores were row normalized between 0 and 1. Each row represents a factor, and each column represents an endothelial cell subset in a specific experimental condition. Factors of interest are highlighted by a red box. d, Heat map showing the 72 shared genes specific to activated VEC factor in both lung challenge models (Methods and Supplementary Table 9). Each column represents a cell; cells are ordered based on their factor score (in ascending order from left to right), indicated by the green bar. e, Heat map showing factor cell score across experimental conditions averaged over each myeloid cluster in each experimental condition for bleomycin-administered cells. The rows are factors and columns are clusters for each experimental condition. The clusters are grouped based on the cell type they are associated with. The heat map shows row-normalized scores from 0 to 1. The left color bar shows the average factor cell score. f, Heat maps showing the 54 shared genes between mouse lung tumor and injury-induced inflammation in the Arg1+ macrophage factor (tumor factor 23 corresponding to injury-induced inflammation factor 0; Supplementary Table 10). Each column is a cell; cells are ordered based on their factor score (in ascending order from left to right) indicated by the green bar. The treatment condition for each cell is indicated by gray for PBS and red for DT bars. Select genes of interest are shown. Source data
Fig. 4
Fig. 4. Spatial transcriptomics identifies distinct inflammatory cytokine and IFN signaling niches in lung adenocarcinoma following Treg cell depletion.
a, Tumor region identification in KP LuAd sections using Visium ST. The fraction of tumor cell RNA in each Visium spot (top right) was determined by BayesPrism deconvolution, binarized (bottom right; Methods), and compared to histological H&E images (left). b, Factor scores and Bonferroni-adjusted two-sided t-test P values differentially expressed factors between control and Treg cell-depleted conditions in ST. c,d, Representative tissue sections from control (left) or Treg cell-depleted (right) conditions. Tumor regions are outlined, and spots are colored by factor score. Scores represent IC (c; 18 genes) or IFN (d; 103 genes) gene programs shared across all lineages (Br, bronchi; A/V, artery/vein; LV, lymphatic vessel; IAs, immune cell aggregates). e, ST analysis revealed distinct signaling niches. Spots were assigned to niches based on thresholding a gamma distribution fitted to IC or IFN signaling module scores across all spots (Methods). f, Enrichment of cell-type RNA fractions in signaling niches. Adjusted empirical P value corresponds to the probability of obtaining the mean observed RNA fraction for that cell type (Methods). Fractions with adjusted P > 0.01 are not shown. In a and ce, images are representative of, and analysis performed on (b and f), one of two serial sections for each of four samples (DT and Ctrl, two biological replicates each). Source data
Fig. 5
Fig. 5. High-plasticity state and heterogeneity revealed by lung adenocarcinoma responses to Treg cell depletion.
a, ST analysis of tumor states. BayesPrism deconvolution using additional labeled tumor cells from Yang et al. was performed to assign tumor-state-specific RNA fractions. Correspondence of regions with highlighted differential tumor states (middle) to H&E section is shown (right). Dashed lines denote regions with the indicated dominant tumor states (red, high plasticity; yellow, EMT; black, lung progenitor-like). b, Spots labeled by tumor-state cluster. In a and b, images are representative of, and analysis performed on (c and d), one of two serial sections for each of four samples (DT and Ctrl, two biological replicates each). c, Quantification of tumor lesion area types across Treg cell depletion and control conditions (left) or between tumors with or without detectable immune response in Treg cell-depleted condition (right; N = 85 lesion areas). d, Differential gene expression (two-sided Wilcoxon test Benjamini–Hochberg adjusted) of tumor spots in lesions with and without immune response to Treg cell depletion. e, Log-normalized expression of Sox9 and Pf4 (Cxcl4) in a representative tumor-bearing lung section after Treg cell depletion. Inset at top left indicates immune response status of tumor lesion areas. Source data
Fig. 6
Fig. 6. Local histological and immune response heterogeneity following Treg cell depletion.
a, H&E staining of representative tumor section characterized by histological and immune response state heterogeneity after Treg cell depletion. Insets at bottom represent a zoomed-in view of gastric (left) and high-plasticity (right) areas. Black arrows highlight neutrophil infiltration in a high-plasticity area. b, Tumor RNA fraction within highlighted high-plasticity and gastric epithelial states (left) and gene expression modules (right) of tumor lesion shown in a. Images are representative of one of two serial sections for each of four samples (DT and Ctrl, two biological replicates each). Source data
Fig. 7
Fig. 7. Factor analysis of Treg cell ‘dependencies’ of accessory cell transcriptional states in human and mouse lung adenocarcinomas.
a, Schematic of the experimental design. b, t-SNE plot of all cells (82,991 total cells) from 25 primary human LuAd or local metastases labeled by lineage. c, t-SNE of T/NK cell lineage colored by unique molecular identifier (UMI) counts of Treg cell marker genes (maximum of two). d, Jaccard similarity between genes associated with mouse and human factors in tumor endothelial cells. Factors of interest with high correlation are highlighted by a green box. e, Conservation of activated VEC signature genes. Normalized gene loading (fraction of gene score across all factors) of genes within the mouse activated VEC signature across all human endothelial factors. Upper and lower notches of the box plot correspond to the 75th and 25th quartiles, respectively, and the middle notch corresponds to the median. Whiskers extend to the farthest data point no more than 1.5 times the interquartile range from the hinge, with outliers beyond that displayed as individual points. Select genes with high loadings of factors 3 and 5 are highlighted (N = 45 genes). f, Mean log2 sum of inflammation/angiogenesis associated human endothelial factor (3, 4 and 5) cell loadings plotted against log2 Treg cell proportion in each human sample. Spearman correlation estimate (R) and P value are listed. Trend line represents a linear model fit between the two and shading indicating the 95% confidence interval (N = 19 human samples). g, Normalized gene scores (fraction of gene scores across all factors) in orthologous genes between mouse and human inflammation/hypoxia factors. Genes significantly attributed to both human factors and mouse factors are highlighted as conserved. VEGF-induced genes in endothelial cells were derived from the CytoSig database. Source data
Fig. 8
Fig. 8. Systemic or intratumoral CCR8+ Treg cell depletion combined with VEGF blockade restrains KP adenocarcinoma progression.
a, Schematic of the experimental design; s.c., subcutaneous. b, Tumor growth dynamics upon the indicated therapeutic interventions. The data represent mean values of tumor volume measurements (left). Adjusted P values for day 20 measurements: PBS-IgG versus DT-IgG P < 0.0001; PBS-IgG versus PBS-αVEGF P = 0.0004; PBS-IgG versus DT-αVEGF P < 0.0001; DT-IgG versus PBS-αVEGF P = 0.0328; DT-IgG versus DT-αVEGF P = 0.0109; PBS-αVEGF versus DT-αVEGF; P = 0.0005. Representative image of tumor volumes at day 20 (center). Kaplan–Meyer survival curves followed by log rank (Mantel–Cox) of KP tumor-bearing mice (right). The ‘survival’ time reflects the end point of the experiment when tumor volume in individual mice reached 1 cm3; adjusted P values: PBS-IgG versus DT-IgG P = 0.0012; PBS-IgG versus PBS-αVEGF P > 0.05 (NS), PBS-IgG versus DT-αVEGF P = 0.0078; DT-IgG versus PBS-αVEGF P > 0.05 (NS); DT-IgG versus DT-αVEGF P = 0.05; PBS-αVEGF versus DT-αVEGF P = 0.0186. c,d, Quantification of the indicated immune cell subsets and frequencies of activated (CD44hi CD62lo), proliferating (Ki67+) and IFN-γ-producing TCRβ+ CD4+ and TCRβ+ CD8+ cells in tumor samples shown in Fig. 8b in the indicated experimental groups of mice analyzed on day 20. e, Representative HIF1α and TUNEL staining of KP tumor sections. f, Quantification of HIF1α expression and apoptosis (TUNEL staining) in KP tumor sections; staining areas and signal intensity normalized by the total area and mean background intensity, respectively. 3–5 tumors from each experimental group were analyzed. (PBS-IgG N = 5; DT-IgG N = 4; PBS αVegf N = 3; DT αVegf N = 3) with four sections per individual tumor sample. Data represent the mean ± s.e.m. g, Proportion of intratumoral Treg cells on day 20 after KP tumor transplantation. Data represent the mean ± s.e.m. of one of two independent experiments; N = 8. h, Tumor growth dynamics upon the indicated therapeutic interventions. Gray arrows indicate days of neutralizing antibody administration. The data represent mean values of tumor volume measurements (left). Adjusted P values for day 20 measurements: IgG versus αCCR8 P < 0.0001; IgG versus αVEGF P < 0.0001; IgG versus αCCR8-αVEGF P < 0.0001; αCCR8 versus αVEGF P = 0.0434; αCCR8 versus αCCR8-αVEGF P = 0.0044; αVEGF versus αCCR8-αVEGF P < 0.0001. i, Quantification of proportion and absolute numbers of intratumoral and splenic Treg cells following treatment (left) and the corresponding Treg cell numbers in spleens in the treated animals (right). Data in h and i represent the mean ± s.e.m. of one of two independent experiments, IgG N = 10, CCR8 N = 10, αVegf N = 8, CCR8-αVegf N = 8. j, Tumor growth dynamics upon the indicated therapeutic interventions (left). Gray and black arrows indicate timing of neutralizing antibody and CCR2 inhibitor (CCR2i) administration, respectively. The data represent the mean ± s.e.m. values of tumor volume measurements. Adjusted P values of day 20 measurements: IgG versus αCCR8 P = 0.0009; IgG versus αVEGF P < 0.0001; IgG versus CCR2i P < 0.0001; IgG versus αCCR8-αVEGF P < 0.0001; IgG versus αCCR8-CCR2i P < 0.0001; αCCR8 versus αVEGF P = 0.9982; αCCR8 versus CCR2i P = 0.6138; αCCR8 versus αCCR8-αVEGF P < 0.0001; αCCR8 versus αCCR8-CCR2i P = 0.0041; αVEGF versus CCR2i P = 0.9551; αVEGF versus αCCR8-αVEGF P = 0.0003; αVEGF versus αCCR8-CCR2i P = 0.0363; CCR2i versus αCCR8-αVEGF P = 0.0018; CCR2i versus αCCR8-CCR2i P = 0.2271; αCCR8-αVEGF versus αCCR8-CCR2i P = 0.4530. Plots include data from two independent experiments combined with nine animals in each group in experiment 1 (IgG N = 9, αCCR8 N = 9, αVEGF N = 9, CCR2i N = 9, αCCR8 N = αVEGF-9, αCCR8-CCR2i N = 9) and 4–6 animals per group in experiment 2 (IgG N = 4; CCR2i N = 6; CCR8-CCR2i N = 6). k, Kaplan–Meyer survival curves followed by Log-rank (Mantel–Cox) of KP tumor-bearing mice. The ‘survival’ time reflects the end point of the experiment when tumor volume in individual mice reached 1 cm3. Adjusted P values: IgG versus αCCR8 ***P < 0.0001; IgG versus αVEGF ***P < 0.0001; IgG versus CCR2i ***P < 0.0001; IgG versus αCCR8-αVEGF ***P < 0.0001; IgG versus αCCR8-CCR2i ***P < 0.0001; αCCR8 versus αVEGF P = 0.5687 (NS); αCCR8 versus CCR2i P = 0.7411 (NS); αCCR8 versus αCCR8-αVEGF ***P = 0.0002; αCCR8 versus αCCR8-CCR2i P = 0.0342; αVEGF versus CCR2i P = 0.8054 (NS); αVEGF versus αCCR8-αVEGF ***P = 0.0006; αVEGF versus αCCR8-CCR2i P = 0.0666 (NS); CCR2i versus αCCR8-αVEGF ***P = 0.0003; CCR2i versus αCCR8-CCR2i P = 0.6749 (NS); αCCR8-αVEGF versus αCCR8-CCR2i *P = 0.0489. Plots include data from two independent experiments combined with 5–11 animals in each group in experiment 1 (IgG N = 9, αCCR8 N = 9; αVEGF N = 9; CCR2i N = 11; αCCR8-αVEGF N = 9; αCCR8-CCR2i N = 5) and 4–10 animals per group in experiment 2 (IgG N = 7; CCR2i N = 10; CCR8-CCR2i N = 4). In bd, h and i, plots are representative of one of two experiments with 8–10 mice per group each, at day 20 after transplantation. Number of mice per group in b and c: PBS-IgG N = 10; DT-IgG N = 10; PBS-αVEGF N = 9; DT-αVEGF N = 9; number of mice per group in h and i: IgG N = 10; αCCR8 N = 10; αVEGF N = 8; αCCR8-αVEGF N = 8. Source data
Extended Data Fig. 1
Extended Data Fig. 1. Short-term Treg depletion in lung KP adenocarcinoma bearing mice.
(a, b, d) Representative gating of normal and tumor (EpCAM) cells, (D) TCRβ+CD4+ (CD4), TCRβ+CD8+ (CD8) T cells, myeloid cells (MHCII+GR1-CD11b+), neutrophils (Neu) (MHCII-GR1+CD11b+), vascular endothelial cells (VEC) (CD45-CD31+GP38), fibroblasts (Fib) (CD45-CD31-GP38+), and lymphatic endothelial cells (LEC) (CD45CD31+GP38+) (A, B) in KP-lungs in diphtheria toxin (DT, N = 3) and PBS (Ctrl, N = 4) mice and (D) in tumor-free lungs (DT, N = 4), PBS (Ctrl, N = 4). (c, e) Cell frequencies in KP tumors from (A, B, D). Data represent mean ± SEM of one of two independent experiments. (c) Two-way ANOVA alpha = 0.05, Šídák’s multiple comparisons CD4 t = 2.254, df = 35 ns P = 0.1953, CD8 t = 1.235, df = 35 ns P = 0.8320, MHCII+/Gr1- CD11b+ (MAC/DC) t = 0.5098 df = 35 ns P = 0.9987, MHCII-/Gr1+ CD11b+ (Neu) t = 2.985, df = 35, * P = 0.0355, VEC, t = 0.2030, df = 35 ns P>0.9999, Fib t = 0.09821, df = 35 ns P>0.9999, Lec t = 0.08549, df = 35 ns P>0.9999. (e) Two-way ANOVA, Alpha = 0.05, Tukey’s multiple comparisons EC, t = 1.056. df = 12, ns P = 0.5261 Tumor t = 1.217, df = 12, ns P = 0.4332. (f) Fold change (FC) deferentially expressed genes (DEG). (g) k-means clustering of FC DEG between DT and Ctrl. Columns - log2 FC (DT/Ctrl) for cells, each row is a gene. Select genes are labeled. (h) Z-score-normalized counts for selected genes in (G). (i) Cell frequencies in tumor-free DT and Ctrl lungs. Two-way ANOVA, alpha = 0.05, Šídák’s multiple comparisons. Epcam t = 0.3437, df = 37, ns P>0.9999, CD4 t = 1.413, df = 32 ns 0.769, CD8 t = 1.434, df = 32 ns P = 0.7550, MHCII+/Gr1- CD11b+ (MAC/DC) t = 0.8971, df = 32, ns P = 0.9771, MHCII-/Gr1+ CD11b+ (Neu) t = 3.664, df = 32 ** P = 0.0071, VEC t = 0.3854, df = 32 ns P>0.9999, Fib t = 0.008845, df = 32 ns P>0.9999, LEC t = 0.01251, df = 32 ns P>0.9999. Data represent mean ± SEM of one of two independent experiments N = DT-3, PBS-3. (j) DEG Numbers. (k) FC DEG in cells isolated from tumor-free lungs of DT vs Ctrl mice. (F, J, K) DEG - differentially expressed genes (p<0.05). Red-upregulated, blue-downregulated. Source data
Extended Data Fig. 2
Extended Data Fig. 2. scRNA-seq analysis and annotation of major TME cell types in lung KP adenocarcinomas.
(a) Sorting strategy. CD45+ and CD45 cells were sorted from lungs of PBS (Ctrl) and DT treated (48 hr) mice (3 mice per group) harboring KP lung tumors. (b) t-SNE plots embedding (27,606 cells) representing distribution of all the cells isolated in (A), colored by PhenoGraph clusters (k = 30) (left), or sample (right) (related to Fig. 2a, which shows major cell lineages). (c) Heatmap showing the average expression of cell type specific markers in each cluster. The rows are genes and columns are clusters. Shown expression is row normalized between 0–1 and genes are grouped to indicate the subtype they typically are associated with. All the genes used for annotation are shown. (d) t-SNE embedding (same as B) colored by lineages inferred using the average expression of each cluster shown in the heatmap in (C). (e) t-SNE embedding reflecting experimental conditions (Ctrl: PBS, gray; DT: diphtheria toxin, red). Source data
Extended Data Fig. 3
Extended Data Fig. 3. Heatmaps of Treg depletion-induced gene expression changes in fibroblasts, endothelial and myeloid cells in lung KP adenocarcinomas.
(a) Heatmap showing the average expression of known endothelial markers in each endothelial cell cluster. Rows indicate cluster and columns indicate genes. The heatmap is column normalized between 0–1 and the genes are grouped to indicate the subtype they typically are associated with (top). t-SNE embeddings (2815 cells) (bottom) representing distribution of endothelial cells color coded by their cluster identity inferred using the gene expression pattern for each cluster shown in the heatmap (left) and cell type annotation derived from the heatmap above (right). All genes used for annotation are shown. (b) Same as (A) for fibroblasts. (c) Same as (A) for myeloid cells. Source data
Extended Data Fig. 4
Extended Data Fig. 4. Neighborhood analysis of Treg depletion-induced gene expression changes in endothelial cells, fibroblast and myeloid cells in lung KP adenocarcinomas.
(a) t-SNE embedding of fibroblasts (3,791 cells) (top) color coded by cell subtype (left) or experimental condition (right). A density plot of the distribution of fibroblasts between conditions (bottom). Ctrl – PBS, gray; DT - diphtheria toxin, red. (b) Graph of neighborhoods of fibroblast cells computed using MiloR and embedded on t-SNE (top). Each dot represents a cellular neighborhood and is color coded by the FDR corrected p-value (alpha = 1) quantifying the significance of enrichment of DT cells compared to control in each neighborhood. The size of the dot represents the number of cells in the neighborhood. (bottom). Swarm plot depicting the log-fold change in differential abundance of DT treated cells against control cells in each neighborhood across different fibroblast cell types. Each dot represents a neighborhood and is color coded by the FDR corrected p-value (alpha = 1) quantifying the significance of enrichment of DT cells compared to control in each neighborhood. A neighborhood is classified as a cell type if it comprises at least 80% of cells in the neighborhood, or called ‘mixed’ otherwise. (c) Same as (A) for myeloid cells. (d) Same as (B) for myeloid cells. Source data
Extended Data Fig. 5
Extended Data Fig. 5. Factor analysis of Treg-dependent gene expression by fibroblasts and myeloid cells in lung KP adenocarcinomas.
(a) Heatmap showing factor cell score across experimental conditions averaged over each fibroblast cluster in each experimental condition. The rows are factors and columns are clusters for each experimental condition. The clusters are grouped based on the cell type they are associated with. The heatmap is row normalized from 0–1. (b) Heatmaps showing the top 200 genes that correlate the most with imputed cell scores of the indicated factors (see Methods) for fibroblast subsets. Each column is a cell; cells are ordered based on their factor score in ascending order from left to right indicated by the green bar. The experimental condition for each cell is indicated by the grey for PBS (Ctrl) and red for diphtheria toxin-treated conditions (DT) bar. Select examples of genes of interest are noted. (c) Heatmap as in A for myeloid cells. (d) Heatmaps as in B for myeloid cells. Source data
Extended Data Fig. 6
Extended Data Fig. 6. Treg-dependent gene expression changes in endothelial and myeloid cells in bleomycin-induced lung inflammation vs KP adenocarcinomas.
(a) Schematic of the experimental design. (b) Numbers of Treg and effector T cells in Ctrl (PBS) and DT (Diphtheria Toxin) treated lungs, at day 21 after bleomycin administration. (Left) Two-way ANOVA, Alpha = 0.05, followed by Tukey’s multiple comparisons test was performed. PBS Ctrl vs. PBS BL, q = 11.66 df = 8 ***P = 0.0002, PBS Ctrl vs. DT Ctrl q = 0.9285, DF = 8, ns P = 0.9103. PBS Ctrl vs. DT BL q = 0.1986, df = 8 ns P = 0.9989. DT Ctrl vs. DT BL q = 0.7299 df = 8, ns P = 0.9529. Center Two-way ANOVA, Alpha = 0.05, followed by Šídák’s multiple comparisons test was performed. PBS Ctrl vs DT Ctrl t = 0.3479 df = 8 ns P = 0.9997, PBS BL vs DT BL t = 1.575 df = 8 ns P = 0.633. (Right) Two-way ANOVA, Alpha = 0.05, followed by Tukey’s multiple comparisons test was performed. PBS Ctrl Vs DT Ctrl q = 00.7223 df = 8 ns P = 0.9542 PBS BL vs DT BL t = 0.1102 df = 8 ns P = 0.9998. A representative of two independent experiments with 3 mice per group in each is shown. (c, d) t-SNE embedding of endothelial cells isolated from lungs of DT treated and Ctrl mice color coded by cell type (left) or experimental condition (middle) and density plots of the distribution of endothelial cells between conditions (right). (c) fibroblast, (D) myeloid cells. (e) Heatmaps showing the top 200 genes that correlate the most with imputed cell scores of the indicated factors for endothelial cells. Each column is a cell; cells are ordered based on their factor score in ascending order from left to right indicated by the green bar. The treatment condition for each cell is indicated by grey (Ctrl) and red (DT) bars. Select genes of interest are shown. Source data
Extended Data Fig. 7
Extended Data Fig. 7. Robustness and validation of BayesPrism deconvolution.
(a) For each cell type, Spearman’s correlation of cell fraction across all spots was calculated between deconvolution using all available reads and 1 of 20 separate deconvolutions using the available reads downsampled to 90%. Points represent the mean of the 20 Spearman’s correlation calculations and error bars are the minimum and maximum correlation values. (b) Comparison of cell fractions across separately deconvolved serial sections. For all four biological samples, the average cell fraction for each cell type is plotted in the first serial section relative to the second. Trend line indicates a slope of 1. Spearman’s correlation is shown. (c) Comparison of average log cell fractions in each of 8 tissue sections using the standard scRNA-seq reference or the reference with tumor RNA substituted for KP-Tracer tumor cells. Trend line indicates a slope of 1. Spearman’s correlation is shown. (d, e). Examples of positive spots for certain populations of interest are associated with histological features. Images are from representative areas of control and Treg depleted tissue sections. Plots with positive spots display the same example areas in the top of each panel arrangement with the H&E stained image at lower resolution. (Br = bronchi; A/V = artery / vein; LV = lymphatic vessel). Analysis performed on (A-C) and images are representative of (D-E), one of two serial sections for each of four samples (DT and Ctrl two biological replicates each). One experiment was performed. Source data
Extended Data Fig. 8
Extended Data Fig. 8. Spatial transcriptomic analysis of tumor cell states perturbed in response to Treg cell depletion.
(a) Hierarchical clustering of tumor spots by tumor state RNA fractions. (b) Log normalized expression of tumor state marker genes in assigned spot clusters from A. (c) H&E staining of 3 independent KP tumor sections (in addition to those shown in Fig. 5b) with tumor spots denoted by their assigned cluster in A. (d) Number of tumor lesion areas identified across all lung tumor states in control or Treg depleted mice (85 tumor lesions total). (e) Number of tumor lesion areas identified in Treg depleted sections across all tumor states colored by immune response status in Treg depleted mice (N = 38 tumor lesion areas). (f) Differentially expressed genes (Wilcoxon test BH adjusted) between tumor cells between control and Treg depleted conditions. (N = 239 cells total). (g) GSEA of differentially expressed genes in F within gene sets defined by different tumor clusters identified in Marjanovic et al. which partially align with tumor states identified by deconvolution. Dashed line indicates adjusted p-values <0.05. (NES = normalized enrichment score; HPCS = high plasticity cell state). Analysis performed on (A-D, B-G) and images are representative of (C), one of two serial sections for each of four samples (DT and Ctrl two biological replicates each). One experiment was performed. Source data
Extended Data Fig. 9
Extended Data Fig. 9. Clustering and cell linage annotation of scRNA-seq datasets of human lung adenocarcinomas.
(a) Heatmap displaying genes used to determine lineage assignments for single cell PhenoGraph clusters in human LuAd samples. Color bar represents the mean log normalized gene expression in each PhenoGraph cluster scaled from 0 to 1 for each gene. (b) Global t-SNE embedding across of all human lineages as in Fig. 4b colored by sample. ID. All genes used for annotation are shown. (c, d) t-SNE embeddings of the T/NK lineage colored by PhenoGraph cluster (C) or sample ID (D). Source data
Extended Data Fig. 10
Extended Data Fig. 10. Association of Treg abundance with transcriptional features of endothelial cells in human LuAd and loadings of human and mouse fibroblast and endothelial cell factors.
(a) Treg proportion of hematopoietic cells (CD45+) calculated from scRNA-seq data across all samples. (b) Treg proportion of hematopoietic cells compared to the Treg proportion of CD3+ cells across all human samples. (c) Mean log2 cell loading of CAR4+ capillary (factor 3) and other inflammation/hypoxia associated human endothelial factors (4,5) plotted against log2 Treg proportion in each patient sample. Spearman correlation estimate (R) and p value are listed. Trend line represents a linear model fit between the two and shading indicating the 95% confidence interval. (d) t-SNE of human endothelial cells colored by factor 3, 4, or 5 cell loading (max 2.5) or sample ID. (N = 19 patient samples). (e,g) Heatmap showing Jaccard similarity of genes associated with human and mouse fibroblast (E) or myeloid (G) factors. (f,h,i) Mean log2 cell loading of factors negatively associated with Treg frequency in fibroblasts (F) and myeloid cells (H), or positively associated in myeloid cells (I) plotted against log2 Treg proportion in each patient sample. Spearman correlation estimate (R) and p value are listed. Trend line represents a linear model fit between the two and shading indicating the 95% confidence interval. (fibroblast N = 20; myeloid N = 23). (j) Heatmap showing the Spearman’s correlation between Treg cell frequency associated human factors with conserved trends in mouse Treg-depletion. Source data

References

    1. Josefowicz SZ, Lu L-F, Rudensky AY. Regulatory T cells: mechanisms of differentiation and function. Annu. Rev. Immunol. 2012;30:531–564. doi: 10.1146/annurev.immunol.25.022106.141623. - DOI - PMC - PubMed
    1. Sakaguchi S, et al. Regulatory T cells and human disease. Annu. Rev. Immunol. 2020;38:541–566. doi: 10.1146/annurev-immunol-042718-041717. - DOI - PubMed
    1. Glasner A, Plitas G. Tumor resident regulatory T cells. Semin. Immunol. 2021;52:101476. doi: 10.1016/j.smim.2021.101476. - DOI - PMC - PubMed
    1. Bos PD. Treg cells in cancer: beyond classical immunological control. Immunol. Invest. 2016;45:721–728. doi: 10.1080/08820139.2016.1222206. - DOI - PubMed
    1. Bos PD, Plitas G, Rudra D, Lee SY, Rudensky AY. Transient regulatory T cell ablation deters oncogene-driven breast cancer and enhances radiotherapy. J. Exp. Med. 2013;210:2435–2466. doi: 10.1084/jem.20130762. - DOI - PMC - PubMed

Publication types

Substances